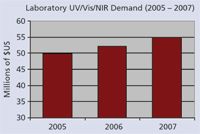
Market Profile: UV/Vis/NIR
While the overall laboratory UV and Visible spectroscopy market was worth well over $700 million in 2007, the UV/Vis/NIR segment represented less than 10% of it. UV/Vis/NIR instruments utilize multiple detectors to cover a broader spectrum of analysis, and typically are among the highest-end systems in the UV-Vis market.
More basic and more common UV-Vis spectrophotometers typically make use of a photomultiplier (PMT) detector, which covers the UV and visible spectrum, as well as a portion of the very near infrared (NIR) spectrum up to about 1100 nm. In order to cover the complete NIR spectrum, UV/Vis/NIR systems typically combine a PbS (lead sulfide) detector with the PMT detector, expanding the range to cover the entire NIR spectrum up to 2500 nm, and often well into the mid-infrared, up to 3300 nm. Other, higher performance systems might utilize an InGaAs (indium gallium arsenide) detector instead, which is only capable of up to about 1800 nm, but provides better resolution and eliminates some of the gap in performance that can exist between PMT and PbS detection ranges. Some of the newer UV/Vis/NIR systems on the market actually combine all three, making for a more expensive but higher performance instrument.

Conventional UV/Vis/NIR instruments are utilized most heavily in applications related to semiconductor, electronics, fiber optics, and other materials used in photonics. Although there is some use in the pharmaceutical and biotechnology industry, microplate readers generally handle such applications, which typically involve the analysis of liquids, rather than solids.
The worldwide market for UV/Vis/NIR spectrophotometers was nearly $50 million in 2007, about two-thirds of which was related to initial systems. Average longer-term annual growth should be in the mid-single digits, although 2008 looks to be somewhat of a down year thanks to a likely downturn in the semiconductor and electronics industry.
The foregoing data were based on SDi's market analysis and perspectives report entitled Edition Global Assessment Report, 9th Edition: The Laboratory Life Science and Analytical Instrument Industry, September 2006. For more information, contact Stuart Press, Senior Consultant, Strategic Directions International, Inc., 6242 Westchester Parkway, Suite 100, Los Angeles, CA 90045, (310) 641-4982, fax: (310) 641-8851, www.strategic-directions.com.
Smarter Sensors, Cleaner Earth Using AI and IoT for Pollution Monitoring
April 22nd 2025A global research team has detailed how smart sensors, artificial intelligence (AI), machine learning, and Internet of Things (IoT) technologies are transforming the detection and management of environmental pollutants. Their comprehensive review highlights how spectroscopy and sensor networks are now key tools in real-time pollution tracking.
New Study Reveals Insights into Phenol’s Behavior in Ice
April 16th 2025A new study published in Spectrochimica Acta Part A by Dominik Heger and colleagues at Masaryk University reveals that phenol's photophysical properties change significantly when frozen, potentially enabling its breakdown by sunlight in icy environments.
Real-Time Battery Health Tracking Using Fiber-Optic Sensors
April 9th 2025A new study by researchers from Palo Alto Research Center (PARC, a Xerox Company) and LG Chem Power presents a novel method for real-time battery monitoring using embedded fiber-optic sensors. This approach enhances state-of-charge (SOC) and state-of-health (SOH) estimations, potentially improving the efficiency and lifespan of lithium-ion batteries in electric vehicles (xEVs).
Smart Optical Sensors for Thermal Management in Electric Vehicles
April 8th 2025A recent review in Energies explores the latest advancements in sensor applications for electric vehicle (EV) thermal management systems. The study, authored by Anyu Cheng, Yi Xin, Hang Wu, Lixin Yang, and Banghuai Deng from Chongqing University of Posts and Telecommunications, along with industry partners, examines how advanced optical sensors improve the efficiency, safety, and longevity of EVs.
