Metabolomics Workflows: Combining Untargeted Discovery-Based and Targeted Confirmation Approaches for Mining Metabolomics Data
Special Issues
The metabolomics workflow described here combines untargeted (discovery) quadrupole time-of-flight (Q-TOF) liquid chromatography–mass spectrometry (LC–MS), targeted (confirmation) triple-quadrupole LC–MS-MS, and sophisticated data mining as an effective means to elucidate metabolite changes.
A successful metabolomics study requires a workflow strategy that can unravel the complexity of the data and reveal the real changes that occur in the system. A workflow that combines untargeted (discovery) quadrupole time-of-flight (Q-TOF) liquid chromatography–mass spectrometry (LC–MS), targeted (confirmation) triple-quadrupole LC–MS-MS, and sophisticated data mining is an effective means to elucidate metabolite changes.
Metabolomics, one of the disciplines driving systems biology, is the effort to understand the interactions between the components of entire biological systems and how these interactions give rise to the function and behavior of those systems. The metabolome is the complete set of small-molecule metabolites present in a biological cell, tissue, organ, or organism. The word was coined in analogy with genomics, transcriptomics, and proteomics, and like these other "omics," the metabolome is dynamic and ever-changing. Metabolomics is therefore the systematic study of the unique chemical fingerprints that specific cellular processes produce, and it can provide an instantaneous snapshot of the physiology of that biological system. In combination with the other "omics," metabolomics can lead to a better understanding of the biological system.
One of the key challenges in metabolomics is the unraveling of the complex sets of data, which can include many experimental artifacts, and it is compounded by the tremendous chemical diversity of metabolites (1). In fact, identification of each uncharacterized metabolite is in many ways its own puzzle. Effective data reduction and prioritization strategies are critical to generate meaningful metabolomics data and an accurate understanding of the metabolic state of a biological system.
Metabolomics in Disease Progression
Metabolic changes occur upon infection of a host organism. These changes can be used to help understand the etiology of a disease and thus devise diagnostics and medical treatments for it. Malaria is a disease of global importance, as well as one of the most serious infectious diseases, with approximately 300 million clinical cases and more than 1 million deaths annually. This study describes metabolomic changes that occur due to malaria infection and demonstrates the utility of a combined untargeted (discovery) liquid chromatography–mass spectrometry (LC–MS) and targeted (confirmation) LC–MS-MS workflow.
Workflow Strategy
Metabolomics workflows typically involve LC–MS analyses (Figure 1). A molecular feature extraction (MFE) algorithm is used to find metabolite peaks in complex data sets with no prior knowledge of the compounds present in the sample. A find-by-formula (FbF) data extraction algorithm is used to find known metabolite peaks in LC–quadrupole time-of-flight (Q-TOF) data using the empirical formula in a compound database to direct the extraction. The results that are generated by implementing these algorithms are subsequently imported into Mass Profiler (MP) or Mass Profiler Pro (MPP) data analysis software (Agilent Technologies, Santa, Clara, California) for data filtering, statistical analysis, and visualization of results. After a preliminary conclusion is reached from this untargeted, or "discovery," data analysis approach, a targeted analysis is typically performed on the significant entities (putative compounds) using a triple-quadrupole LC–MS-MS system (Agilent 6460) in multiple reaction monitoring (MRM) mode. MRM studies are used to quantify the metabolites identified in the initial data mining experiment to confirm the discovery results.
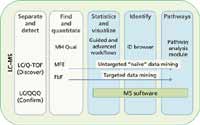
Figure 1: A graphical representation of a workflow strategy used for metabolomics studies. Metabolomics workflow from separation to pathway analysis typically involves LCâMS analyses. Molecular feature extraction (MFE) and find-by-formula (FbF) are two algorithms in MassHunter Qual software (Agilent Technologies) used for finding peaks. All the result files generated by the different analytical platforms can be imported into Mass Profiler Pro (MPP) for statistical analysis and visualization.
Untargeted Data Mining
Metabolomics workflows typically include several steps: sample preparation, chromatographic separation, mass spectrometry detection of ions, data file analysis, compound finding, multiple data file alignment, statistical analyses of the different conditions (variables), and compound identification. The aqueous phase extracts for control normal red blood cells (NRBC) and malaria-infected red blood cells (IRBC) were first analyzed by LC–Q-TOF-MS in both positive and negative ion modes. The data files were processed in MassHunter Qual software (Agilent Technologies) using first a naïve, untargeted data mining approach, followed by a targeted data mining approach using a list of known compounds. To accomplish the naïve search, MFE was used to process the data files. Each of the thousands of extracted compound chromatograms was automatically drawn by the software and user-inspected before a Compound Exchange File (.cef) was generated for each sample file.
After data processing in MassHunter Qual, the .cef files were imported into the MPP software for analysis. The "Guided Workflow" was selected from the menu, to follow in a step-by-step fashion a series of analytical steps including feature alignment, data file grouping, filtering, quality control, statistical analysis, and compound identification. Pathway analysis was performed as part of the "Advanced Workflow."
Determining Variability between Various Conditions for NRBC and IRBC Groups
The data was filtered to create entity (metabolite) lists based on the number of entities detected in at least one condition of the NRBC and IRBC sample replicates. The results are summarized in Table I, which reveals the average number of entities per group in ESI+, ESI-, and atmospheric pressure chemical ionization (APCI+) modes, across pH 2, pH 7, and pH 9 extracted samples. For a given condition (that is, pH), filtered entity lists were created based on the number of entities that passed sample replicate thresholds. Due to the limited number of biological replicates in this experiment, stringent replicate threshold conditions (100%) were used as input for the subsequent step, "Filter by sample variability." In this case, entities displaying a coefficient of variation (CV) of signal abundance greater than 100% per condition were filtered away. This ensured that only highly reproducible data were analyzed in subsequent steps.

Table I: The number of features detected in each condition, NRBC and IRBC, is summarized for samples extracted under different solvent pHs, using both ESI and APCI sources and polarities and 75% and 100% sample replicate thresholds
Principle components analysis (PCA) highlighted the difference between NRBC and IRBC samples, extracted under the various pH conditions. Figure 2 shows the distribution of the samples along the three major principle components. The most significant difference observed was the separation of samples based on solvent pH, confirming a previously published observation for RBCs (2). Thus, these results suggest that one can maximize metabolite coverage by including additional aqueous solvent extractions at pH 2 and pH 9, as well as pH 7. Furthermore, a closer inspection of the PCA plot for pH 7 extracts, by rotation about the axes, highlighted clear separation between IRBC and NRBC samples.
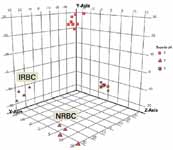
Figure 2: Principle components analysis (PCA) of metabolite data from biological replicate samples highlights variability in abundance profiles between NRBC and IRBC for pH 7 extracted samples.
Determining Significant Abundance Differences of Compounds across Groups
A list of entities (metabolites) that were differentially expressed between IRBC and NRBC samples was generated and further data analysis was performed to identify the entities. MPP includes an integrated identification (ID) browser that enables accurate mass compound matching to the METLIN database. For masses that did not match a compound in the database, an empirical formula calculator, called Molecular Formula Generator (MFG), was used to calculate the formula with the "best" match based on the mass accuracy of the isotope masses and their ratios. The entity list displayed results for database matches <5 ppm. One of the compounds, m/z 175.1190, matched the amino acid arginine. After identifying compounds using the ID browser, MPP automatically annotated the entity list and projected the compound names onto the graphical plots and pathways for visualization.
Because PCA had shown group differences based on extracted metabolites abundance profiles when samples were extracted at different pH values, the results of each pH extract were analyzed independently to find entities with statistically significant abundance differences between NRBC and IRBC. A useful tool for visualizing differential abundance between any two different conditions is the volcano plot, which provides a visual summary of p-values and fold-change values, adding statistical significance to the interpretation of the results. The results for a differential abundance analysis of NRBC and IRBC (for the positive ion ESI, pH 7 extracted samples) are summarized in Figure 3, a volcano scatter plot using fold change (FC) and p-value on each axis. A separate table provided details of the actual FC values, p-values, and the direction of regulation for each significant entity, based on the results of an unpaired t-test between NRBC and IRBC samples. The result for one of the tentatively "identified" compounds in this table, arginine, was highly significant, with an absolute FC value of 16. Using the naïve feature extractor MFE, arginine was detected in higher abundance in NRBC samples as compared to IRBC samples.
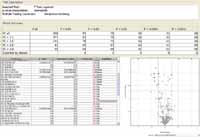
Figure 3: The results of a t-test between NRBC and IRBC samples is displayed as a volcano plot, revealing the fold-change in abundance as well as p-value of significance for each mass entity in a list of compounds that were "identified" using the ID browser. The p-value, fold change, and directionality of regulation are also summarized in a table. For example, arginine levels appear to be significantly reduced or absent in IRBC based on the result of log2 transformation of the abundances, expressed as a ratio.
Hierarchical Cluster Analysis of Entities and Conditions
Hierarchical cluster analysis was performed to organize the entities (metabolites) and replicate samples in the two conditions into clusters based on the similarity of their abundance profiles. This resulted in a hierarchical tree for the identified entities and a hierarchical tree for the conditions, organized into a heat map. The heat map confirmed the separation of the sample replicates for the two conditions. Figure 4 includes the differential abundance pattern for arginine between the IRBC and NRBC groups in the tree, with the branches colored red and blue respectively.
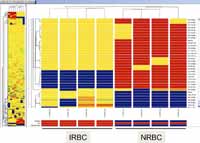
Figure 4: Hierarchical cluster analysis organized the replicate samples into two distinct clusters based on the similarity of entities' abundance profiles for the NRBC and IRBC conditions. Clustering analysis by entity profiles across sample groups allows for the grouping together of compounds that have similar abundance profiles. This may reveal interesting relationships, as entities that exhibit similar behavior across a set of experimental conditions may share similar reaction pathways.
Targeted Data Mining of Q-TOF Data
Feature extraction algorithms that are untargeted or naïve can sometimes compromise detection sensitivity. Therefore, we also analyzed the data with the more exhaustive and sensitive extracted ion chromatogram (EIC)-based FbF algorithm for targeted data mining. Targeted data mining of Q-TOF data was achieved by first creating a list of compound formulas based on literature associated with malaria. The formulas were entered into a new Agilent METLIN personal compound database (PCD) for malaria, which was then queried from within MassHunter Qual against all the sample files to find any matches. The "best" EIC was integrated and .cef files were generated for analysis in MPP. Next, a pathway-specific approach was used in which, for example, the arginine biosynthesis pathway was downloaded in Biopax format (.xml) from Pathway Commons: http://www.pathwaycommons.org/. The file was used by the FbF algorithm in MassHunter Qual with each formula in the pathway automatically queried against each data file. The masses corresponding to the formulas for both citrulline and ornithine, which participate in the arginine biosynthetic pathway, were found in IRBC and NRBC data by targeted analysis.
Pathway Analysis
Compound annotation using the integrated ID browser in MPP enabled the use of integrated pathway software (Pathway Module) to mine interaction databases provided by Agilent that are created using natural language processing of published literature. It was used in conjunction with the imported Biopax formatted arginine biosynthesis pathway. The pathways were searched using an entity list of differential entities to determine which pathways might be relevant. An interactive pathway viewer revealed the average compound abundances for arginine by sample group (Figure 5).
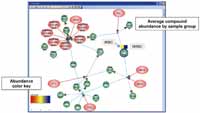
Figure 5: Pathway Architect was used to evaluate MS data in biological context by direct navigation between biological pathways and their associated compounds. The average abundance for arginine (L-Arg) based on the sample group is summarized using an abundance color key in a yellow (IRBC) or blue (NRBC) block.
Confirmation Using MRM Assays
Finally, after several members of the arginine biosynthesis pathway were identified, MRM experiments were performed on arginine, ornithine, and citrulline using a triple-quadrupole LC–MS system to confirm the discovery-based LC–Q-TOF findings, and to provide quantitative information for the levels of several amino acids in this biosynthetic pathway. The inset image in Figure 6 shows the calibration curve for arginine and illustrates the excellent linearity obtained for the three amino acids, with R 2 values greater than 0.999. Figure 6 also illustrates the differential quantitative results between NRBC and IRBC based on MRM transitions for arginine (175.0→70.1), ornithine (133.0→116.1), and citrulline (176.0→159.1). A summary table in Figure 6 lists the relative amounts (in picograms) of each compound determined from the calibration curves based on a 1-µL injection, the associated standard deviation (SD) for the biological replicates, and a calculated amount of each compound contained in 1 mL of RBC suspension. It is clear that the amount of arginine is greater in NRBC relative to IRBC (almost eightfold). Conversely, the relative amounts of ornithine, and particularly citrulline, were increased in IRBC, indicating a reduction in arginine biosynthesis.
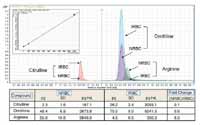
Figure 6: LCâMS-MS analysis of pH 7 extracted metabolite samples on a polar silica hydride column confirms the LCâTOF results. The MRM transitions for arginine, citrulline, and ornithine are displayed. Standard curves (inset) were built across a wide dynamic range (five logs), which enabled the estimation of the concentrations for each compound in each RBC sample. The amounts of each compound extrapolated from the calibration curves are shown in the table for each sample group, along with the standard deviation (SD), extrapolated concentration in 1 mL of cell extract, and the fold change in the amount of each metabolite, NRBC vs. IRBC.
Conclusion
A global metabolomics workflow strategy was used to identify several compounds, including arginine, citrulline, and ornithine, as metabolites whose biosynthesis was altered in in-vitro cultured erythrocytes infected by the malaria parasite. This workflow demonstrates how a discovery-based approach for mining metabolomics data can be subsequently confirmed in a quantitative fashion. Untargeted data mining of LC–Q-TOF-MS data resulted in the detection of thousands of metabolites that were subsequently analyzed to discover patterns of association between sample groups. Differential metabolites were queried against the METLIN PCD for identification. The use of a pathway analysis tool in MPP highlighted the arginine metabolism pathway that also includes the nonstandard amino acids ornithine and citrulline. Subsequent targeted data mining of the original data using EICs corresponding to these two compounds revealed that they were also present at low levels across all samples and that arginine metabolism was likely affected by malaria infection. These findings were subsequently confirmed by MS-MS MRM assays with triple-quadrupole LC–MS, which showed that arginine levels are significantly reduced, whereas citrulline and ornithine levels were elevated in malaria-infected red blood cells. The results from this study illustrate that combining untargeted and targeted approaches is an effective workflow strategy for elucidating metabolomics changes.
Theodore Sana, Steve Fischer, and Shane E. Tichy are with Agilent Technologies, Santa Clara, California.
References
(1) B.P. Bowen and T.R. Northern, J. Am. Mass Spectrom. 21, 1471–1476 (2010).
(2) T.R. Sana et al., J. Chromatogr. B 871, 314–321 (2008).
The RBC cultures and metabolite extractions were performed in the laboratory of Dr. Sandra Chang (Professor of Tropical Medicine, University of Hawaii), whose collaboration is greatly appreciated.
Mass Spectrometry for Forensic Analysis: An Interview with Glen Jackson
November 27th 2024As part of “The Future of Forensic Analysis” content series, Spectroscopy sat down with Glen P. Jackson of West Virginia University to talk about the historical development of mass spectrometry in forensic analysis.
Detecting Cancer Biomarkers in Canines: An Interview with Landulfo Silveira Jr.
November 5th 2024Spectroscopy sat down with Landulfo Silveira Jr. of Universidade Anhembi Morumbi-UAM and Center for Innovation, Technology and Education-CITÉ (São Paulo, Brazil) to talk about his team’s latest research using Raman spectroscopy to detect biomarkers of cancer in canine sera.