Optimization of the Electrospray Ionization Source with the Use of the Design of Experiments Approach for the LC–MS-MS Determination of Selected Metabolites in Human Urine
Special Issues
Simultaneous quantification of metabolites in biological fluids, where they are present at different concentration levels, is usually a challenging analytical task. One of the steps that should be undertaken to increase analytical method efficiency is optimization of the electrospray ionization source (ESI), which can be especially helpful in increasing method sensitivity of agents with poor ionization characteristics. We present here a step-by-step ESI optimization strategy with the use of the design of experiments (DoE. This multivariate statistical approach allows effective evaluation of the effects of multiple factors and interactions among factors on a given response in a minimum number of experimental runs.
Simultaneous quantification of metabolites in biological fluids, where they are present at different concentration levels, is usually a challenging analytical task. One of the steps that should be undertaken to increase analytical method efficiency is optimization of the electrospray ionization (ESI) source, which can be especially helpful in increasing method sensitivity of agents with poor ionization characteristics. We present here a step-by-step ESI optimization strategy with the use of the design of experiments (DoE) approach. This multivariate statistical approach allows effective evaluation of the effects of multiple factors and interactions among factors on a given response in a minimum number of experimental runs.
Since the discovery of a soft ionization technique in the late 1980s, electrospray ionization (ESI), mass spectrometry (MS) started to play a more significant role in the analysis of biological samples. Nowadays, ESI is the most commonly applied method for the ionization of molecules in liquid form and thus, is compatible with the common chromatographic separation techniques, for example, high performance liquid chromatography (HPLC) and ultrahigh-pressure liquid chromatography (UHPLC) (1). Furthermore, it is an ionization technique with considerably low chemical specificity. Ions that are generated in the process are very stable and are not prone to degradation, which is observed in another soft ionization technique, namely matrix-assisted laser desorption ionization (MALDI). Moreover, because of the generation of multiply charged ions there is practically no limit in mass of large molecules in the ionization process. All of these features, together with high ionization efficiency, make ESI the most wide spread ion source in bioanalysis fields such as metabolomics, proteomics, and environmental monitoring (2–5).
When using liquid chromatography coupled with tandem mass spectrometry (LC–MS-MS), one is faced with the difficulty of finding the most optimal ionization parameters for the analysis of tested compounds. Generally, in most cases, basic optimization of MS parameters is conducted by an autotuning procedure, with the use of optimization software supplied by the instrument’s manufacturer. However, when there is a need for sensitivity intensification, further and more detailed optimization of MS parameters might be considered toward an increase of the detector signal (6).
Optimization of experimental parameters in such a complex system may be time consuming or unsuccessful if not designed with a proper plan. Most frequently, optimization of MS parameters is conducted according to a one-variable-at-a-time (OVAT) strategy, in which the effect of tested parameters is assessed by changing the level of a single factor (parameter) while keeping the other factors at nominal levels. This univariate procedure, however, is not recommended as only a small part of the experimental domain is tested and no potential interactions between the factors are taken into account. An OVAT strategy also requires a high amount of experimental runs to be performed (7).
Another optimization strategy uses chemometrics-based, multivariate technique like design of experiments (DoE). DoE enables the determination of significant experimental variables, building mathematical models for the responses, screening factors that have an influence on the response, and final optimization of selected factors. The factors are simultaneously varied among experimental runs according to a defined plan, with the goal to obtain maximum information from a minimum number of experiments. The relation between parameters and responses is described by mathematical modeling and can be well understood by graphical visualization. All interactions between factors are taken into consideration and measured factor effects represent the experimental design space more effectively compared to OVAT (8,9).
This article presents a step-by-step DoE optimization strategy for an electrospray ionization source with the aim to quantitatively analyze 18 compounds in a metabolomic study of human urine. The chosen goal was to improve responses of 7-methylguanine and glucuronic acid, which demonstrated in the developed chromatographic conditions the poorest ionization characteristics in positive and negative ionization modes, respectively. For this purpose, detailed research of factors with potential influence on the response was performed by grouping them in sequential optimization procedures, starting from screening and finishing with the actual optimization phase. Ion source parameters that had significant effect on MS response were selected through a screening procedure, after application of fractional factorial design (FFD). Consecutive optimization of those parameters was performed by applying face-centered central composite design (CCD) for positive ionization mode and Box-Behnken design (BBD) for negative ionization mode. Response surface methodology (RSM) and response surface graphs were used for visual impact assessment of the tested parameters and for defining the most optimal MS settings. As a result of this complex optimization procedure, the significant increase in MS signal was obtained that allowed for the development of a sensitive bioanalytical method for the determination of 18 metabolites in human urine samples in a metabolomics study.
Experimental
Material and Reagents
The compounds 7-methylguanine, 1,7-dimethylxanthine, xanthine, 1-metyluric acid, 3,7-dimethyluric acid, tryptophan, taurine, hypoxanthine, glucuronic acid, gluconic acid, aconitic acid, 2-furoylglycine, N-acetylneuraminic acid, citrulline, hippuric acid, trimethyllysine, suberic acid, acetyllysine, adrenaline, acetic acid (≥ 99,7%), and 0.1 N sodium hydroxide (NaOH) were obtained from Sigma-Aldrich. NaOH micropills were obtained from POCH SA. Pseudouridine and uridine were purchased from Jena Bioscience. LC–MS-grade acetonitrile and HPLC-grade ethanol were purchased from J.T. Baker. Deionized water was acquired from a Milli-QPLUS system (Millipore). ESI-L Low Concentration Tuning Mix was purchased from Agilent Technologies. Finally, 0.2-µm nylon membrane filters were obtained from Agilent Technologies.
Standard Solutions
Standard stock solutions of 5 mg/mL were obtained by dissolving each compound separately in the appropriate solvent (water, ethanol, or a solution of 1 M NaOH ). Stock solutions of 1 mg/mL were prepared for 1,7-dimethylxanthine and 1-methyluric acid in a solution of 0.1 N and 1 M NaOH, respectively. After that, stock solutions were filtered with 0.2-µm nylon membrane filters (Agilent Technologies). Working solutions of 0.05 µg/mL and 1 µg/mL were prepared in water for 7-methylguanine and glucuronic acid, respectively. A mixture containing 0.1 µg/mL of each compound was also prepared by mixing stock solutions of all compounds and diluting with water to obtain the desired concentrations.
Instrumentation
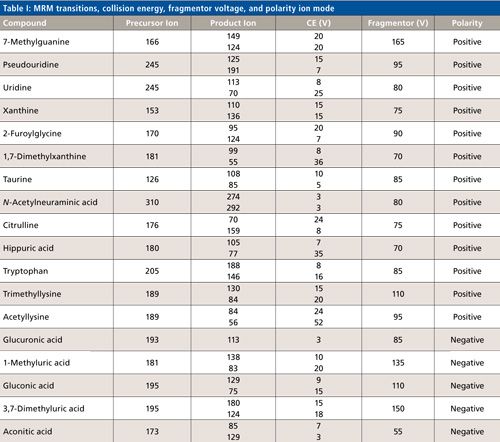
The LC–MS-MS experiments were performed with Agilent 1260 series LC system (Agilent Technologies) coupled with a 6430 Series Triple Quadrupole (QqQ) mass spectrometer (Agilent Technologies) equipped with an ESI source in positive or negative mode. The software used for system control and data processing was MassHunter Workstation (Agilent Technologies). Nitrogen was used as the collision gas. Mobile-phase A was 0.06% acetic acid in water, and mobile-phase B was 0.06% acetic acid in acetonitrile. To optimize the ion source for MS analyses, DoE methods were carried out with a 1-min sample run composed of 1% B in isocratic elution. The capillary voltage, nebulizer pressure, gas flow rate, and gas temperature were optimized in the range of 2000–4000 V, 10-50 psi, 4–12 L/min, and 200–340 °C, respectively. To optimize those parameters for all compounds, the compounds that ionized the least in positive ionization mode (7-methylguanine) and negative ionization mode (glucuronic acid) were chosen. The analyses were carried out in a multiple reaction monitoring (MRM) mode. For the optimization step, MRM transitions monitored for 7-methylguanine and glucuronic acid, were m/z 166 → 149 and m/z 181 → 113, respectively. The precursor ion, product ion, fragmentor, and collision energy for all 18 compounds are shown in Table I. Those transitions were obtained by the use of an Optimizer for Agilent MassHunter Software (Agilent Technologies), and those that could not be found were optimized manually.
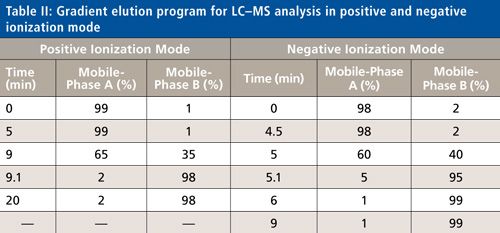
After the optimization step, a mixture of all compounds was analyzed using obtained spectrometric parameters with an optimized chromatographic method. The chromatographic analyses were performed with a gradient elution of mobile-phases A and B on a 150 mm x 4.6 mm, 2.7-µm dp Ascentis Express C18 column with a 2-µm precolumn filter (Supelco Analytical) at 35 °C, with a flow rate of 0.3 mL/min and an injection volume of 2 µL. Next, 20-min and 10-min sample runs were provided for the analyses in positive and negative mode, respectively, under gradient elution, as shown in Table II. The equilibration lasted 12 min and 7 min for the analyses in positive and negative mode, respectively. A urine sample was also analyzed to test the applicability of the method to a biological sample.
Experimental Data Analysis
During the screening step, two-level FFD was applied for the simultaneous investigation of various factors and interactions, to assess their level of significance. In this type of screening design, only a small number of experimental runs is required in contrast to the full factorial design, in which the total amount of experiments is represented by Lf, where L denotes the number of factor levels and f is the number of factors. Such an amount of experiments is assumed as undesirable because of economic limitations and project timeframes. Two-level FFD 2f-v contains only a fraction of the full factorial design and allows users to examine f factors at two levels in N = 2f-v experiments, with 1/2v, that denotes the fraction of the full factorial (where v = 1,2,3, . . .). Thus, despite the fact that the number of experiments is decreased, FFD will generally lead to the same conclusions, however, not all main and interaction effects can be assessed separately (4,5).
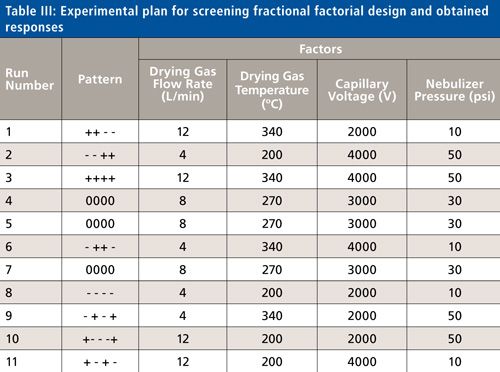
A four-factor, two-level screening FFD was generated using JMP 8.0 statistical software (SAS Institute, Inc.). The design table, including the studied parameters and their ranges, can be found in Table III. In the performed experiments, a 2-µL solution of 7-methylguanine (0.05 µg/mL) and glucuronic acid (1 µg/mL) were injected onto the instrument. An addition of acetic acid to the mobile phase in a concentration of 0.06% provided an acceptable ionization response for all of the tested compounds in both ionization modes. Peak areas of the selected metabolites were chosen as the experimental response with the aim of maximization. Each two-factor interaction was taken into account in the study. The experiments were performed in randomized order to minimize the influence of experimental and systematic bias. After completion of the assigned experiments, peak areas for both metabolites were extracted from a single mass spectrum and entered into the statistical software program to determine the effect of each tested parameters. The factors that were estimated as significant in screening design were afterward used as the main factors in a response surface design.
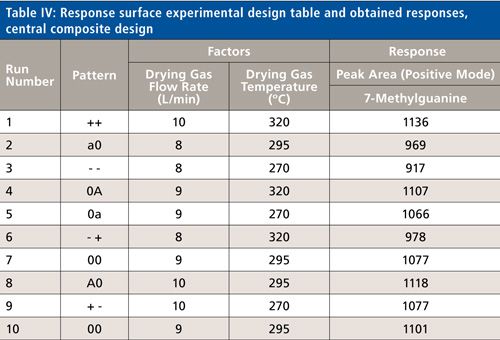
In this type of design, the most important factors found from screening are tested in more detail, at higher resolution. Those significant variables were tested using CCD (for positive ionization) and BBD (for negative ionization) design with narrower ranges for each parameter. The choice of the two different types of design were based on the number of significant factors, with the aim of the minimization of amount of experimental runs. An experimental matrix for both designs with narrower limits for significant parameters is presented in Table IV.

Results and Discussion
Screening of Significant Variables Using Fractional Factorial Design
In our study, two levels were chosen for each of the tested parameters, maximum (+1) and minimum (-1), which covered the operational and practical range. The center points at level 0 were also added to assess the linearity of the responses within the examined range and to evaluate system error. After incorporation of all information (factors, levels, and responses) into the statistical program, the design resolution was chosen: resolution IV. In practice, resolution denotes the degree of alias, which would be allowed in the study. Resolution IV means that main effects are not confounded with other main effects or two-factor interactions. However, two-factor interactions are confounded with other two-factor interactions. Afterwards, the DoE plan was generated with a list of experiments to be performed. Based on these experiments, each parameter’s effect was calculated and extrapolated to the entire response system. In our study, the generated design covered only 11 experimental runs with inclusion of three center points. Performance order was randomized. The drying gas flow, temperature, capillary voltage, and nebulizer pressure parameters were examined in ranges, which reflected the operational settings used in our laboratory. The change of the response, peak areas of both analytes, reflects the difference in the electrospray ionization, which results from various ion source factor settings.
The coefficients of the response function, their statistical significance and analysis of variance (ANOVA) for responses were evaluated at 95% confidence level by the method of least squares. Regression models (for both analytes) were found statistically significant at p < 0.05. The quality of the fit of the polynomial model equation was represented by the value of R2. The obtained values of R2 were 0.978 (positive ionization) and 0.993 (negative ionization). They indicated the reliability of the equation revealing that 97.8% and 99.3% of the variation could be ascribed to the independent variable. In addition, the lack-of-fit statistics for each model was determined. The lack-of-fit test shows the difference between the total error and “pure” error sum of squares. If the lack-of-fit is large, the model might not be appropriate for the data. The F-ratio determines whether the variation due to lack-of-fit is small enough to be accepted as a negligible portion of the pure error. The lack-of-fit analyses for our regression models did not reveal statistical significance, indicating that the models were appropriate in all cases.
The brief summary of screening statistics is presented in Figures 1–4. The half normal probability plot (Figure 1) shows the absolute value of the contrast (estimated factor effect) against the normal quantiles for the absolute value of normal distribution. Significant effects, which contribute the most of the variance to the response, are separated from the line toward the upper right and are marked in red. Figure 2 presents the list of main factors and interactions with their corresponding contrasts, t-ratios and p-values (significant factors are highlighted in black). A factor at p < 0.1 (90% confidence level) was considered statistically significant. Factors at p < 0.05 (95% confidence level) were marked with an asterisk. The contrasts present the degree of the impact onto response. Those that are large in magnitude value induced the greatest effect on the response. The sign for contrast (+ or -) indicates whether the settings of parameters should be maximized (+1) or minimized (-1) to achieve the best response. For the positive ionization mode, two of the four main parameters were considered important, namely temperature and flow rate of the drying gas. For the ionization in the negative mode, the most critical variables were gas temperature, gas flow rate, and nebulizer pressure.
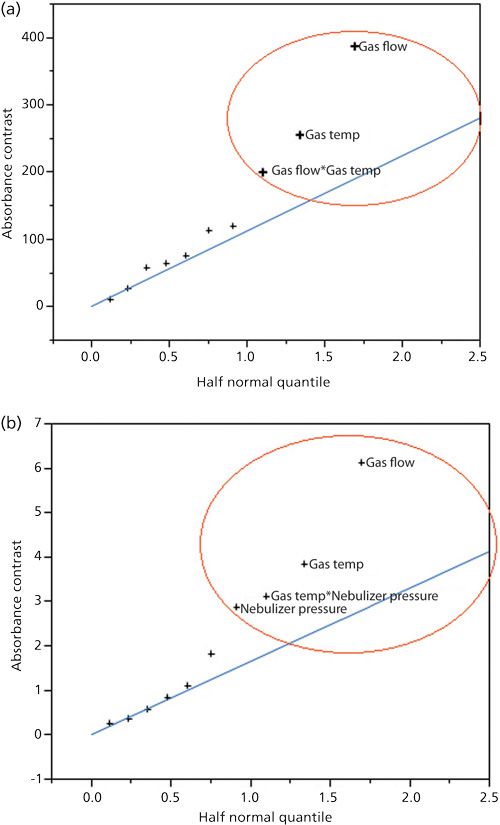
Figure 1: A half-normal quantile plot that describes the factors and interactions which were assessed as significant (marked as red circle). (a) Positive ionization, (b) negative ionization.
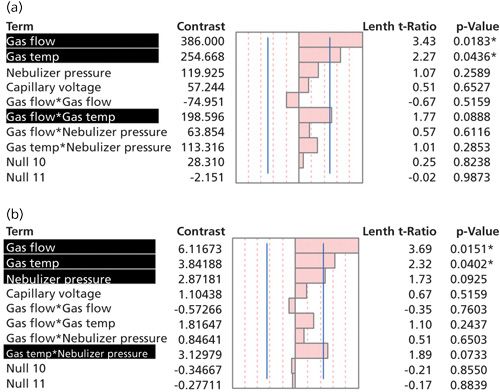
Figure 2: List of factors and interactions that were examined to provide contrasts. Those highlighted in black are significant within 90% confidence level and those additionally marked with an asterisk within 95% confidence. (a) Positive ionization, (b) negative ionization.
The identification of the most critical main factors for the ESI positive and negative ionization modes seem to be predictable. The ions are formed in the solution phase and afterwards are changed into gas phase before entering into mass spectrometer. Because of that, the parameters such as drying gas temperature and drying gas flow rate are crucial for the desolvation process of the electrosprayed droplets, the formation, and control of the size of these droplets. The nebulizer pressure determines nebulization process efficiency, which altogether with drying gas temperature and flow rate, play the leading role in the quality and quantity of the ions produced in the source. For the other variable, capillary voltage, which was applied to the heated capillary, only the partial effect was observed and the factor was not considered as significant for both ionization modes.
The gas flow rate was found to be the most significant main factor in terms of induced change to both studied responses. In addition, a few two-factor interactions were found significant, which would not be investigated in the OVAT procedure. For positive ionization, interaction between drying gas flow rate and its temperature was found important. For negative mode, two-factor interaction between gas temperature and nebulizer pressure was statistically significant.
Figure 3 presents a prediction profiler plot that visualizes how the levels of each factor affects the other, using standard least-squares analysis. Application of this plot allows the global response modeling, maximization and calculation of each factor coefficients that cause rise to the maximum response. The values marked in red, above the factor names, characterize the globally predicted optimal settings.
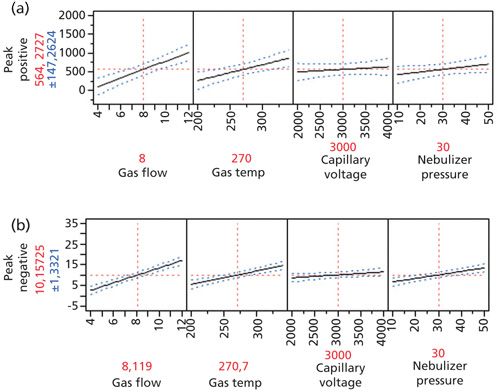
Figure 3: Screening design–prediction profiler that models the system and predicts the optimal combination of settings (shown in red above each factor). (a) Positive ionization, (b) negative ionization.
Optimization of Significant Variables Using Response Surface Methodology
The parameters, which were assessed as insignificant within the tested ranges, were kept constant at settings that were predicted in FFD to achieve the most optimal response (as seen in Figure 4). Thus, nebulizer pressure was set at 35 psi in the positive ionization mode while in both ionization modes the capillary voltage was set at 3000 V. Next, narrower ranges for statistically significant factors were set by limiting the values that were within 95.0% confidence interval-where the red horizontal dashed line is crossed by blue dashed line (see Figure 4). The typed parameters with shorter ranges and design matrix were already presented in Table IV. All experiments were carried out in randomized order with a standard solution of 0.05 µg/mL and 1 µg/mL for 7-methylguanine and glucuronic acid, respectively.
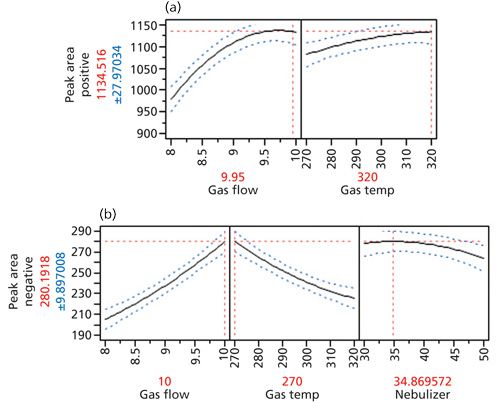
Figure 4: Response surface design–prediction profiler that models the system and predicts the optimal combination of settings (shown in red above each factor). (a) Positive ionization, (b) negative ionization.
Summarizing the statistics, an actual by predicted plot was generated to visualize the fitting of empirically obtained data to the data predicted by regression analysis. For both models the data are fitted very well, with R2 of 0.988 for CCD and 0.984 for BBD. In results of ANOVA, both models were considered significant (Prob > F 0.0006 for both) and the lack-of-fit test revealed that the obtained data were appropriate to the generated models (Prob > F 0.5789 for BBD and Prob > F 0.8309 for CCD). ANOVA results for CCD showed that of the two examined factors, drying gas flow rate and temperature, both appeared to be significant and the drying gas flow rate had the highest influence on the response. Moreover, the second order interaction of drying gas flow was also statistically important. For BBD, three of the tested factors (drying gas flow rate, gas temperature, and nebulizer pressure) were found significant as well as two-factor interaction between gas flow and gas temperature, which had the highest influence on the response, and quadratic interaction of nebulizer pressure and gas temperature. The prediction profiler was applied to achieve the combination of parameter settings to gain the best response (Figure 4). The most optimal combination is shown in red above each parameter.
Additionally, to visualize the level of each variable for maximum response, three-dimensional response surface plots were generated by plotting the response on the Z-axis against two parameters. The response surface plots for both responses with the most influential main variable, gas flow rate, are presented in Figure 5. For CCD, it could be seen that peak area of 7-methylguanine increases together with an increase of gas flow and simultaneous increase of gas temperature, which results from ESI operational principles. For BBD, it was found that the response obtained for glucuronic acid (peak area in negative ionization) increases with an increase of gas flow rate and decrease of gas temperature. In the function of gas flow rate and nebulizer pressure, the increase of response is observed when the gas flow rate is increased and the nebulizer pressure is decreased. The observations given above together with the most significant factors (gas flow and gas temperature) found to influence glucuronic acid peak area, are probably due to the fragility of the compound in the tested conditions. It should be noted that the optimal conditions predicted by the model in the screening design, match quite well with the results gained in response surface designs.
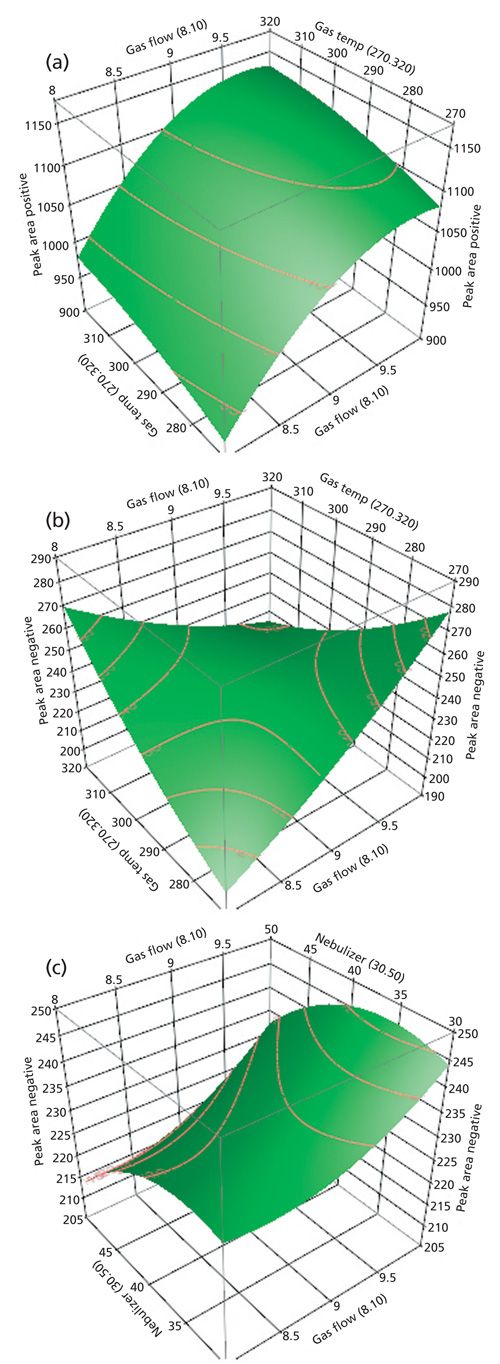
Figure 5: Response surface plots in function of main significant variable, drying gas flow rate. (a) Positive ionization, (b) negative ionization-in function with drying gas temperature, and (c) negative ionization-in function with nebulizer pressure.
Final optimal conditions for the maximum response of 7-methylguanine were as follows: drying gas temperature, 320 °C; drying gas flow rate, 10 L/min; capillary voltage, 3000 V; and nebulizer pressure, 30 psi. Final optimal conditions for glucuronic acid were as follows: drying gas temperature, 270 °C; drying gas flow rate, 10 L/min; capillary voltage, 3000 V; and nebulizer pressure, 35 psi. Those settings were applied in further metabolomics studies on selected metabolites in human urine samples. Exemplary MRM chromatograms for 18 standards of metabolites and a urine sample, obtained under the final defined conditions are presented in Figure 6.
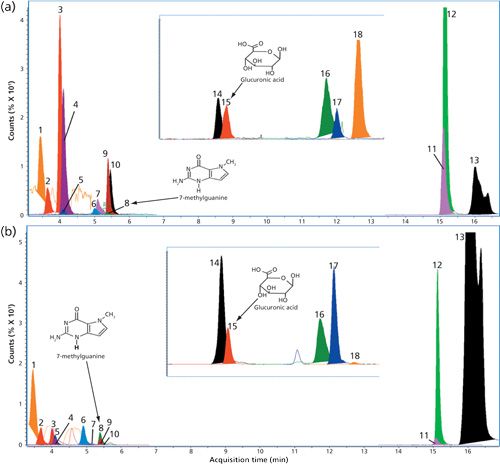
Figure 6: Exemplary MRM chromatograms for (a) standards solution and (b) urine sample obtained in positive and negative (main and inset figures, respectively) mode. Peaks: 1 = 1,7-dimethylxanthine, 2 = trimethyllysine, 3 = acetyllysine, 4 = citrulline, 5 = taurine, 6 = pseudouridine, 7 = N-acetylneuraminic acid, 8 = 7-methylguanine, 9 = xanthine, 10 = uridine, 11 = 2-furoylglycine, 12 = tryptophan, 13 = hippuric acid, 14 = gluconic acid, 15 = glucuronic acid, 16 = aconitic acid, 17 = 1-methyluric acid, 18 = 3,7 dimethyluric acid.
Conclusions
The DoE approach is favored for global optimization of complex systems characterized by multiple variables and settings. Optimization of such complex experimental domains using the OVAT approach might be ineffective and economically unjustified due to neglecting interactions between studied factors and the large number of experiments to be conducted.
A step-by-step optimization procedure utilized in the present article describes the systematic approach in method development with the aim to increase the potential of the ESI source. Comprehensive and planned experimental assessment allowed us to select the most significant variables and establish source settings to obtain maximized response, peak areas of two metabolites (7-methylguanine and glucuronic acid), and allowed further metabolomic studies of human urine. Afterward, the most optimal ESI source conditions were applied in a metabolomics study to quantify concentrations of 18 metabolites in human urine samples.
References
- M. Wilm, Mol. Cell Proteomics10(7), 1–8 (2011).
- R. Aebersold and M. Mann, Nature422(6928), 198–207 (2003).
- W. Struck, D. Siluk, A. Yumba-Mpanga, M. Markuszewski, R. Kaliszan, and M.J. Markuszewski, J. Chromatogr. A1283, 122–131 (2013).
- K. Macur, C. Temporini, G. Massolini, J. Grzenkowicz-Wydra, M. Obuchowski, and T. Baczek, Proteome Sci.8(60), 1–8 (2010).
- R. Bujak, R. GadzaÅa-Kopciuch, A. Nowaczyk, J. Raczak-Gutknecht, M. Kordalewska, W. Struck-Lewicka, M.J. Markuszewski, and B. Buszewski, Talanta146, 401–409 (2016).
- N. Kostic, Y. Dotsikas, A. Malenovic, B. J. Stojanovic, T. Rakic, D. Ivanovic, and M. Medenica, J. Mass Spectrom. 48(7), 875–884 (2013).
- D.L. Massart, B.G.M. Vandeginste, L.M.C. Buydens, S. de Jong, P.J. Lewi, and J. Smeyers-Verbeke, Handbook of Chemometrics and Qualimetrics Part A (Elsevier Science, Amsterdam, 1997), Chapter 21.
- B. Dejaegher and Y. Vander Heyden, J. Pharm. Biomed. Anal. 56(2), 141–158 (2011).
- O. Szerkus, J. Jacyna, A. Gibas, M. Sieczkowski, D. Siluk, M. Matuszewski, R. Kaliszan, and M.J. Markuszewski, Anal. Chim. Acta, submitted (2016).
Oliwia Szerkus, Arlette Yumba Mpanga, MichaÅ J. Markuszewski, Roman Kaliszan, and Danuta Siluk are with the Department of Biopharmaceutics and Pharmacodynamics, at the Medical University of Gdansk, in Gdansk, Poland. Direct correspondence to: dsiluk@gumed.edu.pl

High-Speed Laser MS for Precise, Prep-Free Environmental Particle Tracking
April 21st 2025Scientists at Oak Ridge National Laboratory have demonstrated that a fast, laser-based mass spectrometry method—LA-ICP-TOF-MS—can accurately detect and identify airborne environmental particles, including toxic metal particles like ruthenium, without the need for complex sample preparation. The work offers a breakthrough in rapid, high-resolution analysis of environmental pollutants.
The Fundamental Role of Advanced Hyphenated Techniques in Lithium-Ion Battery Research
December 4th 2024Spectroscopy spoke with Uwe Karst, a full professor at the University of Münster in the Institute of Inorganic and Analytical Chemistry, to discuss his research on hyphenated analytical techniques in battery research.
Mass Spectrometry for Forensic Analysis: An Interview with Glen Jackson
November 27th 2024As part of “The Future of Forensic Analysis” content series, Spectroscopy sat down with Glen P. Jackson of West Virginia University to talk about the historical development of mass spectrometry in forensic analysis.
Detecting Cancer Biomarkers in Canines: An Interview with Landulfo Silveira Jr.
November 5th 2024Spectroscopy sat down with Landulfo Silveira Jr. of Universidade Anhembi Morumbi-UAM and Center for Innovation, Technology and Education-CITÉ (São Paulo, Brazil) to talk about his team’s latest research using Raman spectroscopy to detect biomarkers of cancer in canine sera.