Porous Chitosan Composite Membrane Tandem Laser-Induced Breakdown Spectroscopy for Detection of Metal Elements in Liquid Samples
Laser-induced breakdown spectroscopy (LIBS) is currently one of the most popular techniques for direct element analysis of solid samples. However, when directly used for liquid sample analysis, there are disadvantages, including sample splashing, plasma quenching, and poor signal stability. These problems can be overcome through liquid-solid matrix conversion; at the same time, LIBS signal enhancement can be realized, and the sensitivity of detection of liquid samples can be improved. For this research, the authors used chitosan (CS) as a raw material, and introduced poly(vinyl alcohol) (PVA) and polyethyleneimine (PEI) to finally synthesize a new type of porous membrane material with better stability and more functional group content. The membrane was used as a liquid-solid conversion matrix material combined with LIBS technology to successfully achieve rapid separation and detection of Cu, Ag, Pb, and Cr, and the corresponding detection limits can reach 0.038, 0.069, 0.012, and 0.009 mg/L, respectively. This method further improves the sensitivity of the LIBS method. Combining it with membrane materials will replace inactive membranes and open up a new way for the rapid analysis of solution samples using LIBS technology.
With the rapid development of modern industry, industrial wastewater containing a large amount of heavy metal ions is continuously discharged into the environment, and bioaccumulation occurs in the food chain. Since most of the heavy metal ions are toxic, carcinogenic, non-biodegradable, nonthermally degradable, and stable, they will eventually cause long-term toxic and side effects in the environment that will pose a great threat to human health (1,2). Therefore, it is necessary to trace detect heavy metals in liquid to efficiently control water pollution.
Currently, laser-induced breakdown spectroscopy (LIBS) is one of the most popular elemental analysis technologies, and has been called one of the “future stars” in the field of elemental analysis (3). Because of its simple sample pre-processing, fast analysis speed, non-destructive analysis, micro-local analysis, multi-element simultaneous analysis, simple equipment configuration, and outstanding advantages that can realize online and remote monitoring, it has been widely used in biomedicine and food (4–6). However, because of the problems of liquid sputtering and plasma quenching in the process of liquid detection with LIBS technology, it is difficult to assay the elements in liquid samples directly. Membrane separation is an interesting pretreatment method suitable for LIBS analysis. Various materials, such as wood (7), ion-exchange membranes (8), and modified plasticized polyvinyl chloride (PVC) membranes (9) were used for liquid-solid matrix conversion of solution samples to facilitate direct analysis using LIBS.
Therefore, we propose a chitosan-based membrane separation method combined with LIBS technology to realize the detection of liquid samples. In this research, the choice of the solid phase matrix and the existence of the matrix are very important. Chitosan (CS) is a green and environmentally friendly material. Because of its abundant reserves and rich -NH2 and -OH binding sites, it has always attracted attention and is an ideal material for removing pollutants in wastewater (10).
At present, CS film has been widely used in biomedicine, drug delivery, hydrogels, water treatment, food packaging, and other fields due to its excellent hydrophilicity, high chemical reactivity, and availability (10). However, pure CS film has limited applications in complex environments, due to its weak mechanical strength and poor chemical stability. In order to overcome these limitations, CS is usually used with other polymers; in this regard, poly(vinyl alcohol) (PVA) is one of the most effective and compatible polymers. The polyelectrolyte material prepared by cross-linking CS and PVA by Gil and associates has shown good thermal oxidation (11). However, during the cross-linking process of CS and PVA, some -NH2 will be consumed to reduce the active sites. To solve this problem, Nadia and coauthors used polyethyleneimine (PEI) to modify the CS-PVA film, and successively prepared porous CS composite membranes through different methods (12,13). The CS composite membrane they prepared increased the active sites of the membrane, and increased the removal rate of Cu, Ni, and Cd by more than 40%. At the same time, due to the porous structure of the membrane, there are abundant reactive groups on its internal pores, so the adsorption is not limited to the surface of the adsorbent.
In this work, we used silica gel as a porogen, and used the characteristics of silica gel to dissolve in alkali but not acid, while CS is soluble in acid and insoluble in alkali; we synthesized a porous CS composite membrane. Subsequently, we used the porous CS composite membrane as the solid phase matrix, combined with the liquid-solid matrix conversion method, to convert the target elements Ag, Cu, Cr, and Pb from the solution into the porous membrane, and directly analyzed this membrane with the LIBS technology. Under the best instrument conditions, the analysis concentration of the target element was established.
Experiment
Reagents and Materials
The reagents used in the experiment are all analytical reagents. The target element stock solution was prepared by dissolving the corresponding analytically pure nitrate (1000 mg/L, AgNO3, Cr[NO3]3·9H2O, PbNO3, and Cu[NO3)2·3H2O) in ultrapure water (18.25 MΩ·cm). In order to avoid decomposition in light, all the target element solutions were stored in a dark environment for later use. The standard solution 1~100 mg/L was prepared by diluting the corresponding stock solution. The pH value of the solution was adjusted with 1 mol/L HNO3 and 1 mol/L NH3·H2O solutions.
Chitosan (deacetylation degree ≥ 95%, viscosity 100–200 mPa) was purchased from Shanghai Aladdin Biochemical Technology Co., Ltd. The chitosan solution was prepared by dissolving chitosan powder in acetic acid aqueous solution (2 wt%). After the chitosan powder fully dissolved, the solution was filtered and defoamed by leaving it still for at least 12 h at room temperature. The silica gel (mSiO2·nH2O, p300–p400) was purchased from Shanghai Aladdin Biochemical Technology Co., Ltd. Poly(vinyl alcohol) (PVA, p160) was purchased from Shanghai Chenqi Chemical Technology Co., Ltd.
Preparation and Characterization of Porous CS Composite Membrane
In this experiment, the CS composite membrane was synthesized according to the method published by various authors (12,14). Then, 5 g PVA powder was dissolved in 50 mL distilled water and stirred at 70 oC for 24 h, then the 10 wt% homogeneous solution A was obtained. Next, 5 g PEI powder was dissolved in 50 mL distilled water to obtain 10 wt% homogeneous solution B. The obtained homogeneous solution A, B, and 1 wt% CS-acetic acid homogeneous solution were mixed, and then stirred for 2 h. The final preparation membrane solution was then prepared. Silica gel was added into the preparation solution and stirred vigorously to make it evenly dispersed. Then, the solution was poured into a 3×3 cm glass petri dish and placed in an oven at 60 °C to evaporate the solvent. The dried membrane was immersed in a 10 wt% NaOH aqueous solution and stored at 80 °C for 2 h to dissolve the silica particles and form a porous membrane. Finally, the porous membrane was rinsed with distilled water to remove the remaining NaOH, and dried for later use.
Characterization of the Membrane
A Vetex70 spectrometer (Bruker Corporation) was employed to collect the Fourier-transform infrared (FT-IR) spectra, in KBr particles at room temperature over the range of 500–4000 cm−1. The morphologies of the obtained nanocomposites were investigated using an Hitachi S-4800 field emission scanning electron microscope (SEM) equipped with an energy-dispersive X-ray analysis (EDAX) detector.
LIBS Equipment and Analyzing Procedure
The LIBS-Tracer desktop laser-induced breakdown spectrometer was used for sample analysis, and was provided by Chengdu Ailiben Technology Co., Ltd. The instrument parameters were as follows: portable desktop instrument: 477 × 370 × 462 mm, 21 kg; laser wavelength: 1064 nm, wavelength range: full spectrum 185–850 nm (segment optional); resolution: 0.1 nm; pulse energy: 100 mJ; ablation diameter: 50 μm; power supply: 220/24 V. The diameter of the ablation point is approximately 0.2 mm. For the LIBS analysis, the sample was placed on an automated XY-axis panning table to ensure a new spot on the sample surface for each laser ablation event. Each analysis was performed by accumulating the signal from 100 ablation events. To create a standard curve, 10 replicate experiments were performed for each concentration of sample.
Sample Pretreatment Procedure
First, 100 μL of the solution containing the target element was added to a 1 mL centrifuge tube, and the pH of the solution was adjusted to 5–6 with 1 mol/L HNO3 and 1 mol/L NH3·H2O solution. Then, 100 μL of the target element was transferred from the aqueous phase to the surface of the porous CS composite membrane with a pipette. After drying, a circle was formed with a diameter of 7.30 mm on the membrane. The analytical zone was located within the circle. The CS film can be directly analyzed by LIBS. The blank sample was the same volume of ultrapure water instead of the target element solution, and the same drying treatment was used to detect and analyze the LIBS.
Results and Discussion
Characterization of Porous CS Composite Membrane
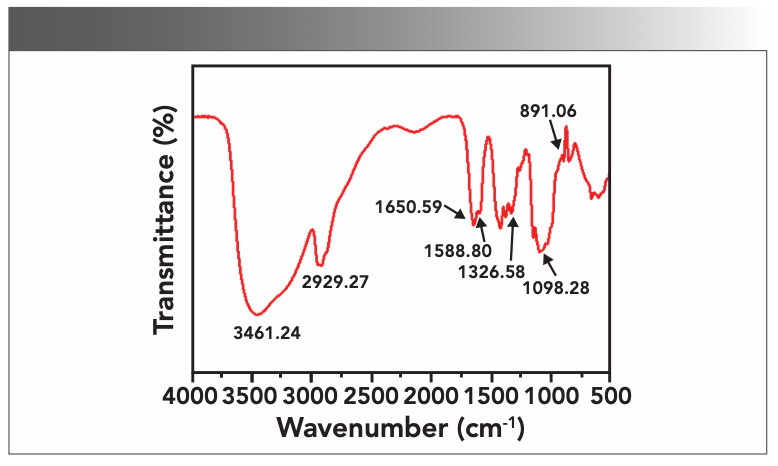
The functional groups of the synthesized porous CS composite membrane were characterized by FT-IR, as shown in Figure 1. The peaks around 891.06 cm-1 and 1139.72 cm-1 were the stretching vibration peaks of the glycosidic bond unique to CS (15,16). The absorption peak at 1650.59 cm-1 characterizes the existence of C=0 of PVA and CS. The absorption peaks at 1588.80 cm-1 and 1326.58 cm-1 were the deformation vibrations of NH (amide II) and -CH3 (amide III) respectively. 2929.27 cm-1 was the unique stretching vibration peak of the CH bond in PVP, and 3461.24 cm-1 was infrared absorption peaks of OH in CS and PVP and NH in CS and PEI. The experimental results showed that the porous CS composite membrane was successfully synthesized. These two polar functional groups facilitate the interaction between the porous CS composite membrane and trace metals.
FIGURE 1: FT-IR image of porous CS composite membrane.
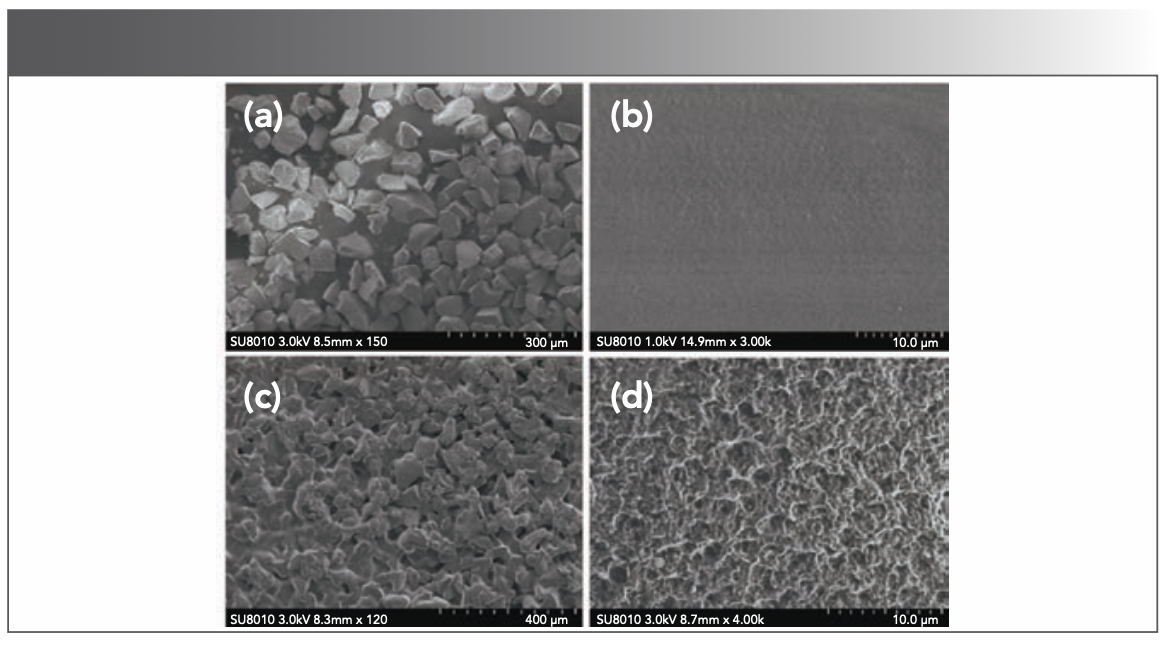
The surface structure of the porous CS composite membrane was characterized by SEM, as shown in Figure 2. Figure 2a was an electron micrograph of the silica gel porogen used in the experiment. It is obvious from the figure that there were uneven particles with a particle size of 37–48 μm. Figure 2b is made without silica gel CS composite membrane; it can be seen that the surface of the membrane is dense and smooth, which is not conducive to the storage of liquid solutions and the adsorption of target elements. Figure 2c was a CS composite membrane containing silica gel particles. The surface of the membrane was rough due to the presence of silica particles. Figure 2d showed the resultant membrane after immersing a CS composite membrane containing silica gel in a 10 wt% NaOH aqueous solution and storing it at 80 °C for 2 h. Compared with the CS composite membrane made without silica gel (Figure 2b), the membrane has a rich porous structure and the pore structure is uniform, indicating that the silica gel was evenly distributed in the membrane solution. The porous structure of the membrane was conducive to storing more target solutions, and, at the same time, it can provide more active sites and improve the adsorption efficiency.
FIGURE 2: SEM image of silica gel and CS composite film (a) silica gel particles, (b) CS composite film prepared without silica gel particles, (c) CS composite film containing silica gel particles, (d) orous CS composite film.
Study on the Adsorption of Porous CS Composite Membrane
In order to further understand the adsorption effect of the prepared porous CS composite membrane on the target element, LIBS and energy-dispersive spectroscopy (EDS) X-ray analysis was performed on both the blank membrane and the membrane loaded with the target element. The results were shown in Figures 3 and 4.
FIGURE 3: LIBS diagram of the sample (laser energy: 100 mJ, delay time: 1.0 μs, metal ion concentration: 100 mg/L).
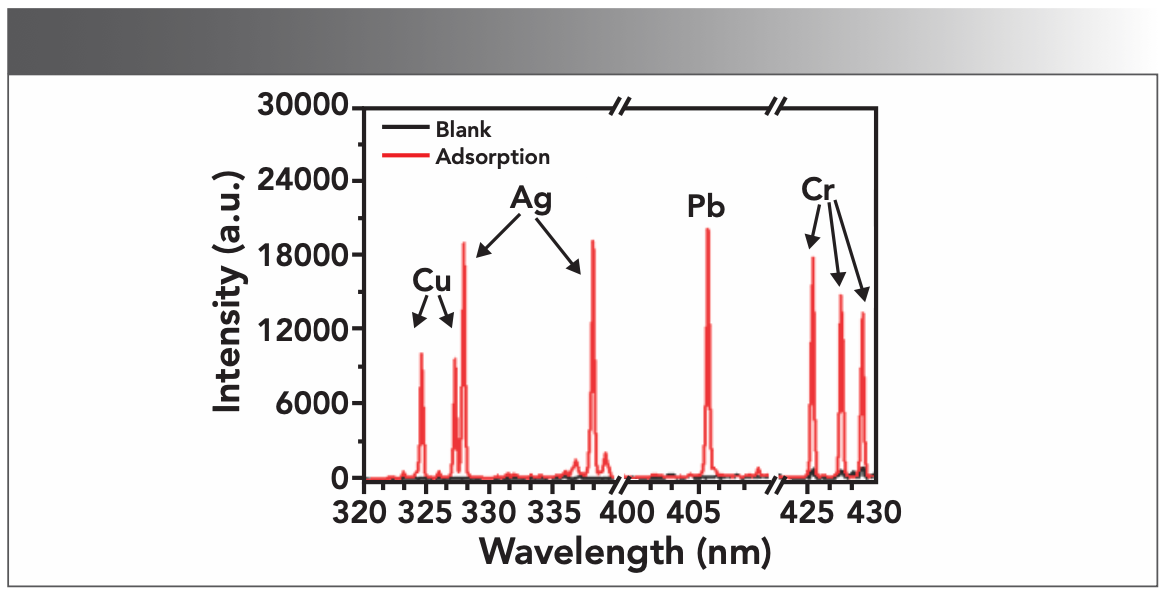
FIGURE 4: EDS images of porous CS composite film before and after loading metal: (a) blank film, (b) film after loading metal ions.
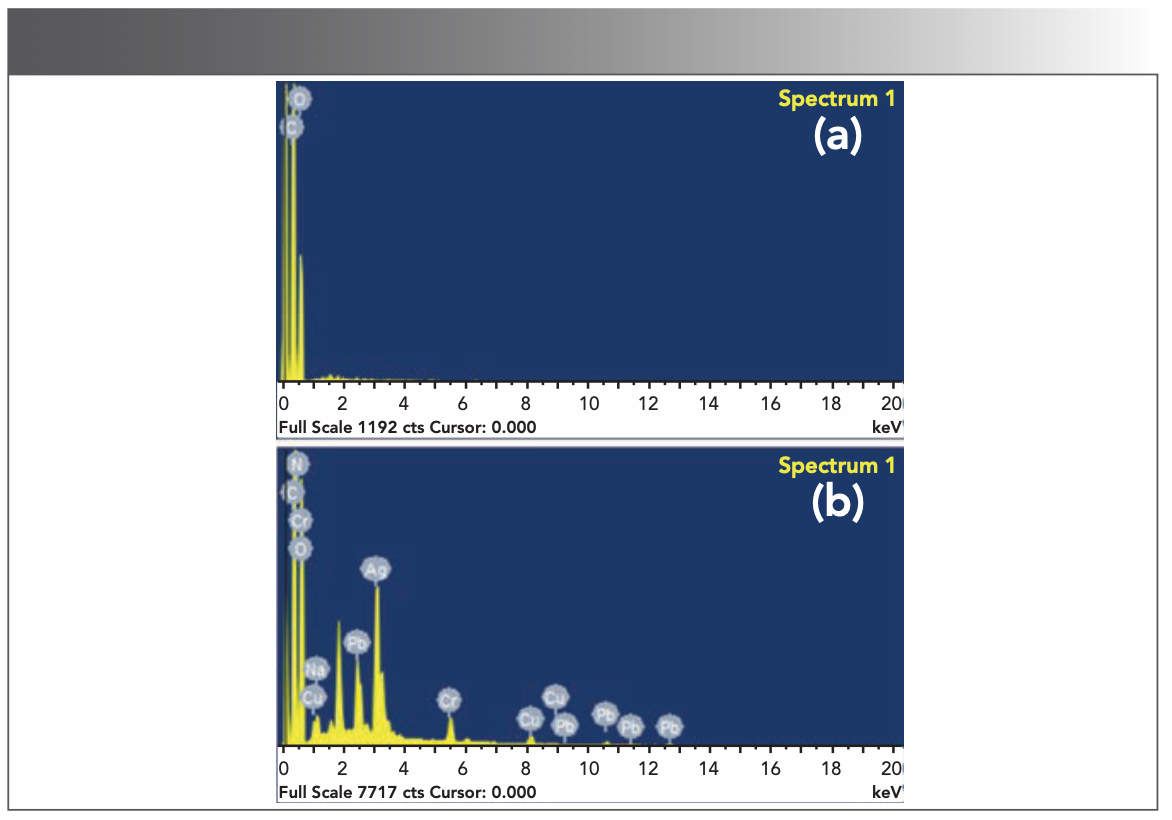
In Figure 3, comparing the LIBS diagram (black line) of the blank sample and the LIBS diagram (red line) of the sample to be tested, it can be clearly seen that the synthesized CS composite film had no interference to the target element that was analyzed. This can be explained from Figure 4a. The blank CS composite film contains only C, H, O, and N elements, so there was no matrix interference. The LIBS analysis of the metal-loaded porous CS composite film showed that the characteristic spectral lines of the target elements Cu, Ag, Pb and Cr were all excited. These spectral lines were Cu(I) 324.754 nm, Cu(I) 327.396 nm, Ag(I) 328.068 nm, Ag(I) 338.288 nm, Cr(I) 425.433 nm, Cr(I) 427.481 nm, and Cr(I) 428.973 nm, respectively. The same results were obtained in the EDS analysis (Figure 4b), which proved that the prepared porous CS composite film has a good adsorption effect on trace metal elements, and can effectively solve the problems of droplet sputtering in the LIBS analysis of liquid samples. In the follow-up research, we used these spectral lines as analysis lines for quantitative calculations.
Optimization of Delay Time During LIBS Analysis
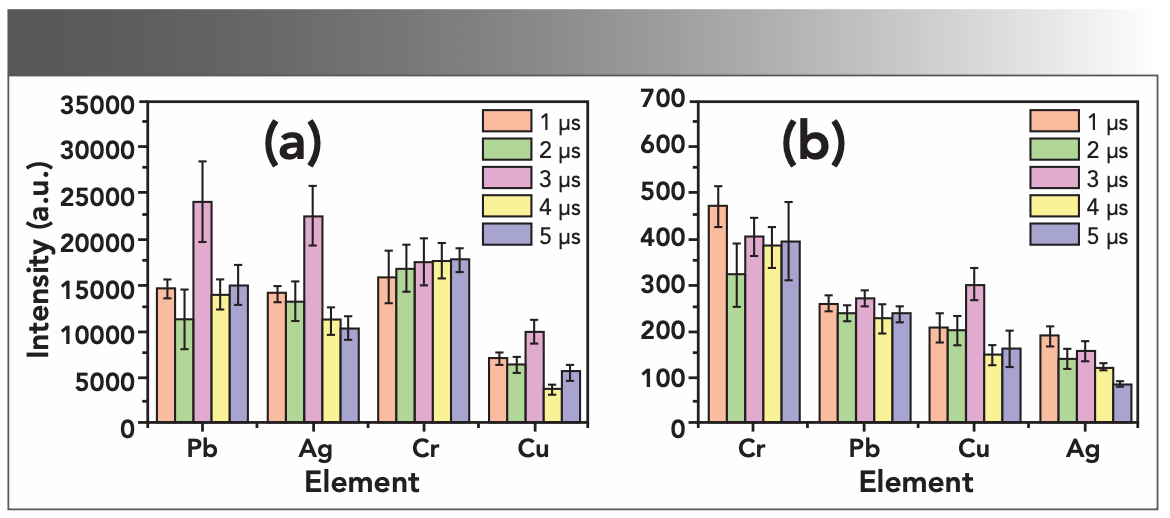
LIBS technology is based on time-resolved atomic emission spectroscopy technology. In order to avoid the interference of continuous spectrum and obtain a better LIBS signal value, it is generally necessary to select a suitable delay time in the research. Figure 5 shows the changes of LIBS signal strength and signal-to-noise ratio (S/N) under different delay times. In the S/N calculation, the noise was defined as the standard deviation of the background value in the range of 2 nm adjacent to the emission line peak, and the signal was the peak height. It can be seen from Figure 5a that the signal strength of Cr does not change much with the delay time, while the signal strengths of Pb, Ag, and Cu were the strongest at 3 μs. In Figure 5b, the S/N of Cr decreases first with the increase of the delay time, and remains basically unchanged after 3 μs. The change trend of Ag and Pb S/N with delay time is not obvious, and the S/N of Cu is the maximum at 3 μs. Comprehensively, 3 μs was selected as the best delay time.
FIGURE 5: Optimization of delay time: (a) the influence of delay time on LIBS signal strength, and (b) the influence of delay time on SNR.
Methods Verification
Quantitative Analysis and Detection Limit
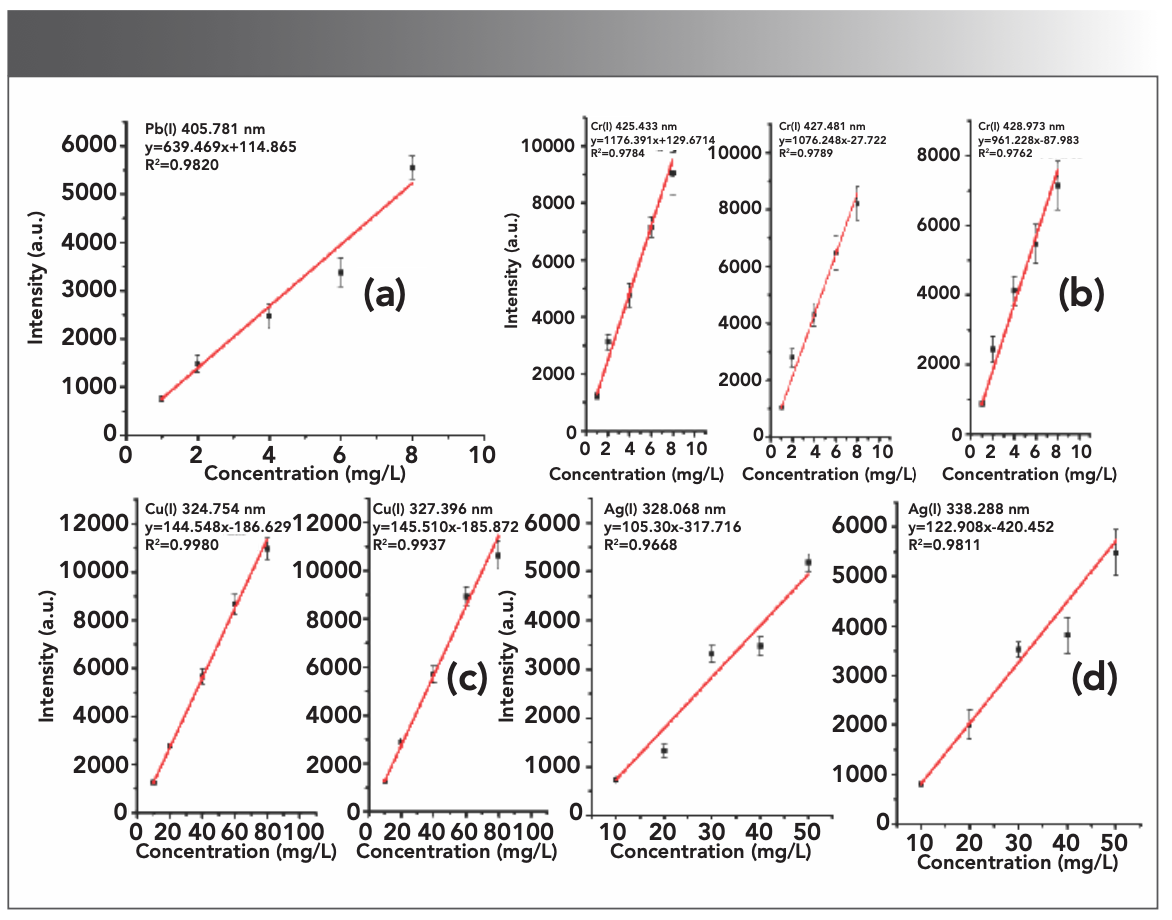
Through the calibration curve method, within the concentration of 0–100 mg/L, the relationship between the signal and the concentration of metal ions in the water environment was analyzed by LIBS, and the quantitative curves of Ag, Cr, Cu, and Pb were established. Each point in the calibration curve corresponds to the average of ten standard samples, and the error bars reflect the standard deviation of every ten measured values. The established standard curve was shown in Figure 6. In the concentration range of 0~100 mg/L, the target element under study has a good linear relationship (R2 > 0.90), and the curve can be described as y = ax + b, where y is the intensity of the emission spectrum, and x is the concentration of the target element in the solution sample.
FIGURE 6: LIBS quantitative curves of target elements at different emission wavelengths (a) Pb, (b) Cr, (c) Cu, and (d) Ag.
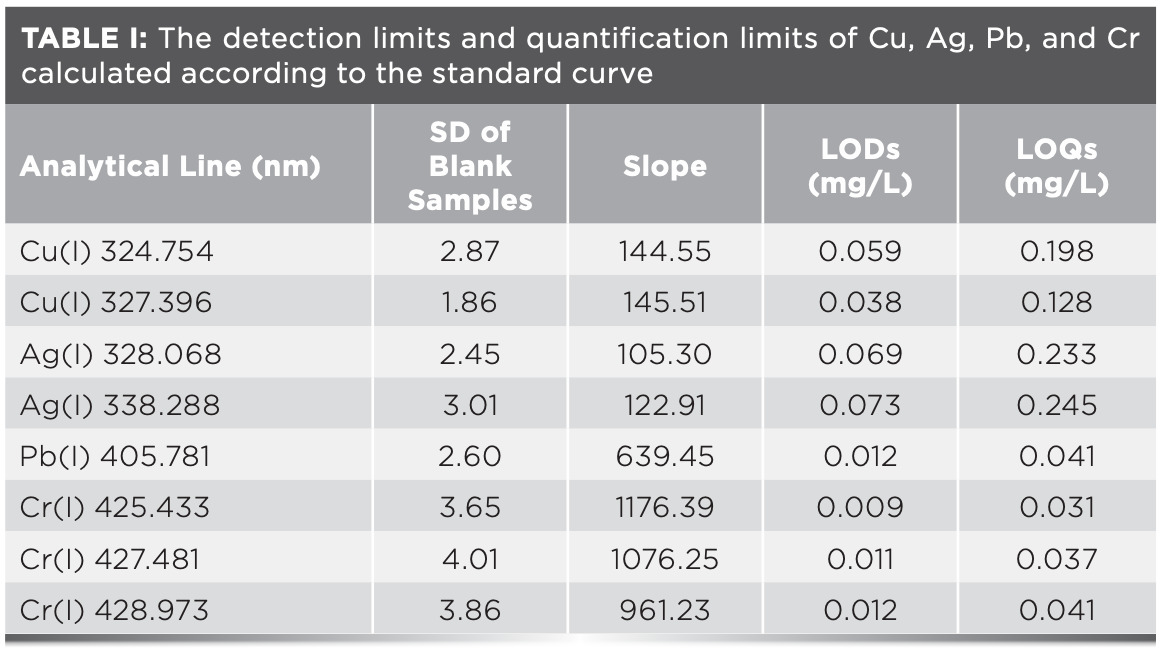
According to the definition of the International Union of Pure and Applied Chemistry (IUPAC), the limits of detection (LODs) and limits of quantification (LOQs) of target elements are calculated (17,18):
LOD = 3σB/s, LOQ=10σB/s [1]
σB was the standard deviation of the intensity of the target element in 11 blank sample analyses at the selected quantitative wavelength, and s was the slope of the established calibration curve. The experimental results were shown in Table I.
Methods Accuracy and Reproducibility
Considering the feasibility of the proposed method in practical application, the accuracy and reproducibility of the proposed method were evaluated by analyzing actual samples, including environmental spiked samples and standard reagents. The environmental samples were obtained from an artificial lake (Yulan Lake, Northwest University). The spiked concentrations of samples were 5, 7, and 9 mg/L, respectively. All parallel samples (n = 5) were analyzed under the optimal conditions, and the results are listed in Table II. The results show that the mean recoveries of the actual samples were in the range of 85.11%~109.45%, and the relative standard deviations (RSDs) were lower than 10.94%, which is satisfactory in terms of accuracy and repeatability for LIBS analysis of liquids.
Conclusion
Using the opposite solubility of silica gel and CS, a porous CS composite membrane was synthesized and applied to the analysis of heavy metal elements in liquid samples by LIBS. In the study, the porous CS composite membrane was characterized by FT-IR and SEM, and the results showed that the porous CS composite membrane was rich in N and O binding sites and porous structure, which was helpful for storing more target solutions. At the same time, the LIBS spectrum and EDS analysis results further confirmed that the synthesized porous film has a good adsorption effect on Ag, Cu, Cr, and Pb. Compared with the direct analysis of liquid samples by LIBS technology, the method proposed in this research avoids the problems of liquid sample sputtering and plasma quenching, and the detection limit of the method is further improved. At the same time, the raw materials of the synthesized porous CS composite membrane are easy to obtain, and the entire sample pretreatment process is simple. This provides a new idea for LIBS technology to analyze liquid samples. The membrane material is expected to be widely used.
Ethics Declarations
Ethics Approval
This article does not contain any studies with human participants or animals performed by any of the authors.
Informed Consent
Not applicable.
Conflict of Interest
All authors declare that there are no conflicts of interest.
References
(1) Bera, A.; Trivedi, J. S.; Kumar, S. B.; Chandel, A. K. S.; Haldar, S.; Jewrajka, S. K. Anti-organic Fouling and Anti-biofouling Poly(piperazineamide) Thin Film Nanocomposite Membranes for Low Pressure Removal of Heavy Metal Ions. J. Hazard Mater. 2018, 343, 86–97. DOI: 10.1016/j.jhazmat.2017.09.016
(2) Zhao, Y.; Tian, G.; Duan, X.; Liang, X.; Meng, J.; Liang, J. Environmental Applications of Diatomite Minerals in Removing Heavy Metals from Water. Ind. Eng. Chem. Res. 2019, 58, 11638–11652. DOI: 10.1021/acs.iecr.9b01941
(3) Winefordner, J. D.; Gornushkin, I. B.; Correll, T.; Gibb, E.; Smith, B. W.; Omenetto, N. Comparing Several Atomic Spectrometric Methods to the Super Stars: Special Emphasis on Laser Induced Breakdown Spectrometry, LIBS, a Future Super Star. J. Anal. At. Spectrom. 2004, 19 (9), 1061–1083. DOI: 10.1039/B400355C
(4) Wang, W.; Liu, Y.; Chu, Y.; Xiao, S.; Nie, J.; Zhang, J.; Qi, Q.; Guo, L. Stable Sensing Platform for Diagnosing Electrolyte Disturbance Using Laser-Induced Breakdown Spectroscopy. Biomed. Opt. Express 2022, 13 (12), 6778–6790. DOI: 10.1364/BOE.477565
(5) Samek, O.; Beddows, D. C. S.; Telle, H. H.; Kaiser, J.; Liška, M.; Cáceres, J. O.; Gonzáles Ureña, A. Quantitative Laser-Induced Breakdown Spectroscopy Analysis of Calcified Tissue Samples. Spectrochim. Acta, Part B 2001, 56 (6), 865–875. DOI: 10.1016/S0584-8547(01)00198-7
(6) Sezer, B.; Bjelak, A.; Velioglu, H. M.; Boyaci, I. H. Protein Based Evaluation of Meat Species by Using Laser Induced Breakdown Spectroscopy. Meat Sci. 2021, 172, 108361. DOI: 10.1016/j.meatsci.2020.108361
(7) Chen, Z.; Godwal, Y.; Tsui, Y. Y.; Fedosejevs, R. Sensitive Detection of Metals in Water Using Laser-Induced Breakdown Spectroscopy on Wood Sample Substrates. Appl. Opt. 2010, 49 (13), C87–C94. DOI: 10.1364/AO.49.000C87
(8) Dockery, C. R.; Pender, J. E.; Goode, S. R. Speciation of Chromium via Laser-Induced Breakdown Spectroscopy of Ion Exchange Polymer Membranes. Appl. Spectrosc. 2005, 59 (2), 252–257.
(9) Santos, K. M.; Cortez, J.; Raimundo, I. M.; Pasquini, C.; Boa Morte, E. S.; Korn, M. G. A. An Assessment of the Applicability of the Use of a Plasticised PVC Membrane Containing Pyrochatecol Violet Complexing Reagent for the Determination of Cu2+ Ions in Aqueous Solutions by LIBS. Microchem. J. 2013, 110, 435–438. DOI: 10.1016/j.microc.2013.05.013
(10) Brião, G. d. V.; De Andrade, J. R.; Da Silva, M. G. C.; Vieira, M. G. A. Removal of Toxic Metals from Water Using Chitosan-Based Magnetic Adsorbents. A Review. Environ. Chem. Lett. 2020, 18 (4), 1145–1168. DOI: 10.1007/s10311-020-01003-y
(11) Gil-Castell, O.; Teruel-Juanes, R.; Arenga, F.; Salaberria, A. M.; Baschetti, M. G.; Labidi, J.; Badia, J. D.; Ribes-Greus, A. Crosslinked Chitosan/poly(vinyl alcohol)-Based Polyelectrolytes for Proton Exchange Membranes. React. Funct. Polym. 2019, 142, 213–222. DOI: 10.1016/j.reactfunctpolym.2019.06.003
(12) Sahebjamee, N.; Soltanieh, M.; Mousavi, S. M.; Heydarinasab, A. Removal of Cu2+, Cd2+ and Ni2+ Ions from Aqueous Solution Using a Novel Chitosan/polyvinyl Alcohol Adsorptive Membrane. Carbohydr. Polym. 2019, 210, 264–273. DOI: 10.1016/j.carbpol.2019.01.074
(13) Sahebjamee, N.; Soltanieh, M.; Mousavi, S. M.; Heydarinasab, A. Preparation and Characterization of Porous Chitosan–Based Membrane with Enhanced Copper Ion Adsorption Performance. React. Funct. Polym. 2020, 154, 104681. DOI: 10.1016/j.reactfunctpolym.2020.104681
(14) Zeng, X.; Ruckenstein, E. Control of Pore Sizes in Macroporous Chitosan and Chitin Membranes. Ind. Eng. Chem. Res. 1996, 35 (11), 4169–4175. DOI: 10.1021/ie960270j
(15) Kong, Q.; Ji, Y.; Ma, H.; Song, Y.; He, B.; Li, J. A Novel Route for the Removal of Cu(II) and Ni(II) Ions via Homogeneous Adsorption by Chitosan Solution. J. Cleaner Prod. 2018, 192, 801–808. DOI: 10.1016/j.jclepro.2018.04.271
(16) Wang, X. H.; Wang, C. Y. Chitosan-Poly(vinyl alcohol)/attapulgite Nanocomposites for Copper(II) Ions Removal: pH Dependence and Adsorption Mechanisms. Colloids Surf. A 2016, 500, 186–194. DOI: 10.1016/j.colsurfa.2016.04.034
(17) Analytical Methods Committee. Recommendations for the Definition, Estimation and Use of the Detection Limit. Analyst 1987, 112 (2), 199–204.
(18) Long, G. L.; Winefordner, J. D. Limit of Detection: A Closer Look at the IUPAC Definition. Anal. Chem. 1983, 55 (7), 712A–724A. DOI: 10.1021/ac00258a724
Cheng Qian is with the Shaanxi Key Laboratory of Earth Surface System and Environmental Carrying Capacity at the College of Urban and Environmental Sciences at Northwest University, in Xi’an, China. Bing Zhang, Cuilan Qu, Rui Wang, Yuanguo Shi, Minxia Lin, and Weibiao Zhang are with the Shenzhen Agricultural Products Quality and Safety Inspection and Testing Center, in Shenzhen, China. Zhang and Qu have contributed equally to this article. Direct correspondence to: qiancheng@nwu.edu.cn ●
Laser Ablation Molecular Isotopic Spectrometry: A New Dimension of LIBS
July 5th 2012Part of a new podcast series presented in collaboration with the Federation of Analytical Chemistry and Spectroscopy Societies (FACSS), in connection with SciX 2012 — the Great Scientific Exchange, the North American conference (39th Annual) of FACSS.