Raman Analysis of Ethylene Vinyl Acetate Copolymers–Using 2D-COS for Identifying Structural Changes
Spectroscopy
Raman 2D-COS spectral data provide information on conformational changes of polymers. Here, Raman spectra of ethylene vinyl acetate and vinyl acetate copolymer are measured and interpreted, enabling a description of morphological changes related to the vinyl acetate group.
Raman spectra of five reference samples of ethylene vinyl acetate (EVA) with vinyl acetate (VA) copolymer composition between 14 and 40% were measured. After normalizing the spectra to the >CH2 deformation near 1450 cm-1, the spectra can be compared and band assignments made, enabling a description of morphological changes resulting from the introduction of the vinyl acetate group. The spectra were then analyzed by two-dimensional correlation spectroscopy (2D-COS). The 2D-COS enabled an easy way to use the spectral data to derive information on conformational changes that bypasses band-fitting, which can be non-unique.
Polymers are experiencing ever-expanding uses in many applications. The successful use of polymers depends on their chemical and physical properties which, in turn, depend on the molecular weight, chemical composition, and morphology. When a polymer is used to dissolve a small molecule (for instance, for drug delivery or for pigmentation), it needs to be noncrystalline. When it is used for a structural application, it needs to be tough, to be capable of resisting fracture when stressed. For those who are new to the characterization of polymers, it is useful to explain that
morphology
refers to the special arrangement of amorphous versus crystalline composition, orientation of the molecular chains, and the state of amorphous chains in direct vicinity of the crystalline phase, all of which affect the physical properties.
In my journey into acquiring expertise in two-dimensional correlation spectroscopy (2D-COS), I have been looking for a system where I can connect what I know about the spectra with the changes that 2D-COS is showing. Some of the work that I have published in this column on the spectra of polyethylene terephthalate was designed with this in mind. However, this system is quite complicated, so I have been looking for a system where we can more easily use the combination of Raman spectroscopy and 2D-COS to reveal useful information about chemical or conformational changes. After I collected spectra of five reference samples of poly(ethylene vinyl acetate) (EVA), I dropped them into 2D-COS and asked my mentor, Isao Noda, if this would be a convenient approach to try. His enthusiastic response was my go-ahead signal. For me, this is exciting, because I am able to rigorously follow the physical and chemical changes in a material. The focus is entirely different from my usual focus on microanalysis. Raman spectroscopy has not been used as much for chemical characterization as infrared (IR) and nuclear magnetic resonance (NMR) spectroscopy, for a variety of reasons. Its application requires detailed knowledge of spectral interpretation, which is not being taught as it was 50 years ago. For me, this has provided an incentive to learn more about spectral interpretation, especially of organic compounds.
Background
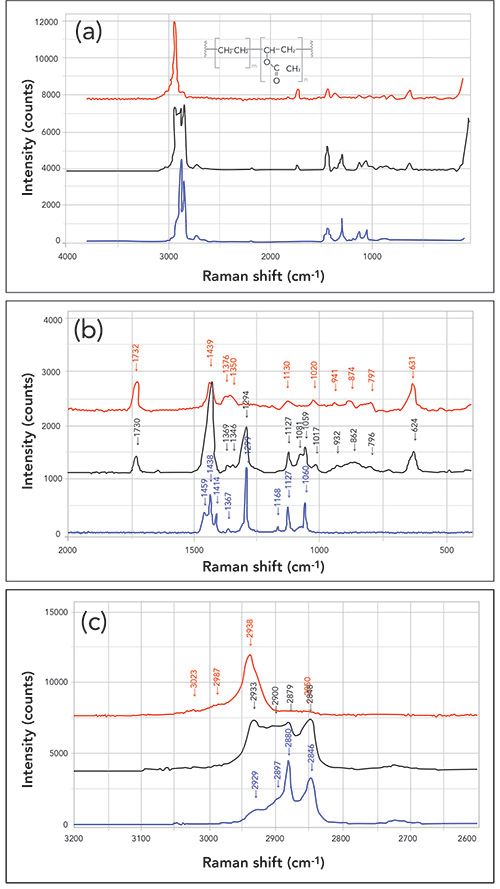
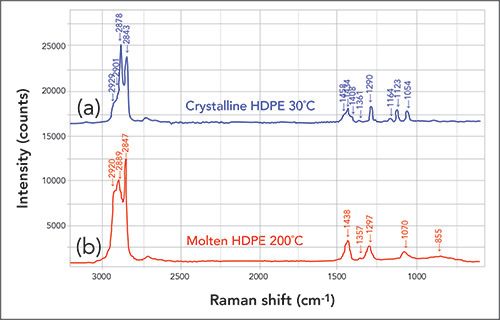
Ethylene vinyl acetate is a copolymer of ethylene and vinyl acetate with the latter usually present at concentrations less than 50%. Whereas polyethylene (PE) can be quite well-ordered (chains parallel with long-range crystalline packing order), the introduction of vinyl acetate interrupts that order. The spectrum of polyethylene has been extensively interpreted (1), so the changes introduced by the presence of vinyl acetate are amenable to interpretation. The first figure shows the Raman spectrum of poly(vinyl acetate) (PVA, top), EVA, 40% vinyl acetate (middle), and PE (bottom). Before examining the spectra, one might expect that the spectrum of EVA will be a superposition of PVA and polyethylene, but, in fact, that is an extreme oversimplification that becomes clearer by examining the spectra of solid and molten high density polyethylene (HDPE) in Figure 2. The top of the figure shows the spectrum of a pellet of polyethylene (2) at room temperature where it is solid versus the bottom spectrum of the same material, recorded at 200 â°C where it has melted. In the case of EVA, as the concentration of the VA is increased, the crystalline order of the polyethylene content is interrupted. Disorder in polyethylene has well-known effects on the spectrum, which can be seen in Figure 2. In molten polyethylene, there are three broad bands in the fingerprint region-the C-C single bond at about 1070 cm-1, the backbone twist near 1300 cm-1, and the >CH2 deformations near 1440 cm-1. If polyethylene has a limited number of side branches, when solidified, the chains will stretch out with translational alignment; there are two methylene units in the repeat segment of the chain, and two chains in the unit cell. Using this information, it becomes possible to assign molecular motion to all the peaks in the spectrum of the solid (1,3). With this information in mind, when we examine the spectra of the various compositions of EVA, we note that bands of well-ordered, crystalline polyethylene are decreasing as the VA composition is increasing, and VA bands are increasing with VA concentrations. What the 2D-COS will tell us is what is happening simultaneously (in the synchronous plots), and what is not happening simultaneously (in the asynchronous plots). What is even more important is 2D-COS will tell us the order in which the different bands are changing. Before thinking this through thoroughly, it did not occur to me that the conformational changes would not be simultaneous. This has important implications for the study of temperature dependence and extrusion in polymers.
Band Assignments of Polyethylene
In this section, I enumerate the bands that I am using to follow the influence of VA on the polyethylene order. Figure 2 shows the Raman spectrum of a pellet measured just above room temperature (30 â°C), and then at 200 â°C, which is well above the range of melting temperatures (120–180 â°C). In the liquid phase, there are three broad and prominent bands in the fingerprint region-the C-C stretch near 1070 cm-1, the backbone twist near 1300 cm-1, and the >CH2 deformations near 1440 cm-1. Polyethylene is an unusual polymer in that it can exist in a highly crystalline state. In that form, the C-C stretch splits into two sharp bands at 1060 and 1125 cm-1, the backbone stretch is sharp and appears near 1295 cm-1, and the >CH2 deformation region exhibits sharp bands near 1420, 1440, and 1460 cm-1. In the CH stretching region, crystalline polyethylene is dominated by a strong sharp band near 2880 cm-1, with a second, somewhat broader band at about 2840 cm-1, with about 65% of the peak intensity of the first band. As disorder increases, the band at 2880 cm-1 loses intensity relative to the 2840 cm-1 band, and higher frequency shoulders grow in intensity and sharpen. These are the features that we will be following in the 2D-COS behavior.
Results–Fingerprint Region
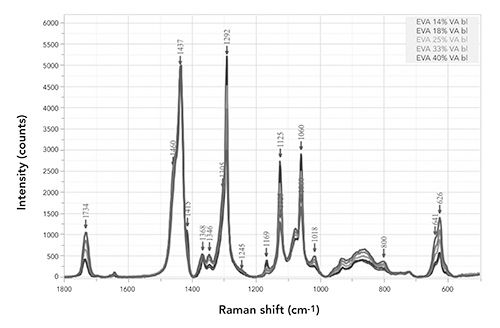
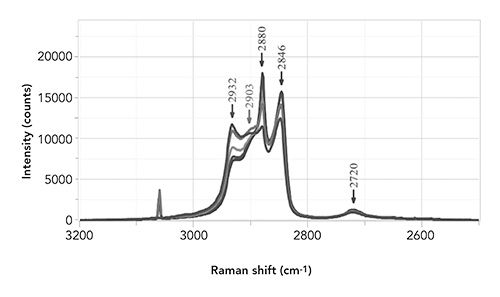
The spectra of the EVA samples in the fingerprint region are overlaid in Figure 3a, after scaling all the spectra to the intensity at the deformation near 1440 cm-1. Note that in this region there will be contributions from the methylene groups in the polyethylene segments, as well as the methyl group in vinyl acetate, and this may introduce some non-linearity to the spectra, but we will use the spectra scaled in this manner for this work, because we are looking more for effects of loss of crystallinity rather than small chemical changes. To make the examination of the spectra easier, I have color-coded the samples from violet to blue to green to red to brown as the concentration of VA changes from 14% to 18% to 25% to 33% and then 40%. The peak labels are brown (when the VA is at high concentration) or violet (when the VA is at low concentration). Thus, the violet labeled peaks correspond to peaks from the crystalline polyethylene units, and the brown labeled peaks correspond to peaks from the VA, and this can be confirmed by comparing these spectra from the various figures to those in Figure 1. Figure 3b shows the same spectra but in the CH stretching region. (The sharp band near 3060 cm-1 is an artifact from the room lights and should be ignored.) The purple and brown color-coding is identical to that of Figure 2a, but the apparent peak at 2903 cm-1 is highest in the 30% sample, not 14 or 40%, so it is labeled in the color of that sample. What will become apparent is that this intensity at 2903 cm-1 is not due to a real peak, but the overlap of bands in the two phases that happen to maximize in this sample.
2D-COS-Following Conformational and Morphological Changes
My goal is to understand how the conformation of the crystalline phase of polyethylene is changing as the VA concentration increases, and, in particular, what is the order of the changes. Before learning about 2D-COS, my assumption was that as a polymer changed, all parts of the material changed together. If this were the case, the asynchronous plots would be blank. Now we are able to determine the order of changes in the polymer as reflected by the order of changes in the spectral bands. In particular, we will follow bands of the crystalline versus amorphous forms of polyethylene, keeping in mind that the intensity of the marker bands for the crystalline phase go down, and the amorphous bands go up, as the VA is added. In addition, it is important to keep in mind that the intensity of the spots in the 2D-COS plots indicate the magnitude of the changes, not of the peaks themselves. In fact, in the diagonal points of the synchronous plots, all peaks have the same sign. That means that while the peaks indicating a disordered polyethylene lattice are increasing, those of the crystalline lattice are decreasing, but they are changing together. It is only by examining the off-diagonal points that we can determine which peaks are increasing, and which are decreasing. But to determine the sequence of the changes, we have to examine the asynchronous plots.
If I plot the entire 2D-COS spectra, it will not be possible to see the details of interest. I will be plotting first blocks along the diagonal, then blocks off the diagonal, to examine the behavior of cross-peaks. For example, I know that the sharp CH peaks near 2840 and 2880 cm-1 are attributable to the crystalline phase. If I want to understand how the changes in the CH region line up with changes in the CH2 deformation or the backbone stretch or the C-C stretches, then I will produce the 2D-COS plots with the CH region on one axis and a fingerprint region on the other axis.
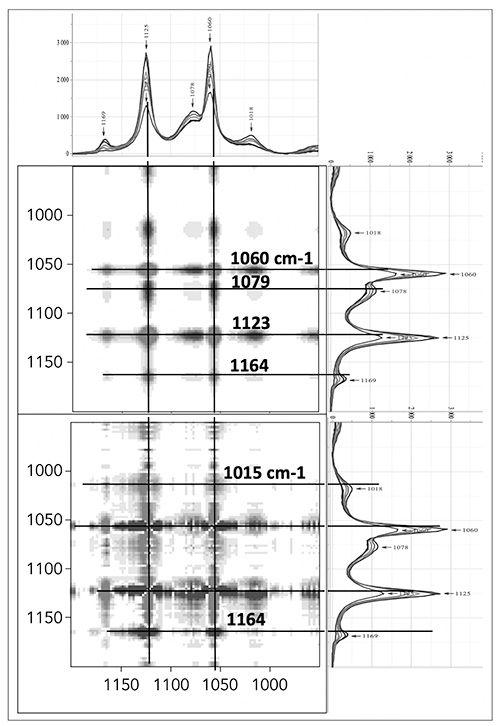
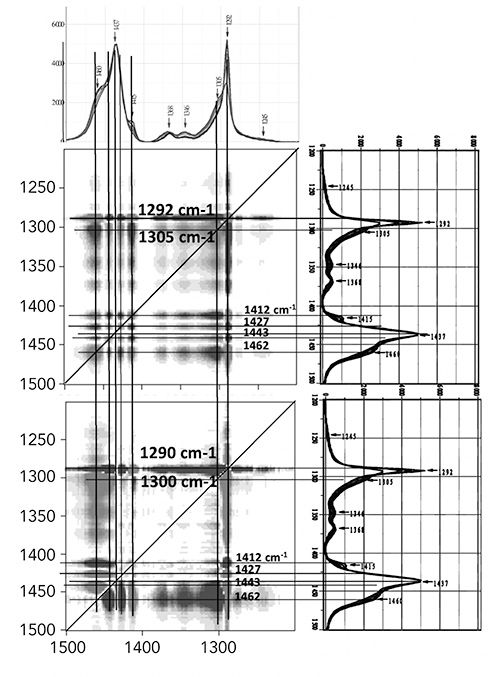
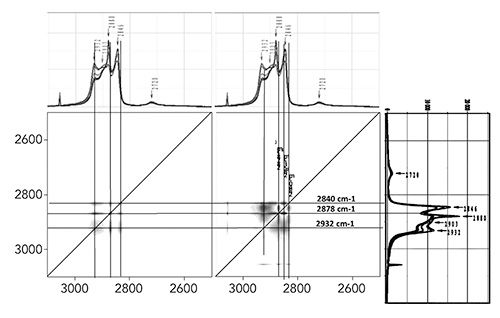
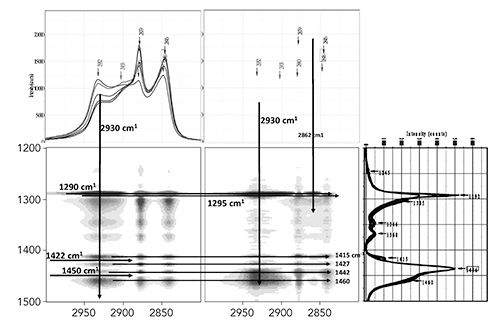
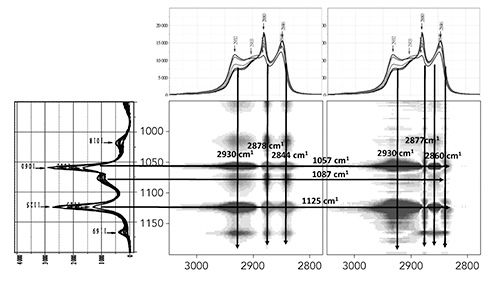
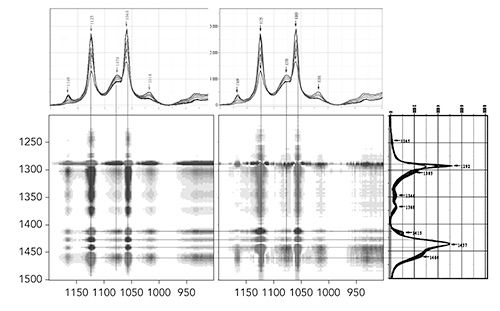
Figures 4 through 9 show the 2D-COS results in the following regions:
Figure 4: 950−1200 cm-1
Figure 5: 1200−1500 cm-1
Figure 6: 2500−3100 cm-1
Figure 7: 2800−3000 cm-1 vs. 1200-1500 cm-1
Figure 8: 2775−3050 cm-1 vs. 950-1200 cm-1
Figure 9: 900−1200 cm-1 vs. 1200-1500 cm-1
The rules for determining whether the change at ν1 comes before ν2, or visa versa (4) are shown in Table I. Table II shows the sequence in which the bands are changing that were derived from the 2D-COS plots. In order to produce this table, one has to inspect each of the partial 2D-COS plots and determine the sequence of the changes for the bands of interest in that plot. Then, when all the plots have been evaluated, it is possible to consolidate the results and produce the list shown in Table II. However, it is a bit tedious to get everything in a self-consistent order; it is more or less like solving a puzzle.

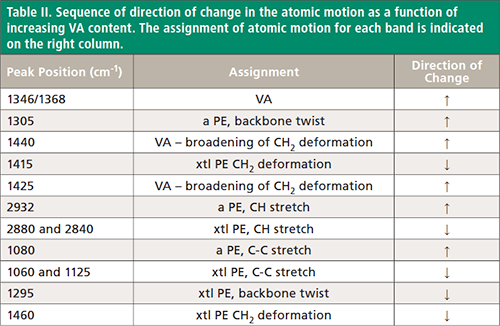
So what does this list mean? The first bands listed are the two VA bands near 1350 and 1370 cm-1. Although polyethylene does have a band in this region (the so-called umbrella mode of CH3 groups), most of the change here is from the VA. In fact, careful examination of the overlaid spectra in this region (Figure 3a) does indicate that at low VA concentration, the band at 1368 cm-1 is sharper, and more intense, than the band at 1346 cm-1, but at high VA concentration the two have similar widths and intensities exactly as in the VA and 44% EVA as shown in Figure 1. The next band to exhibit changes is the backbone twist in amorphous polyethylene, which, of course, grows in intensity with VA; note that this band is totally absent in PVA, so its presence indicates only the amorphous content of polyethylene, and no contribution from VA.
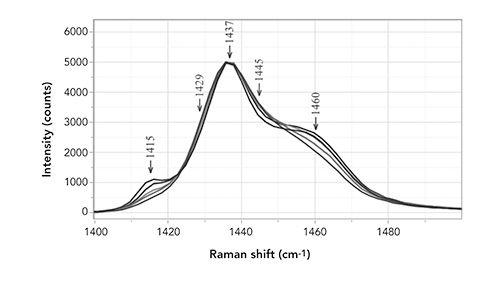
Following this are changes around the >CH2 deformation that was used for normalization at 1437 cm-1. What is curious is that the two small spots that seem to indicate symmetric increases in intensity at 1427 and 1440 cm-1 in the synchronous plot do not behave in parallel. The 1440 cm-1 spot increases first, the 1415 cm-1 band of crystalline polyethylene decreases next, and then the 1425 cm-1 spot increases. To convince myself that this conclusion really reflects the data, I have plotted this region of the spectra in Figure 10. The figure shows clearly the decrease in the crystal bands at 1415 and 1460 cm-1, but it also shows broadening around the centroid at 1437 cm-1. The spots appear in the 2D-COS plots because of the -CH3 group on the acetyl that replaces one of the protons on the chain. In fact, the normalization to the centroid of the >CH2 probably enhances the ability to see the increase in width. The spectral plot does not indicate directly the order of the changes, but at least it does support the conclusions from the 2D-COS.
Following these changes, there is the growth of the amorphous contributions in the CH region at 2932 cm-1. Then there is the loss in intensity of the crystalline CH bands near 2880 and 2840 cm-1. After that there is growth in the amorphous C-C stretch at 1080 cm-1, followed by decrease in the crystalline C-C stretches at 1060 and 1125 cm-1. Finally, there is loss in intensity of the backbone twist of the crystalline polyethylene, and then the loss in intensity of the 1460 cm-1.
Discussion
When I examine these changes, the trend that I see is that first we observe growth in the VA bands that have no overlap with polyethylene (1346 and 1368 cm-1), and then the changes seem to happen with the growth of the amorphous phase before the loss of crystallinity. In most cases, changes of analogous bands (amorphous and crystalline) occur sequentially; see the bands in the CH region and then the C-C region. The last bands to change are the backbone twist of the crystalline phase, and then the last component of the >CH2 at 1460 cm-1.
I found the results in the >CH2 deformation region puzzling. While both the 1415 and 1460 cm-1 are clearly associated with crystallinity, they did not behave the same. But the following will explain what is going on. In the amorphous phase there is a single chain δ(>CH2) mode at 1440 cm-1 of A1g symmetry. In the crystal there are two chains per unit cell, and polarization studies have shown that this mode splits into bands at 1415 and 1440 cm-1. In order to explain the 1460 cm-1 band in the crystalline phase, the overtone of the IR active band is invoked. The single chain >CH2 rocking IR band of B2u species appears at 720 cm-1 in the amorphous phase, but splits into a doublet at 720 and 730 cm-1 in the crystalline phase. Thus the overtone of the 720 cm-1 band will overlap with the 1440 cm-1 component of the split-off Raman band, and the overtone of the second at 730 cm-1 will be the Raman band observed at 1460 cm-1. These assignments have been summarized in (1).
It is tempting to try to rationalize the order in which the band changes occur. That the first change was the introduction of VA bands is easy to understand. But why would the appearance of the backbone twist of the amorphous phase appear so much earlier than the disappearance of the twist in the crystalline phase? Why does the disappearance of the 1415 cm-1 crystalline band occur between the two spots that appear in the 2D-COS at 1440 and 1425 cm-1; perhaps because the magnitude of the changes on the two sides of the 1437 cm-1 band are not equal? One can argue that the changes in the CH stretches precede those of the CC stretches and crystal backbone because it is easier for the protons to adjust to changes than the CC units, which are constrained and coupled together. Likewise, it can be argued that it is easier for there to be adjustments in the single CC bond stretches than the backbone twist, which probably requires some minimum coherent sequence length along the chain.
After this work was completed experimentally and I was preparing to write, I picked up the text by Noda and Ozaki and it fell open to pages in which analysis of this same chemical system was described (5)! The work cited in this section of the text goes back to 1999, in which Fourier transfer (FT) Raman spectra were analyzed only in the fingerprint region. The results were discussed in terms of the three-phase model (the orthorhombic crystal phase, a melt-like amorphous phase, and an isotropic disordered phase). Some of their conclusions are different than ours, but they did not describe how the spectra were normalized for comparison. I believe that the analysis and conclusions can be different, because I have normalized spectra at 1437 cm-1.
Summary
Of what use is all this? The question is important, because in deriving Table II, much time was involved to check and recheck the sequences and I have to ask myself if it was worth doing. Because polymers are used for many applications with quite differing physical and chemical requirements, and the physical and chemical properties depend not only on their chemical composition, but on their history, this type of analysis can provide information that is difficult to acquire by other means. In particular, polymers are often extruded from the melt and the speed with which they are extruded as well as the temperature and other factors will determine the physical properties, including (but not limited to) orientation, crystallinity, and ductility. Because the 2D-COS results provide information on the atomic/molecular scale, the polymer chemist can access this information to engineer their materials. For instance, the ductility of a polymer depends (inversely) on the crystallinity. If the EVA is being made for an adhesive application, it will need to be ductile, but not so much that it will flow. Using the information provided in Table II, along with MVA (multivariate analysis predictions), one should be able to determine the morphological characteristics effecting the ductility, and then adjust the manufacturing conditions for optimization. For example, tuning the extrusion temperature, or amount of shear, could potentially change the order in which these changes occur, which could affect the bulk physical properties.
References
- D.I. Bowers, and W.F. Maddams, The Vibrational Spectroscopy of Polymers (Cambridge University Press, Cambridge, United Kingdom, 1989).
- Scientific Polymer Products, Polyethylene High Density Pellets CAS#25213-0209 Cat#041, Ontario, NY.
- F. Adar, Spectroscopy24(10), 16–19 (2009).
- I. Noda and Y. Ozaki, Two-Dimensional Correlation Spectroscopy (John Wiley and Sons, Ltd. Chichester, United Kingdom, 2004).
- Section 10.4 Composition-based 2D Raman Study of EVA Compounds in Reference 4.

Fran Adar is the Principal Raman Applications Scientist for Horiba Scientific in Edison, New Jersey. Direct correspondence to: SpectroscopyEdit@mmhgroup.com.

AI-Powered SERS Spectroscopy Breakthrough Boosts Safety of Medicinal Food Products
April 16th 2025A new deep learning-enhanced spectroscopic platform—SERSome—developed by researchers in China and Finland, identifies medicinal and edible homologs (MEHs) with 98% accuracy. This innovation could revolutionize safety and quality control in the growing MEH market.
New Raman Spectroscopy Method Enhances Real-Time Monitoring Across Fermentation Processes
April 15th 2025Researchers at Delft University of Technology have developed a novel method using single compound spectra to enhance the transferability and accuracy of Raman spectroscopy models for real-time fermentation monitoring.
Nanometer-Scale Studies Using Tip Enhanced Raman Spectroscopy
February 8th 2013Volker Deckert, the winner of the 2013 Charles Mann Award, is advancing the use of tip enhanced Raman spectroscopy (TERS) to push the lateral resolution of vibrational spectroscopy well below the Abbe limit, to achieve single-molecule sensitivity. Because the tip can be moved with sub-nanometer precision, structural information with unmatched spatial resolution can be achieved without the need of specific labels.
