Characterizing Modified Celluloses Using Raman Spectroscopy
Raman spectra of celluloses modified for use in the pharmaceutical, food, and materials industries will be compared and analyzed, with the goal of determining spectroscopic features that can be of use in aiding in the determination of physical and chemical properties.
Raman spectra of celluloses modified for use in the pharmaceutical, food, and materials industries are compared and analyzed, with the goal of determining spectroscopic features that can be of use in aiding in the determination of physical and chemical properties.
Cellulose is probably the most abundant biopolymer on Earth and has been exploited since the dawn of human civilization. Wood materials have been used in construction, and cotton and flax (linen) have been used for clothing and other textile applications. During later times paper was manufactured from cellulosic sources and used for recording information.
Chemically, wood, cotton, and linen are all identified as cellulose, but their physical and chemical properties can be quite different. A lot is known today about the structure of these materials, and spectroscopy, in combination with X-ray diffraction (XRD), electron diffraction, and nuclear magnetic resonance (NMR), has been used to probe the mystery of these structures. In more modern times, cellulose has been chemically modified for a variety of uses in the pharmaceutical, food, and materials industries. The ability to make these chemical modifications depends, to a large extent, on the history of the cellulose starting material-its purity, crystallinity, and fibrillar dimensions. The physical measurements have enabled the cellulose research community to develop a microscopic model of its form, which in turn aids in understanding its reactivity. This column installment is an attempt to summarize this background material with the goal of then providing some insight into the chemical reactions between cellulose and certain small molecules that can change the physicochemical properties of the reacted material. After that, we can look at the Raman spectra of a few of these modified celluloses to assess whether the spectra can be useful in characterizing the final products.
Cellulose Background
For the first use of cellulose in a modern application, think of microcrystalline cellulose (MCC), the white powder that is one of the excipients added to pharmaceutical tablets to aid in their dissolution in aqueous environments. Then there is cellulose gum, which is actually methyl cellulose, hydroxypropyl methyl cellulose, or carboxymethyl cellulose derivatives that provide a smooth feeling in the mouth in processed food in which the fat content is restricted. The details of the modifications (the chemistry of the substituent, percent substitution, molecular weight, and so on) will determine the temperature of gelation and the viscosity of the products. Actually, hydroxypropyl methyl cellulose (HPMC) is an interesting example because of the variety of ways that it is used. In pharmaceutical tablets, HPMC can be used as a protective coating, and as a rate controlling release agent in timed-release formulations. HPMC’s high viscosity also enables its use as an ophthalmic preparation for dry eyes.
To understand how these various products are made, we first look at the chemical and physical structure of cellulose. (I will depend on a chapter from the Encyclopedia of Polymer Science and Technology and two review articles from Comprehensive Natural Products Chemistry for this information [1–3].) Cellulose is a linear, unbranched polymer of glucose, assembled with β-1,4 linkages. Its structure is shown in Figure 1-notice that every other glucose unit is flipped by 180°. For this reason, the monomeric unit of the polymer is often defined as the dimer, called cellobiose. One curious fact is that even though glucose is a highly soluble molecule, the cellulose polymer is virtually insoluble in water.

Figure 1: Structure of cellulose chain.
Glucose can also be assembled into another biological polymer-starch. In fact, starch is a mixture of the linear amylose (20–25%) and branched amylopectin (75–80%). In contrast to cellulose, the covalent bond linking the glucose monomers is an α-1,4 linkage. Also in contrast to the properties of cellulose, starch is highly soluble in water and digestible by humans. Cellulose is only digestible in ruminants because their stomachs contain bacteria with enzymes that are capable of attacking the β-1,4 linkage.
Cellulose is actually chemically quite robust and the challenge to exploit it chemically is to “disassemble” it. In plants, that means releasing the lignin and hemicellulose (other sugar polymers) that coexist with it. But even when one has purified cellulose, its chemical reactivity will depend on the packing of the molecules in the solid. At least four crystallographic phases have been identified in cellulose. Cellulose I is the form which is usually found in nature; it, in fact, has two subforms noted α and β. Raman spectroscopy shows that the fingerprint spectra of these forms are virtually identical, but that there are differences in the OH region (see Figure 11 in reference 1). This points out the importance of hydrogen bonding in these materials. In fact, the hydrogen bonding plays a large part in the stability, and, therefore, the chemical resistance of the material. A common treatment of cellulose is mercerization. Fibers are clamped to prevent shrinkage during treatment with NaOH; the fibers swell, increase their luster, are easier to dye, and are resistant to mildew, but have an increased tendency to shrink. The cellulose is converted to form II. There are two other polymorphs of cellulose; they can be generated from either cellulose I or II, and curiously they retain “memory” of the initial form from which they were generated. There is an on-going controversy as to whether there are two chains per unit cells or one, and discussion of this controversy is certainly beyond the scope of this short article. But there is no controversy as to the importance of H-bonding in the structures, and it is the OH groups that are available for conversion to chemically modified forms of cellulose. The important point to recognize is that the cellulose solid has to be open enough to allow reactions to occur, and therefore the crystal packing of the starting material will determine the extent of the reaction.
To be semipredictive of what to expect, note that there are three hydroxyl groups on each glucose molecule, but they are not equivalent. According to Figure 1, one hydroxyl group in the ring is hydrogen-bonded to an oxygen atom in an adjacent glucose ring. Another hydroxyl group is attached directly to the ring, and the last hydroxyl is attached to the pendant methylene group. As shown, these last two hydroxyls are available for H-bonding between chains. It is not difficult to see how the availability for H-bonding can affect and control aggregation, and as the cellulose molecule packing becomes denser, the availability for reactions at the hydroxyl sites will be reduced. One is then led to the conclusion that differences in performance of nominally identical materials can be attributed to differences in percent conversion. It is my goal to examine the spectra of a few modified celluloses to determine if there is information to be acquired.
Examining Cellulose Spectra
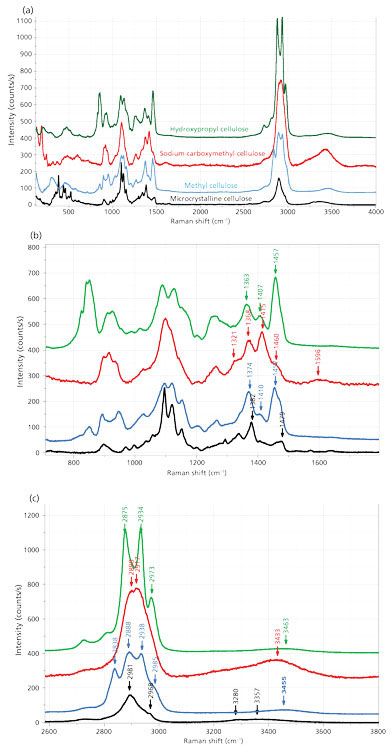
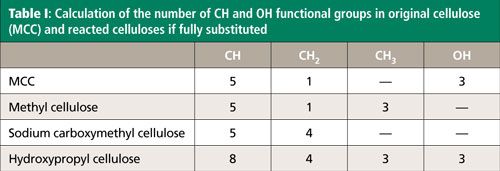
The spectra in Figure 2 show the results of measurements (from bottom to top) of microcrystalline cellulose (MCC), methyl cellulose, sodium carboxymethyl cellulose, and hydroxypropyl cellulose (HPC). We have scaled the spectra so that the peak intensities in the region of the C-C and C-O single bonds (near 1100 cm-1) are approximately equivalent. What we will look for is changes in CH stretching (2800–3000 cm-1) and deformation (1430–1480 cm-1) intensities relative to the backbone intensities near 1100 cm-1 and the OH intensity between 3100 and 3600 cm-1. In MCC there are five CH groups per glucose unit, one methylene CH2 unit and three OH groups. In methyl cellulose, if all OH groups are converted, there will be five CH groups, one methylene group and three methyl groups. In sodium carboxymethyl cellulose there will be five CH groups, four methylene groups (one from the original pendant group, and potentially three from the conversion of three OH groups to OCH2CO2H), but no expected OH groups because the proton would be replaced by sodium. In HPC there will be eight CH groups (five from the ring plus one from each hydroxylpropyl substitution), and four methylene groups (one from the original pendant group, and potentially three from the conversion of three OH groups to OCH2CHOHCH3) and three methyl groups, and then three hydroxy groups from the three hydroxypropyl substitution. This information is summarized in Table I.

Figure 2: (a) Raman spectra of microcrystalline cellulose, methyl cellulose, sodium carboxymethyl cellulose, and hydroxypropyl cellulose. (b) Spectra enlarged in the fingerprint region to better define the differences. (c) Spectra enlarged in the CH-OH region to better define the differences.

In comparing the spectra of microcrystalline cellulose to that of methyl cellulose, we can see the effects of the additional methyl groups. What was a small doublet CH2 deformation band in MCC near 1479 cm-1 becomes a much stronger band at 1457 cm-1 in methyl cellulose because of the presence of the additional CH3 groups. In the CH stretching region, one can argue that the bands at 2838 and 2938 can be assigned to the symmetric and asymmetric CH3 stretches. The apparent intensification of the methine stretch at 2891 cm-1 is attributed to the wings of the CH3 bands. Note that the intensity of the OH band in this spectrum is quite low, suggesting that most of the hydroxyl groups have been reacted.
Now, let’s compare the spectrum of sodium carboxylmethyl cellulose to MCC. The spectrum is clearly altered, but the significant intensity in the OH region should be assigned to OH of the carboxy groups, suggesting that the sodium ion is not incorporated. The intensification in the CH stretching region is assigned to the additional three CH2 groups. In the region of the CH2 and CH3 deformations there is a shoulder at 1460 cm-1 but a strong band at 1415 cm-1 which is assigned to the CH2 deformation from the substitution.
Finally, let’s compare the spectrum of HPC to MCC. The OH in this spectrum is assigned to the OH groups of the substitution. The CH stretching region is the most intense of all the modified species. The bands at 2973 and 2934 cm-1 are assigned to the asymmetric CH3 and CH2, respectively. The band at 2875 cm-1 is assigned to a combination of symmetric stretches for CH3 and CH2.
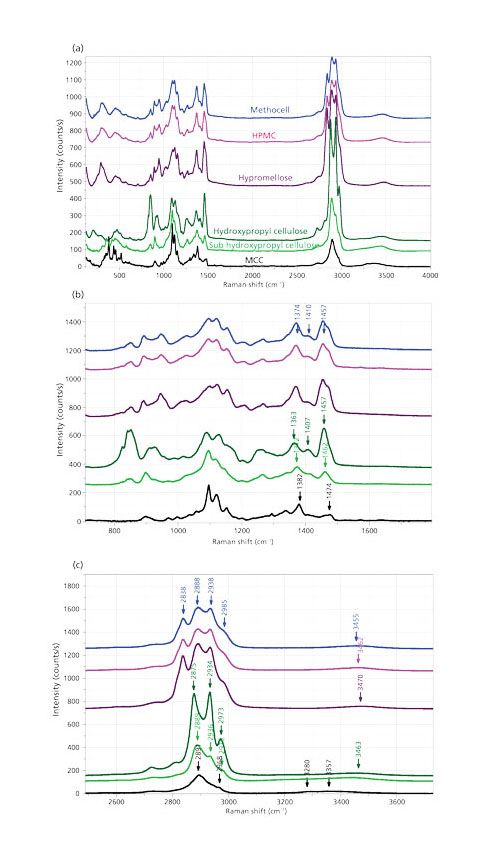
Note that these are tentative assignments. I am guided by the textbooks on the interpretation of IR and Raman spectra (4). In addition, the use of these spectra for quantitation is still very semiquantitative. In scaling at 1100 cm-1 I attempted to make the spectra comparable. But in fact, there is intensity in this region from the C-C and C-O bonds of the added functional groups. My goal is to indicate that with enough samples and information on their chemistry, these spectra can be calibrated for predictions using multivariate analysis. Figures 3a–3c show spectra of nominally similar materials, but with differing amounts of reacted functionality.
These materials have been substituted with hydroxypropyl or methyl groups, by varying amounts. At the bottom of Figure 3, I show MCC because of the similarity with the sub-HPC spectrum. My interpretation is that enough hydroxypropyl groups were substituted to disrupt the packing of the cellulose, but clearly not enough to give the pattern of the HPC where the CH2–CH3 deformation is quite strong.

Figure 3: (a) Raman spectra (from bottom to top) of MCC, sub-hydroxypropyl cellulose, hypromellose (hydroxypropyl methylcellulose) HPMC, and methyl cellulose. (b) Fingerprint Raman spectra (from bottom to top) of MCC, sub-hydroxypropyl cellulose, hypromellose (hydroxypropyl methylcellulose) HPMC, and methyl cellulose. (c) Raman spectra in the CH-OH region (from bottom to top) of MCC, sub-hydroxypropyl cellulose, hypromellose (hydroxypropyl methylcellulose) HPMC, and methyl cellulose.
The next two spectra going up Figure 3 are those of hypromellose and HPMC, both of which are hydroxypropyl methylcellulose. These spectra are quite similar but, in fact, the HPMC resembles methylcellulose more than the hypromellose. The implication is that there are more substitutions on HPMC of methyl for the proton on the hydroxyl than substitution of the hydroxypropyl group.
Conclusions
I have presented Raman spectra of some commonly available modified forms of cellulose to determine if these spectra can be predictive of the chemically transformed material. This small study shows that the spectra do reflect the altered chemistries. Note that the samples whose spectra I recorded were not well-characterized. They were simply samples that I have in my collection (with the exception of the sodium carboxymethyl cellulose, which was kindly sent to me by Philo Morse at Particle Sciences). Even with this limited knowledge of the samples’ histories, I was able to construct a self-consistent story. In particular, this could be of use in understanding the modes of reactivity of the cellulose. Presumably, the three different hydroxyl groups have the potential for different reactivities; it is also well known that aggregation of the cellulose has a large impact on the reactivity, and this type of measurement could help in determining the controlling factors of the chemical reactions.
Acknowledgments
I would like to thank Professor Rajai Atalla for the many detailed discussions on the structure of celluloses, especially as it is elucidated by Raman spectroscopy.
References
- R. Atalla, in Comprehensive Natural Products Chemistry, Carbohydrates and their Derivatives Including Tannins, Cellulose and Related Lignins, Volume 3, B. Mario Pinto, Ed. (Elsevier, 1999), pp. 529–598, chap. 3.16.
- A. French, N.R. Bertoniere, R.M. Brown, H. Chanzy, D. Gray, K. Hattori, and W. Glasser, in Encyclopedia of Polymer Science and Technology, Volume 5 (John Wiley and Sons, Inc., 2003).
- R.H. Atalla and A. Isogai, in Celluloses in Comprehensive Natural Products II Chemistry and Biology, L. Mander and H.W. Lui, Eds. (Elsevier, Oxford, 2010), pp. 493–539, chap. 6.16.
- G. Socrates, Infrared and Raman Characteristic Group Frequencies - Tables and Charts (John Wiley and Sons, 2001).

Fran Adar is the Principal Raman Applications Scientist for Horiba Scientific in Edison, New Jersey. Direct correspondence to: SpectroscopyEdit@UBM.com.

A Proposal for the Origin of the Near-Ubiquitous Fluorescence in Raman Spectra
February 14th 2025In this column, I describe what I believe may be the origin of this fluorescence emission and support my conjecture with some measurements of polycyclic aromatic hydrocarbons (PAHs). Understanding the origin of these interfering backgrounds may enable you to design experiments with less interference, avoid the laser illuminations that make things worse, or both.
Raman Microscopy for Characterizing Defects in SiC
January 2nd 2025Because there is a different Raman signature for each of the polymorphs as well as the contaminants, Raman microscopy is an ideal tool for analyzing the structure of these materials as well as identifying possible contaminants that would also interfere with performance.