The Infrared Spectroscopy of Alkenes
Spectroscopy
Now that we have completed our discussion of benzene rings and the infamous “benzene fingers,” the next topic on our hydrocarbon hit parade are carbon-carbon double and triple bonds. C=C bonds, otherwise known as alkenes, come in six different structural isomer types, while triple bonds, known as alkynes, come in two varieties. This column provides you with all the tools you need to distinguish all of these different types of molecules from each other.
Now that we have completed our discussion of benzene rings and the infamous “benzene fingers,” the next topic on our hydrocarbon hit parade is carbon–carbon double bonds. C=C bonds, otherwise known as alkenes, come in six different structural isomer types. This column provides you with all the tools you need to distinguish all of these different types of molecules from each other.
We are done, for the time being, with our discussion of how to distinguish the isomers of mono- and disubstituted benzene rings from each other, which centered in part on the infamous “benzene fingers” (1). Before that, I discussed how aromatic rings are a type of a larger class of molecules called unsaturated hydrocarbons (2). These hydrocarbons contain functional groups with carbon–carbon bond orders > 1. Unsaturated hydrocarbons can have hydrogens attached to them via chemical reaction, which means these molecules do not have their full theoretical complement of hydrogens and hence are “unsaturated” with respect to hydrogen substitution (3).
For example, aromatic rings have a carbon–carbon bond order of about 1.5 (3), and the prototype aromatic compound benzene, with the chemical formula C6H6, can have hydrogens added to it to form the saturated compound cyclohexane, C6H12 (3). This example shows that benzene and other aromatic rings contain unsaturated carbons.
Another family of unsaturated hydrocarbons contain carbon–carbon double bonds, C=C, and are called alkenes. This column focuses on using infrared (IR) spectroscopy to distinguish the different types of alkenes from each other.
As an aside, starting with this column installment I will stop using cm-1 after every peak position. Going forward, you can simply assume that the peak position units will be in wavenumbers (cm-1) although the text will not say as such.
The Chemical Structure of Alkenes
Alkenes contain unsaturated carbons because C=C bonds can have hydrogens added to them via a reaction known as hydrogenation to create saturated carbons (3). Hydrogenated vegetable oil contains unsaturated fats whose C=C double bonds have been hydrogenated to form saturated fats.
Structural isomers are molecules that have the same chemical formula but different chemical structures, such as the ortho, meta, and para isomers of disubstituted benzene rings discussed previously (4). IR spectroscopy can distinguish between structural isomers because these molecules have different bond strengths, reduced masses, and hence different peak positions (5). Alkenes consist of six different varieties, some of which exhibit structural isomerism. A diagram of the different types of alkenes is shown in Figure 1.
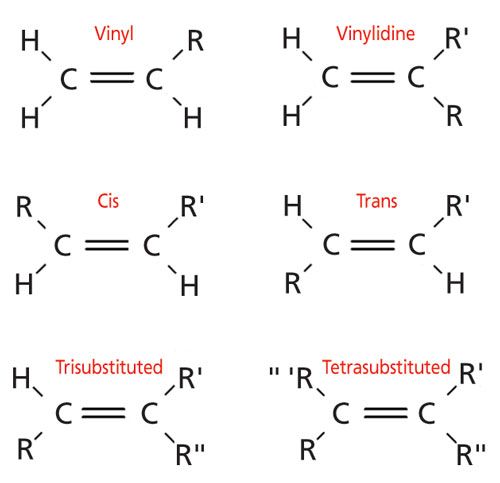
Vinyl groups consist of a double bond with three hydrogens and one nonhydrogen atom attached, which will be referred to henceforth as “R-groups.” Vinyl groups are important industrially because they react to form common polymers such as polypropylene, polystyrene, and polyvinylchloride.
There are three different alkene structural isomers that consist of a C=C bond with two hydrogens and two R-groups attached. In a vinylidine molecule the two hydrogens are attached to one carbon while the R-groups are on the other carbon. Vinylidene molecules are not common industrially and will not be discussed further. The other two types of C=C bonds with two hydrogens are called cis and trans. As illustrated in Figure 1, cis isomers have their hydrogens on the same side of the double bond, while trans isomers have their hydrogens diagonally across from each other. One way of remembering these terms is that the Latin word “trans” means “across,” and that the English verb “to transport” means to carry something across from one place to another. The prefix cis is also derived from a Latin word and means “on the near side.” The cis and trans isomers of fats have been in the news because of their effect on human health. Many food labels these days contain statements about how much cis and trans fats a product contains. As we will see below, cis and trans isomers have different IR spectra, which is why IR spectroscopy can be used to distinguish and quantitate these fats in samples.
When an alkene contains three R-groups and one hydrogen it is called a trisubstituted alkene. These have no structural isomers. Lastly, a C=C bond with four R-groups is called a tetrasubstituted alkene, and again has no structural isomers. In my opinion, the most industrially important alkenes are the vinyl, cis-, trans-, and trisubstituted varieties. As a result, our discussion below focuses on these types of molecules. We shall discover that we can distinguish all six types of alkenes from each other using IR spectroscopy.
The IR Spectroscopy of Saturated and Unsaturated Carbons
In a previous column (6), we saw that the saturated carbon containing functional groups methyl (CH3) and methylene (CH2) both have C-H stretches below 3000. Another type of saturated carbon, the methine group, which consists of a carbon atom with three C-C bonds and one C-H bond, also has a C-H stretching peak below 3000 (methine groups will be discussed in a future column on branched alkanes). In general, saturated carbons have C-H stretching peaks below 3000.
From our discussion of aromatic rings we found that these unsaturated molecules have C-H stretches above 3000 (2). Alkenes and alkynes, unsaturated molecules with carbon–carbon triple bonds, also have C-H stretches above 3000. So, in general, we can say that molecules with saturated carbons have C-H stretches below 3000, while molecules with unsaturated carbons have C-H stretches above 3000. These ideas are summarized in Table I.

I have stated in previous columns that all of the peak ranges I present have exceptions, and that there are no absolute rules when it comes to interpreting IR spectra. Although the rules in Table I have known exceptions, they are few and Table I is an excellent tool to use when interpreting IR spectra. If a sample has C-H stretches above 3000 only, then most likely all the carbons are unsaturated and I refer to the sample as “unsaturated only.” If a sample has C-H stretches below 3000 only, chances are all the carbons are saturated and I refer to the sample as “saturated only.” If a sample has C-H stretches above and below 3000 it most likely contains saturated and unsaturated carbons and I refer to it as a “mixed” sample. Determining whether the C-H stretches in a spectrum are above or below 3000 is quick and easy, and it should be one of the first pieces of information you extract from a spectrum.
Recall that methyl and methylene groups have specific C-H stretching peaks that can be used to distinguish them from each other (6). Unfortunately, this situation is generally not the case for unsaturated carbons. Both aromatic rings and alkenes typically have their C-H stretches between 3100 and 3000. Because of this overlap the presence of peaks in this range is diagnostic for unsaturation, but not the type of unsaturation. To determine the type of unsaturation it will take the use of other peaks in the spectrum, as discussed below.
The IR Spectroscopy of Alkenes
The IR spectrum of a vinyl-containing molecule, 1-octene, is shown in Figure 2.
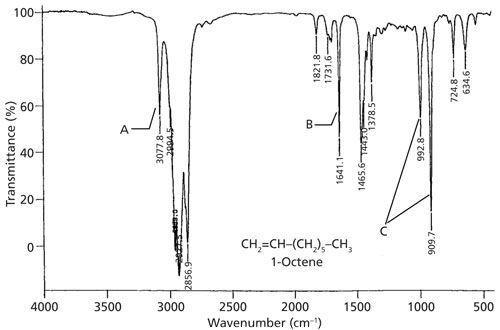
Figure 2: The IR spectrum of 1-octene.
Note that in the structure of the molecule shown in Figure 2 there are methyl groups, methylene groups, and a C=C bond. This structure is an example of a mixed molecule and thus it should have C-H stretches above and below 3000. This is in fact the case as the vinyl C-H stretching peak is labeled A and falls at 3077, and the CH3 and CH2 stretching peaks form an envelope below 3000.
In addition to C-H bonds, alkenes of course have C=C bonds. The stretching of this double bond gives rise to a peak in the spectra of alkenes between 1680 and 1630. In 1-octene this peak falls at 1641 and is labeled B in Figure 2. As I’ve written previously (5), one of the factors that determines IR peak heights is the change in dipole moment with respect to bond length, dµ/dx, during a vibration. This fact is well illustrated by the C=C stretching peak intensities of alkenes. If a C=C bond has a highly electronegative substituent such as an oxygen atom, the C=C bond will be highly polarized, dµ/dx will be large, and the C=C stretching peak will be intense. If an alkene has only carbons and hydrogens arranged around the double bond, and if it is asymmetrically substituted, dµ/dx will be smaller and the C=C stretching peak will be less intense. If an alkene is symmetrically substituted, such as ethylene (C2H4), the C=C stretch is a symmetric stretch of a symmetric molecule, similar to the symmetric stretch of CO2. In both cases dµ/dx is zero and the peak intensity is zero (5). Thus, the C=C stretching peak of alkenes can be intense, weak, or nonexistent depending on the substituents and their arrangement around the double bond. Therefore, this is not a totally reliable group wavenumber.
Recall that benzene rings have “ring modes” because of the stretching of carbon–carbon bonds in the ring, and they fall between 1630 and 1400. As discussed above, alkene C=C stretches fall between 1680 and 1630. This means the 1630 point in a spectrum is a useful dividing line, if there are C-H stretches between 3100 and 3000 and a peak between 1680 and 1630 the unsaturation is likely an alkene. If there are C-H stretching peaks between 3100 and 3000, no peak between 1680 and 1630, but there are one or more sharp peaks between 1630 and 1400 the unsaturation is most likely an aromatic ring. If there are C-H stretches above 3000, peaks between 1680 and 1630, and peaks from 1630 to 1460, then both an aromatic ring and alkene may be present.
There are two intense peaks in the spectrum of 1-octene at low wavenumbers, collectively labeled C in Figure 2. These two peaks are from out-of-plane C-H bending vibrations, or wags as I like to call them. Like aromatic rings, C=C bonds are planar and the C-H bonds fall in the plane defined by the double bond. Thus, C-H bonds can bend above and below the plane of the molecule in the same fashion that a dog wags its tail. Recall that for benzene rings these peaks fell from 1000 to 700 (7). The C-H wags of alkenes fall in a similar range, between 1000 and 600.
To summarize then, the IR spectra of alkenes are characterized by one or more C-H stretching peaks between 3100 and 3000, a possible C=C stretch from 1680 to 1630, and one or more C-H wagging peaks from 1000 to 600. In the next section, we discover how to use the double bond stretch and C-H wagging peaks together to distinguish the different types of alkenes from each other.
Distinguishing Alkene Types
We have used Figure 2 so far as a generic example of a double bond spectrum, but it is also the spectrum of a vinyl group. The C=C stretch falls at 1641, and for vinyl groups generally this peak falls from 1660 to 1630. The pair of sharp, intense C-H wags at 993 and 910 are also indicative of vinyl. These peaks generally fall at 990 ± 5 and 910 ± 5. Both of these peaks must appear in the spectrum for a vinyl group to be present. These two peaks appear in one of the narrowest ranges seen, and are sharp and intense-perfect examples of group wavenumbers.
The IR spectrum of a cis-containing molecule, synthetic rubber, is shown in Figure 3.
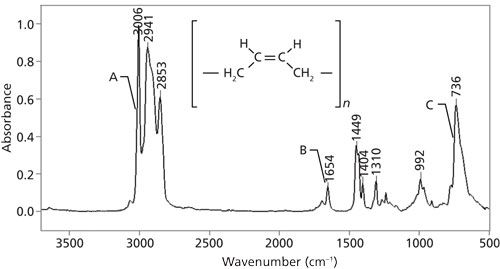
Figure 3: The infrared spectrum of synthetic rubber.
Note that synthetic rubber contains a cis double bond and methylene groups, is a mixed molecule, and has C-H stretches above and below 3000. However, the C-H stretch at 3006 could also be due to an aromatic ring. However, the peak at 1654 is from a C=C stretch. For cis double bonds, generally, this peak falls from 1660 to 1630. Lastly, the cis C-H wagging peak is seen at 736. This peak is usually seen at 690 ± 50 for cis double bonds. Many rubbery polymers contain C=C bonds, so their detection by IR spectroscopy is important in the rubber industry.
CLICK IMAGE TO ENLARGE
The IR spectrum of trans-butadiene rubber is shown in Figure 4. As can be guessed from its name it contains predominately trans double bonds.
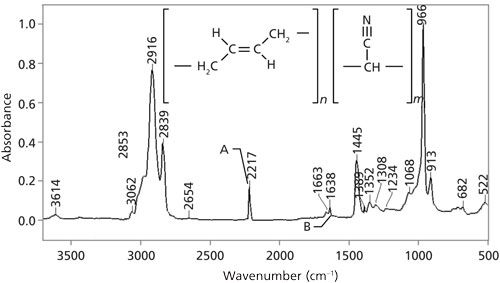
Figure 4: The infrared spectrum of trans-butadiene rubber.
Because this material is a mixed molecule, it has C-H stretches above and below 3000. The peak labeled B at 1638 is from the trans double bonds present, and the sharp, intense peak at 966 is from the C-H wag of the trans bonds. For trans alkenes, generally, the C=C stretch falls from 1680 to 1660, and the C-H wag appears at 965 ± 5. Like the C-H wags of vinyl groups, the C-H wag of a trans double bond is sharp, intense, falls in a narrow range, and is very easy to spot. The peak labeled A in Figure 4 at 2217 is the C≡N stretch of a nitrile, whose spectrum will be discussed in a later article.
Lastly, the IR spectrum of a sample containing a trisubstituted double bond, natural rubber, is shown in Figure 5.
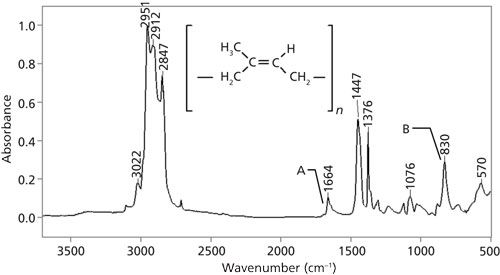
Figure 5: The IR spectrum of natural rubber.
Again, natural rubber is a mixed molecule and has C-H stretches above and below 3000. The C=C stretch is at 1664, and the C-H wag is at 830. For trisubstituted alkenes, generally, these peaks fall from 1680 to 1660 and at 815 ± 25.
Tetrasubstituted alkenes have no hydrogens attached to the C=C moiety, and thus have no alkene C-H stretching or wagging peaks. They do have a C=C stretching peak, which appears from 1680 to 1660. This peak also appears for other types of alkene, so it is not diagnostic. As discussed above, if a tetrasubstituted alkene has four identical substituents the peak intensity of the C=C stretch may be zero, in which case there will be no peaks identifying the presence of a tetrasubstituted alkene in a sample. Table II summarizes the peak positions for six different types of alkenes.
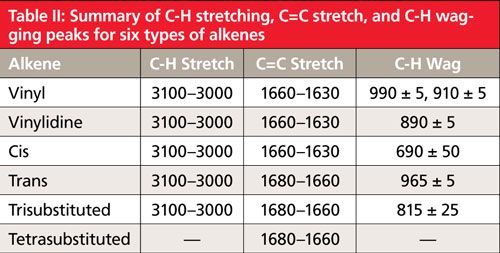
Note from Table II that the vinyl, vinylidine, and cis C=C stretches fall from 1660 to 1630, while trans, trisubstituted, and tetrasubstituted alkene C=C stretches appear from 1680 to 1660. Thus, we can use the C=C stretching peak position to break down alkenes into two separate groups. However, this is not enough to distinguish all of them uniquely, which is where the C-H wags come in. The position and number of C-H wags is different for each of the alkene types. Therefore, the position of the C=C stretching peak and the number and position of the C-H wags together can be used to distinguish these alkenes from each other.
References
- B.C. Smith, Spectroscopy31(9), 30–33 (2016).
- B.C. Smith, Spectroscopy31(3), 34–37 (2016).
- R. Morrison and R. Boyd, Organic Chemistry, 6th Edition (Prentice Hall, Englewood Cliffs, New Jersey, 1992).
- B.C. Smith, Spectroscopy31(5), 36–39 (2016).
- B.C. Smith, Spectroscopy30(1), 16–23 (2015).
- B.C. Smith, Spectroscopy30(4), 18–23 (2015).
- B.C. Smith, Spectroscopy31(7), 30–34 (2016).

Brian C. Smith, PhD, is a Senior Infrared Product Specialist for PerkinElmer, based in San Jose, California. Before joining PerkinElmer, he ran his own FT-IR training and consulting business for more than 20 years, and taught thousands of people around the world how to improve their FT-IR analyses and interpret infrared spectra. Dr. Smith has written three books on infrared spectroscopy: Fundamentals of FTIR and Infrared Spectral Interpretation, both published by CRC Press, and Quantitative Spectroscopy: Theory and Practice published by Academic Press. He has published a number of papers in peer-reviewed journals and is a co-inventor on a patent for an FT-IR method to monitor dust exposure in coal mines.

AI Shakes Up Spectroscopy as New Tools Reveal the Secret Life of Molecules
April 14th 2025A leading-edge review led by researchers at Oak Ridge National Laboratory and MIT explores how artificial intelligence is revolutionizing the study of molecular vibrations and phonon dynamics. From infrared and Raman spectroscopy to neutron and X-ray scattering, AI is transforming how scientists interpret vibrational spectra and predict material behaviors.
Real-Time Battery Health Tracking Using Fiber-Optic Sensors
April 9th 2025A new study by researchers from Palo Alto Research Center (PARC, a Xerox Company) and LG Chem Power presents a novel method for real-time battery monitoring using embedded fiber-optic sensors. This approach enhances state-of-charge (SOC) and state-of-health (SOH) estimations, potentially improving the efficiency and lifespan of lithium-ion batteries in electric vehicles (xEVs).
New Study Provides Insights into Chiral Smectic Phases
March 31st 2025Researchers from the Institute of Nuclear Physics Polish Academy of Sciences have unveiled new insights into the molecular arrangement of the 7HH6 compound’s smectic phases using X-ray diffraction (XRD) and infrared (IR) spectroscopy.