Raman Spectroscopy for Cancer Diagnosis
November 2006. Raman spectroscopy is a promising new tool for noninvasive, real-time diagnosis of tissue abnormalities. Here, we show evidence of its application for cancer diagnosis in four distinct tissue types: skin, breast, gastrointestinal tract, and cervix. Multivariate statistical analysis and discrimination algorithms allow for automated classification of the spectra into clinically relevant pathological categories using histology as a gold standard. Although limitations exist, the technique shows every indication of being an exciting prospect in the management of cancer in a clinical setting.

Raman spectroscopy is a promising new tool for noninvasive, real-time diagnosis of tissue abnormalities. Here, we show evidence of its application for cancer diagnosis in four distinct tissue types: skin, breast, gastrointestinal tract, and cervix. Multivariate statistical analysis and discrimination algorithms allow for automated classification of the spectra into clinically relevant pathological categories using histology as a gold standard. Although limitations exist, the technique shows every indication of being an exciting prospect in the management of cancer in a clinical setting.
Optical spectroscopy has been around for many years and traditionally has been applied to a number of diverse fields, including analytical chemistry, geology, and even art history. Over the past 20–25 years, the use of optical spectroscopy for biomedical applications has grown significantly. Its attractiveness comes from its ability to provide quantitative information about the biochemical and morphological states of tissue in a minimally invasive or noninvasive manner. Spectra typically are collected with fiber-optic probes and charge-coupled device (CCD) cameras, and diagnostic algorithms have been developed to discriminate between different categories of tissue. Of the many optical spectroscopic techniques, fluorescence spectroscopy was one of the first to be developed as a diagnostic tool for a variety of diseases including cancers and plaques, as well as other conditions such as burns. However, although fluorescence spectroscopy can differentiate between normal tissue and disease (cancer) successfully, it suffers from a lack of specificity when differentiating between multiple nonnormal groups. Diffuse reflectance spectroscopy provides valuable structural information by determining tissue optical properties. The lack of information regarding tissue biochemistry makes this method generally insufficient by itself for tissue diagnosis. In recent years, Raman spectroscopy has garnered a great deal of interest in disease diagnosis, particularly cancer, because of its ability to provide molecular specific information about tissues.
Raman Spectroscopy
Raman scattering is an inelastic scattering process that occurs when an electron enters a virtual excited state due to an incident photon, then falls back to a higher or lower vibrational energy level with accompanying release of a new photon. The energy transfer is proportional to a specific vibrational mode of the molecule, so Raman spectra are independent of excitation wavelength, and the change in energy between the incident and released photon is displayed as relative wavenumbers (1/wavelength). Raman spectral peaks tend to be narrow, particularly in the fingerprint region of about 700–2000 cm–1 , and each peak can be associated with specific vibrations in molecular bonds. Thus, this technique provides biochemical information about a sample, including conformations and concentrations of constituents with the level of detail that is determined by the instrumentation and the need of the application (1).
Over the years, different forms of Raman spectroscopy have been developed and used for biological applications. The earliest of these is Fourier transform (FT)–Raman spectroscopy, a method that measures Raman spectra with high signal-to-noise ratio (S/N) and minimal fluorescence interference and has been used for many in vitro applications. The typically long integration times and bulky instrumentation negate this technique for in vivo use. Ultraviolet resonance Raman (UVRR) spectroscopy can be used to target specific molecules by selecting excitation wavelength at their resonance, thus yielding strong Raman signals. The high excitation intensities and mutagenicity of UV light prevent the application of this technique for in vivo use. Surface-enhanced Raman spectroscopy (SERS) is an excellent technique that can detect molecular signatures in trace amounts and has been pursued for such applications as biochips. However, the use of silver and other such elements for enhancement prevents its implementation in vivo. Thus, near-infrared (NIR) dispersive Raman spectroscopy, in which NIR excitation minimizes fluorescence and absorption by tissue, has been the technique of choice for in vivo applications (1).
Instrumentation for Tissue Raman
A typical system for measuring macroscopic Raman spectra of tissue, particularly in vivo, consists of a laser source for illumination, a fiber-optic probe to deliver the laser light and collect the Raman-scattered light while rejecting the laser line and Rayleigh-scattered light, and a spectrograph and CCD to record the spectra. An example of such a system is shown in Figure 1. Early attempts at measuring Raman spectra of tissue were difficult because of the fluorescent nature of tissue and limitations of sources and detectors. Over the last several years, powerful, stable diode lasers emitting NIR light have become prevalent. These sources are ideal for clinical use because they are easily portable and are available at wavelengths in the "optical window" of tissue, such as 785 nm and 830 nm, at which they generate minimal background fluorescence while penetrating fairly deeply into tissue. On the detection end, high-throughput spectrographs designed specifically for NIR-Raman spectroscopy are now readily available. Silicon-based CCD detectors have made great strides as well. Back-illuminated, deep-depletion CCDs that avoid etaloning allow high-resolution Raman spectra to be gathered with short (<5 s) integration times. Recent developments in cooling technology have led to the development of thermoelectrically cooled detectors that can be operated at temperatures below –80 °C rather than using liquid nitrogen — again aiding portability. With the rise in the availability of handheld spectrometers, the Raman industry also has seen the development of handheld Raman spectrometers. While successful in manufacturing and industrial applications, these systems still suffer from high noise characteristics and lack of cooling, preventing their use for in vivo tissue applications.
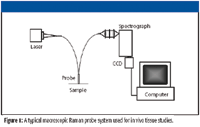
Figure 1
Most in vivo Raman applications rely on fused silica–based optical fibers for remote sensing. However, the fibers themselves have a Raman signal, so this signal must be minimized using appropriate filters. A bandpass filter between the delivery fiber and sample prevents Raman-scattered light from illuminating the sample, while a longpass or notch filter between the sample and collection fibers prevents reflected laser light and Rayleigh-scattered light from entering the collection leg and generating additional Raman signal (Figure 2). Based upon this fundamental concept, a number of different fiber-optic probe designs have been implemented for in vivo Raman studies. Each of these designs is optimized for increased S/N, targeted interrogation, and minimal background signal from within the probe. Some of these designs include obliquely polished fiber tips to increase the area of excitation and collection overlap, attaching a ball lens to the tip of the fibers to increase overlap or change the depth of focus, and side-firing fibers to get 360° of coverage (2). Some of these probes were developed by academic institutions. There also exist numerous commercial Raman fiber probes. However, these probes typically are designed for industrial applications and are not suitable for use on tissue. Thus, most in vivo probes are custom designed and built in-house or special ordered.

Figure 2
Much of the discussion to this point has been focused on macroscopic or volumetric measurement of Raman signals from tissue. Recently, there has been much interest in obtaining depth-resolved Raman signals from tissues where discrimination could be improved by filtering out signatures from above or below the lesion. One way to obtain depth resolution is with a confocal setup, in which a pinhole (or a fiber) is used to reject out-of-focus light, allowing for depth separation. One such design is shown in Figure 3. In fact, confocality for Raman spectroscopy typically is incorporated in a microscope setting. These systems provide excellent spatial resolution and are used for biochemical mapping and spectral characterization of tissues. Although some of these systems have been used to obtain tissue spectra from easily accessible areas of the skin, there is a need for compact handheld confocal probes for routine clinical use. Recent studies have demonstrated other methods for depth resolution such as Kerr-gated (3), spatially offset (4), and polarized (5) Raman spectroscopy. These methods show much promise for biomedical applications and will be worth tracking in coming years.
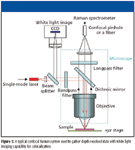
Figure 3
In all tissue Raman applications, various data-processing steps must be followed to extract the tissue Raman signal from the raw measured spectra (Figure 4). These include system calibration, fluorescence background subtraction, and noise smoothing. Perhaps the most challenging of these is the problem of fluorescence, the primary reason that most researchers in the field have moved to the NIR wavelengths. Current methods rely on mathematical techniques such as the use of second derivatives, Fourier filtering, and polynomial fitting (1) to remove the fluorescence background. Once Raman spectra are extracted, classification algorithms are developed using a variety of multivariate statistical methods such as linear and nonlinear discrimination analysis, neural networks, genetic algorithms, and cluster analysis. The goal in each case is to obtain high sensitivity and specificity in the recognition of a target condition amidst a variety of tissue categories depending upon the application at hand.
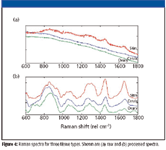
Figure 4
Raman for Cancer Diagnosis
The phenomenon of Raman spectroscopy makes it ideal for probing tissue because numerous biological molecules undergo some Raman scattering, allowing one to recognize subtle changes in tissue biochemistry. Many biomedical applications of Raman spectroscopy exist today, including characterization of human atherosclerotic plaque (6), evaluation of skin composition (7), quantification of blood analytes (such as glucose, cholesterol, and urea) (8), estimation of secondary protein structures (9), and cell viability after exposure to toxic agents (10). Raman spectroscopy is particularly suited for diagnosing cancer because of its sensitivity in detecting small molecular changes that are associated with cancer, such as an increased nucleus-to-cytoplasm ratio, disordered chromatin, higher metabolic activity, and changes in lipid and protein levels (11) (Figure 5). Many researchers and clinicians believe that Raman spectroscopy can thus provide real-time, noninvasive or minimally invasive, differential diagnosis of cancer. As a result, there has been a concerted effort in applying Raman spectroscopy for the diagnosis of cancers in the skin, breast, gastrointestinal tract, and cervix, among others (1).
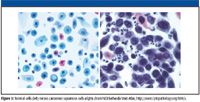
Figure 5
Skin
Human skin, because of its ease of access, has been studied a great deal with Raman spectroscopy. Skin cancer is the most prevalent cancer in the United States, with over 1 million new cases each year (12), so there is great interest in being able to detect a skin neoplasm in real time and to remove the lesion in the same visit. Basal cell carcinoma (BCC) and squamous cell carcinoma (SCC) are by far the most prevalent types, while melanoma is the deadliest (12).
Early in vitro studies of skin applied FT-Raman methods to examine skin structure, especially for characterizing lipids and proteins of the skin. NIR FT-Raman was used by Gniadecka and colleagues (13) to determine that similar skin lesions showed similar molecular structures of lipids and proteins and to discriminate BCC from normal tissue. They found significant spectral differences at a number of peaks, including the amide I (1660 cm–1), amide III (1220–1300 cm–1), and lipid (1450 cm–1) peaks.
Because the instrumentation for FT-Raman spectroscopy prevents its use in a clinical setting, a more recent in vitro study by Puppels and colleagues used traditional NIR Raman spectroscopy to delineate BCC margins by producing two-dimensional pseudocolor Raman images. Using multivariate methods such as cluster analysis and logistic regression, an algorithm was developed to separate normal from BCC with 100% sensitivity (14). Sensitivity is a measure of the ability to correctly detect disease and is defined as the number of true positives divided by the total number of positives. Several other groups have used Raman spectra in combination with other techniques to enhance discrimination between normal and cancerous skin. Huang and colleagues (15) used autofluorescence and Raman in a murine model in diagnosing malignancy. Using neural networks, Wulf and colleagues (16) were successful in diagnosing BCC and melanomas from normal in 222 total cases.
Because the skin is a stratified tissue, a major goal for dermatological applications is depth sensitivity. To this end, several groups have applied confocal Raman spectroscopy or Raman microspectroscopy to gather data from only a thin layer of the skin at a time. Such a technique was applied successfully in vivo by Puppels and colleagues (17), not for cancer, but to determine molecular concentration profiles, especially of water and other components such as natural moisturizing factor, with 5-μm axial resolution for applications such as cosmetics (now as a commercial entity known as River Diagnostics).
Confocal Raman microscopy has been used to discriminate between normal and cancerous skin as well. Choi and colleagues (18) applied confocal Raman to 10 BCC samples with surrounding normal tissue and measured them at a series of depths. Differences seen in the amide I band and the PO2 symmetric stretching band allowed discrimination between tissue types that correlated well with histopathology. Both in vitro and in vivo studies have been done on skin by Lieber and colleagues (19) at Vanderbilt University (Nashville, Tennessee). Based upon the success of the in vitro study, a handheld version of the confocal system (shown in Figure 3) was built and applied in vivo in a pilot study, focusing on the diagnosis of BCC, SCC, and nonnormal benign tissues. If the spectra of each pathology were first corrected by subtracting the paired normal spectra, classification of BCC, SCC, and inflammation was 100% accurate. However, there is a need for independent validation before such techniques can be applied toward routine clinical care.
Breast
Because it is the most common cancer in women, several groups have examined Raman spectroscopy for rapid breast cancer diagnosis. Infiltrating ductal carcinoma (IDC) is the most common malignancy, so it has been a prominent condition to study. There also has been much interest in lobular carcinoma and benign or precancerous conditions like fibrosis, cyst formation, and ductal carcinoma in situ (DCIS) (1).
Alfano and colleagues (20) were the first to look at the ability of Raman spectroscopy to distinguish normal from malignant breast tissue. Later, Redd and colleagues (21) demonstrated the advantages of NIR excitation particularly in the context of breast cancer. Although no rigorous algorithm was attempted, they saw results similar to those of Alfano — namely, a decrease in lipid contributions to spectra from IDC samples, as well as an increase in the collagen contributions in benign and malignant samples. More recently, Feld and colleagues (22) have done extensive work on using Raman spectroscopy for breast cancer diagnosis. An early study showed comparable spectra, but multivariate statistical algorithms improved diagnosis (22). Over the past several years, this group has developed a system that classifies breast Raman spectra according to the modeled contributions of individual component spectra from materials like fat, collagen, and DNA to discriminate malignant from normal and benign tissues with 94% sensitivity and 96% specificity (23). Specificity indicates the ability to correctly recognize normal tissue and is defined as the number of true negatives divided by the total number of negatives.
Gastrointestinal Tract
Stone and colleagues (24) have used NIR Raman spectroscopy to extensively classify many types of epithelial tissue from the gastrointestinal tract, including larynx, tonsil, esophagus, stomach, bladder, and prostate. The spectra were classified into three to eight groups depending upon tissue type, including normal, precancerous, and varying grades of cancer, using principal components analysis and a linear discriminant function. The sensitivities ranged from 73% to 100%, and the specificities from 92% to 100%. In a more recent study, Shetty and colleagues (25) used Raman spectral mapping to identify biochemical changes among normal tissue, Barrett's esophagus, and esophageal cancer. They noted differences in the distributions of DNA, lipid, glycogen, and protein that could be the basis for future diagnostic applications.
Molckovsky and colleagues (26) assessed the potential of using NIR Raman spectroscopy in the colon to distinguish between two types of polyps: adenomatous and hyperplastic. Both in vivo and ex vivo spectra were collected using a probe-based system, and multivariate statistical techniques were used to classify the colon polyps. The different polyps were classified with 100% sensitivity and 89% specificity. Sterenborg and colleagues (27) have used Raman spectroscopy, in conjunction with autofluorescence, for diagnosing human oral mucosa lesions. Cluster analysis was used to find a relationship between spectral shape and lesion type, but the differences between lesion types were not found to be significant in this study.
Cervix
The cervix is another organ that is easily accessible, and early precancerous stages in the cervix are detectible due to the routine gynecological exam most women in the Western world undergo. Cervical precancers are very common in women, due to the prevalence of the human papilloma virus (HPV), a condition known to be linked with cancer. Cervical cancer is the second most common malignancy in women worldwide, but also the most treatable one if detected early. Thus, many researchers have pursued optical methods as a diagnostic tool, including the application of Raman spectroscopy.
Mahadevan-Jansen and colleagues (28) were the first to report the application of Raman spectroscopy in vivo in human patients in an organ within the body (such as the cervix). This in vivo study demonstrated the applicability and potential of Raman spectroscopy for detecting cervical precancers with high sensitivity as well specificity. In a subsequent study, in which 24 measurements were collected before cervical biopsy, Raman spectra were used to separate high-grade dysplasia from all other pathologies, and only one location was misclassified (29).
The most extensive work on the potential of Raman spectroscopy for cervical disease has been done by Robichaux-Viehoever and colleagues (30) at Vanderbilt University. Raman measurements were taken from both normal and abnormal areas on 79 patients. Logistic regression discrimination algorithms were developed to distinguish between high-grade dysplasia and benign areas of the cervix with a sensitivity of 89%. More particularly, variability among the spectra from the same tissue type between patients and within the same patient was a major problem. Some of the factors considered were menopausal status, smoking history, and overall patient diagnosis. Significant differences were found between pre- and postmenopausal women, and significant differences also exist between normal spectra from normal patients compared with normal spectra from patients with dysplasia (30).
Toward Translation Into a Clinical Setting
Several other cancers also have been studied with Raman spectroscopy, such as those in the ovary, brain, and lung, with similar results. Thus, many researchers have applied NIR Raman spectroscopy in vitro, ex vivo as well as in vivo for the diagnosis of cancer with varying degrees of success. Despite this research for more than 20 years, the technique has not been incorporated into routine clinical care for several reasons. There is a continued tendency by researchers to use empirical or several different classification techniques after many spectra are recorded demonstrating varying degrees of success. But for successful widespread implementation, a robust, multiclass discrimination algorithm is needed. Perhaps the single most critical need that will lead to the applicability of this technique in a real-time diagnostic setting is one of independent validation via large clinical trials. The inherent intrapatient as well as interpatient variability in the spectra is a limitation that confounds the development of these algorithms and thus, implementation of clinical trials. Raman instruments with the sensitivity for in vivo application must be assembled for implementation because there are few suitable commercial instruments available. Interest by companies to commercialize the technique would facilitate great strides in solving many of these problems.
There is every indication that Raman spectroscopy is poised to follow through on its potential to provide real-time, noninvasive, automated diagnosis of various cancers. Although the process of developing automated classification algorithms has proven arduous, new cutting-edge classification algorithms suggest that, with enough data, this type of diagnosis will soon be possible. Some groups have begun to undertake large-scale validation studies, although most of these are conducted by or with the help of industry. Researchers also are beginning to understand the biological basis of Raman spectral differences between normal and cancerous tissues with the help of techniques like spectral mapping and using tissue model systems. This would not only further the diagnosis of the disease but also would enable improved understanding of the underlying biochemistry associated with the progression of cancer.
Although the end goal of Raman spectroscopy being used routinely in the operating room and the doctor's office is still a few years away, clinical studies at medical centers around the world have shown promise, and exciting new discoveries like improved algorithms and reliable tissue model systems can only help. Early detection of cancer and delineation of tumor boundaries are critical in patient care. Raman spectroscopy is a tool that provides the information necessary to make a difference toward this process.
Matthew D. Keller, Elizabeth M. Kanter, and Anita Mahadevan-Jansen are with the Department of Biomedical Engineering, Vanderbilt University, Nashville, Tennessee.
References
(1) A. Mahadevan-Jansen, in Biomedical Photonics Handbook, T. Vo-Dinh, Ed. (CRC Press, Washington DC, 2003), pp. 30:1–30:27.
(2) U. Utzinger and R.R. Richards-Kortum, J. Biomed. Opt. 8, 121–147 (2003).
(3) M.C. Prieto, P. Matousek, M. Towrie, A.W. Parker, M. Wright, A.W. Ritchie, and N. Stone, J. Biomed. Opt. 10, 44006 (2005).
(4) P. Matousek, I.P. Clark, E.R. Draper, M.D. Morris, A.E. Goodship, N. Everall, M. Towrie, W.F. Finney, and A.W. Parker, Appl. Spectrosc. 59, 393–400 (2005).
(5) Z.J. Smith and A.J. Berger, Opt. Lett. 30, 1363–1365 (2005).
(6) J.T. Motz, M. Fitzmaurice, A. Miller, S.J. Gandhi, A.S. Haka, L.H. Galindo, R.R. Dasari, J.R. Kramer, and M.S. Feld, J. Biomed. Opt. 11, 021003 (2006).
(7) I.V. Ermakov, M.R. Ermakova, W. Gellermann, and J. Lademann, J. Biomed. Opt. 9, 332–338 (2004).
(8) A. Berger, T. Koo, I. Itzkan, G. Horowitz, and M.S. Feld, Applied Optics 38, 2916–2926 (1999).
(9) C. Huang, G. Balakrishnan, and T. Spiro, Journal of Raman Spectroscopy 37, 277–282 (2006).
(10) I. Notingher, J. Selvakumaran, and L. Hench, Biosensors and Bioelectronics 20, 780–789 (2004).
(11) A. Mahadevan-Jansen and R. Richards-Kortum, J. Biomed. Opt. 1, 31–70 (1996).
(12) Cancer Facts and Figures (American Cancer Society, Atlanta, 2006).
(13) M. Gniadecka, H.C. Wulf, O.F. Nielsen, D.H. Christensen, and J. Hercogova, Photochem. Photobiol. 66, 418–423 (1997).
(14) A. Nijssen, T.C. Bakker Schut, F. Heule, P.J. Caspers, D.P. Hayes, M.H. Neumann, and G.J. Puppels, J. Invest. Dermatol. 119, 64–69 (2002).
(15) Z. Huang, H. Lui, D.I. McLean, M. Korbelik, and H. Zeng, Photochem. Photobiol. 81, 1219–1226 (2005).
(16) S. Sigurdsson, P.A. Philipsen, L.K. Hansen, J. Larsen, M. Gniadecka, and H.C. Wulf, IEEE Trans. Biomed. Eng. 51, 1784–1793 (2004).
(17) P.J. Caspers, G.W. Lucassen, and G.J. Puppels, Biophys. J. 85, 572–580 (2003).
(18) J. Choi, J. Choo, H. Chung, D.G. Gweon, J. Park, H.J. Kim, S. Park, and C.H. Oh, Biopolymers 77, 264–272 (2005).
(19) C.A. Lieber, PhD dissertation, Vanderbilt University (2005).
(20) R.R. Alfano, A. Pradhan, G.C. Tang, and S.J. Wahl, J. Opt. Soc. Am. B 6, 1015–1023 (1989).
(21) C.J. Frank, R.L. McCreery, and D.C. Redd, Anal. Chem. 67, 777–783 (1995).
(22) R. Manoharan, K. Shafer, L. Perelman, J. Wu, K. Chen, G. Deinum, M. Fitzmaurice, J. Myles, J. Crowe, R.R. Dasari, and M.S. Feld, Photochem. Photobiol. 67, 15–22 (1998).
(23) A.S. Haka, K.E. Shafer-Peltier, M. Fitzmaurice, J. Crowe, R.R. Dasari, and M.S. Feld, Proc. Natl. Acad. Sci. USA 102, 12371–12376 (2005).
(24) N. Stone, C. Kendall, N. Shepherd, P. Crow, and H. Barr, Journal of Raman Spectroscopy 33, 564–573 (2002).
(25) G. Shetty, C. Kendall, N. Shepherd, N. Stone, and H. Barr, Br. J. Cancer 94, 1460–1464 (2006).
(26) A. Molckovsky, L.M. Song, M.G. Shim, N.E. Marcon, and B.C. Wilson, Gastrointest. Endosc. 57, 396–402 (2003).
(27) D.C. de Veld, T.C. Bakker Schut, M. Skurichina, M.J. Witjes, J.E. Van der Wal, J.L. Roodenburg, and H.J. Sterenborg, Lasers Med. Sci. 19, 203–209 (2005).
(28) A. Mahadevan-Jansen, M.F. Mitchell, N. Ramanujam, A. Malpica, S. Thomsen, U. Utzinger, and R. Richards-Kortum, Photochem. Photobiol. 68, 123–132 (1998).
(29)U. Utzinger, Applied Spectroscopy 55, 955–959 (2001).
(30)A. Robichaux-Viehoever, PhD dissertation, Vanderbilt University (2002).

AI-Powered SERS Spectroscopy Breakthrough Boosts Safety of Medicinal Food Products
April 16th 2025A new deep learning-enhanced spectroscopic platform—SERSome—developed by researchers in China and Finland, identifies medicinal and edible homologs (MEHs) with 98% accuracy. This innovation could revolutionize safety and quality control in the growing MEH market.
New Raman Spectroscopy Method Enhances Real-Time Monitoring Across Fermentation Processes
April 15th 2025Researchers at Delft University of Technology have developed a novel method using single compound spectra to enhance the transferability and accuracy of Raman spectroscopy models for real-time fermentation monitoring.
Nanometer-Scale Studies Using Tip Enhanced Raman Spectroscopy
February 8th 2013Volker Deckert, the winner of the 2013 Charles Mann Award, is advancing the use of tip enhanced Raman spectroscopy (TERS) to push the lateral resolution of vibrational spectroscopy well below the Abbe limit, to achieve single-molecule sensitivity. Because the tip can be moved with sub-nanometer precision, structural information with unmatched spatial resolution can be achieved without the need of specific labels.