Raman Spectroscopy for Identification of Contaminant Materials in Pharmaceuticals
Special Issues
Raman spectroscopy is particularly useful for identification of contaminant materials in pharmaceuticals because it can very clearly and nondestructively identify materials. Raman spectroscopy can be used to identify foreign matter on tablets as well as the individual tablet materials to confirm the material’s legitimacy. For injectable drug vials, Raman spectroscopy can be used with microscopy to count, size, and identify particulate contamination found in such vials. Spectral interpretation is key to the value of Raman spectroscopy, and it is important for accuracy of identification not to simply rely on library match values.
Raman spectroscopy is particularly useful for identification of contaminant materials in pharmaceuticals because it can very clearly and nondestructively identify materials. Raman spectroscopy can be used to identify foreign matter on tablets as well as the individual tablet materials to confirm the material’s legitimacy. For injectable drug vials, Raman spectroscopy can be used with microscopy to count, size, and identify particulate contamination found in such vials. Spectral interpretation is key to the value of Raman spectroscopy, and it is important for accuracy of identification not to simply rely on library match values.
Particulate matter in parenteral (parenteral is defined as administered or occurring elsewhere in the body than the mouth and alimentary canal) pharmaceutical drug products represents a potentially life-threatening health hazard (1). Good quality of pharmaceuticals requires understanding and controlling particulate matter contamination (2,3). The draft of United States Pharmacopeia (USP) <1790> focuses on detection and removal of product units that show evidence of visible particles. “No inspection process, manual or automated, can guarantee complete removal of all visible particulate matter or other visible defects; thus, prevention of such defects is an important consideration” (4). Prevention crucially relies on identification to determine the particles’ source, and Raman spectroscopy is very well suited for identifying these particles.
Though microscopy can be used to distinguish synthetic polymer fibers from cellulose fibers, Raman microspectroscopy additionally provides specific identification of polymers, as well as dyes in the fibers, therefore, determining the sources can be more easily accomplished. In addition, Raman can identify coatings on particles and the particles themselves. Raman microspectroscopy can also identify contaminants on tablets, as well as the tablet materials to confirm the tablet’s legitimacy. For injectable drugâfilled vials, Raman spectroscopy can be used with microscopy to count, size, and identify particulate contamination found in such vials. These identifications are useful for determining product quality and improving processing. It is important to make sure that the spectra are properly taken, the advantages and limitations of the technique are well understood, and that the spectral interpretation is done correctly, not always merely relying on library match values for identification.
Materials and Methods
Samples were prepared in a laminar flow biohazard hood (Heraeus Herasafe Kendro HS12 Type A/B3 Class II clean bench). Some large, visible particles were removed with cleaned probes. Other samples with subvisible particles or many particles in liquids were filtered onto gold-coated filters (rap.ID GmbH) for direct analysis. The gold substrate is particularly good for Raman spectroscopy because of its reflectance and lack of interference in the spectra of the samples. Raman and laser-induced breakdown spectroscopy (LIBS) analyses were done with the single particle explorer (SPE) l s metal.ID + raman.ID system (manufactured by rap.ID Particle Systems GmbH). For Raman, a 785-nm laser with â¤50 mW power was used with a spectral range of 300â2000 cm-1 and 5 cm-1 resolution. For LIBS, the pulsed laser was set for 100 µJ and 3 ns. The spectral resolution was 1 nm, and the range was 350â800 nm. Standard libraries and Pearson’s algorithm were used for spectral identification.
Results and Discussion
Microscopy has long been used for particle identification because many particles have specific microscopic characteristics. For example, cellulose fibers can be from paper or fabric, each with specific properties under the microscope. Paper fibers can be classified as hardwoods or softwoods using polarized light microscopy. The typical shape of a cotton fiber is a flattened, twisted ribbon, with a thin outer skin called a cuticle, a thicker secondary wall, and a hollow core called a lumen (5). Raman can confirm the identity of these as cellulose and can also determine pigments. Heliogen blue (BASF) is a common pigment in cellulose particles found in parenterals. It is Cu-phthalocyanine and has many aromatic functional groups to which Raman is highly sensitive because of resonance. Because of the difference in sensitivities to the dye compared to the cellulose, in some cases the dye spectrum is all that is detected. Figure 1 shows two cellulose particles and their Raman spectra. Though one particle has dye in it, the color is hard to visualize, but it is clear from the Raman spectrum.
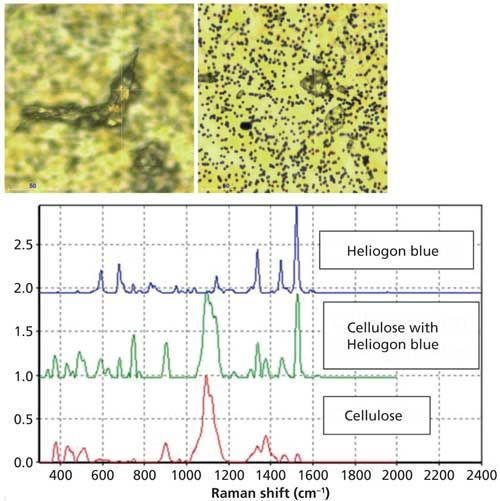
Figure 1: Microscope images and associated Raman spectra of cellulose particles. Left: particle without dye, right: particle with dye. The red spectrum is from the cellulose particle, the green spectrum is from the cellulose particle with dye, and the blue spectrum is the library spectrum of Heliogen blue. (The spectra are offset for clarity.)
Synthetic particles and fibers are more difficult to distinguish by microscopy alone, and Raman spectroscopy can easily distinguish these. Figure 2 shows images of a cellulose fiber and three synthetic fibers. The cellulose fiber has the “twisted ribbon” characteristics of a cellulose fiber, but the synthetic fibers all appear smooth. Raman spectroscopy can easily distinguish these fibers as polyethylene terephthalate (PET), polypropylene (PP), and polystyrene (PS). PET is used as thread in the synthetic protective clothing for people including lab coats, bonnets, and shoe covers. PP is often the fabric of the protective clothing.
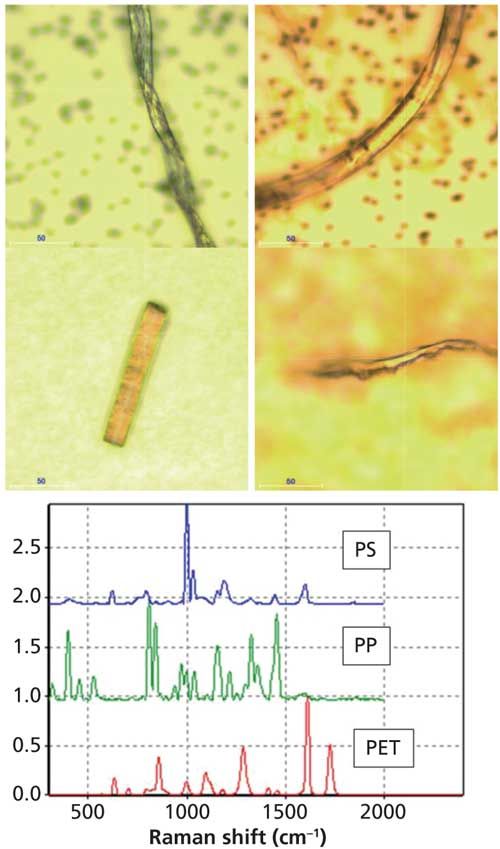
Figure 2: Microscope images and associated Raman spectra of fibers. Top left: cellulose, top right: polyethylene terephthalate (PET), bottom left: polypropylene (PP), bottom right: polystyrene (PS). Raman spectra: polystyrene (blue spectrum), polypropylene (green spectrum), and polyethylene terephthalate (red spectrum). (The spectra are offset for clarity.)
Some fibers and particles can be glass. The image of the fiber in Figure 3 also appears to be synthetic, but its Raman spectrum shows it to be glass. However, there can be many sources of glass in pharmaceutical processing. For example, glass flakes can come from vial delamination, whereas fibers can come from insulation around the plant, or belts involved in processing. Though Raman can identify particles as glass, LIBS is particularly effective in determining the source of glass because it can determine the elemental composition. In this case, using the SPE instrument, LIBS can be done on the particle immediately after the Raman spectrum is taken, and in this case the elemental content was determined to be calcium with a little sodium. This could be compared to spectra taken from possible sources to determine the source.
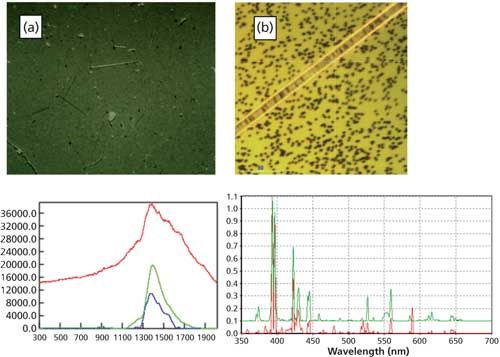
Figure 3: (a) Image of particles on a filter. (b) Image of one of the particles transferred to a gold-coated filter. Lower left: Raman spectrum of the sample (red spectrum: raw data; blue spectrum: baseline corrected raw data), green line: database reference spectrum of glass. Lower right: LIBS spectrum of the sample (red spectrum) and Ca spectrum (green spectrum). (The LIBS spectra are offset for clarity.)
Some polymers have very similar spectra to others. The spectrum of the particle in Figure 4 was searched in a spectral library, and had a rank of 841 out of 1000, which is a reasonable value for a good library match. The 1716 cm-1 C=O stretching band in the sample spectrum was close to the 1727 cm-1 band in the library spectrum of PET, but polybutylene terephthalate has a band at 1716 cm-1, and it therefore is a closer match. This band could shift depending on the crystallinity of the material, so that possibility has to be taken under consideration. This illustrates that analysis of spectra must be done very carefully and the importance of band shifts and match values must be carefully considered. Raman bands can shift depending on how spectra are taken, the laser power, the time duration, the sample qualities, and whether there are contaminants. In some cases, an exact library match cannot be made, but the functional group identification can provide valuable information in solving the problems of possible sources of materials.
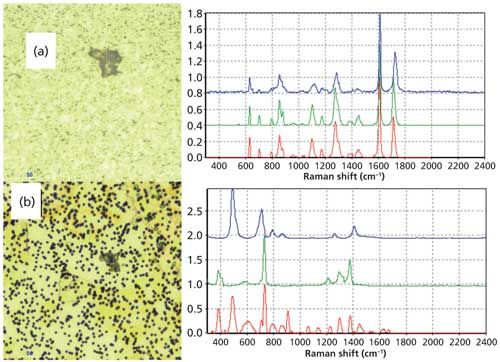
Figure 4: (a) Image and spectra of a particle from a pharmaceutical product. The spectra of the particle (red spectrum) are compared to two different library spectra of similar polymers. The green spectrum is of polybutylene terephthalate, and the blue spectrum is of polyethylene terephthalate. (The spectra are offset for clarity.) The sample has a band around 1716 cm-1, which is close to a band in the PET spectrum (1727 cm-1) but matches a band in the PBT spectrum (1716 cm-1). (The spectra are offset for clarity.) (b) Image and spectra of a particle from a pharmaceutical product. The spectrum of the particle (red spectrum) showed two materials, PTFE (green spectrum) and silicone (blue spectrum). (The spectra are offset for clarity.)
Often spectra of materials have poor library match values because there is more than one material in the analysis sample. The spectrum of the particle in Figure 5 showed two materials, silicone and polytetrafluoroethylene (PTFE). Searching the spectrum against a library would not show a good match value for either material, but clearly the bands correlate to the two materials. The presence of silicone on the PTFE indicates that the PTFE may be from a processing part that was lubricated with silicone, and this would give an idea about possible sources. Silicone is present in many places in materials in processing and packaging of pharmaceuticals, but its absence from the other particles and its presence with the PTFE particle indicates that these were together in the process.
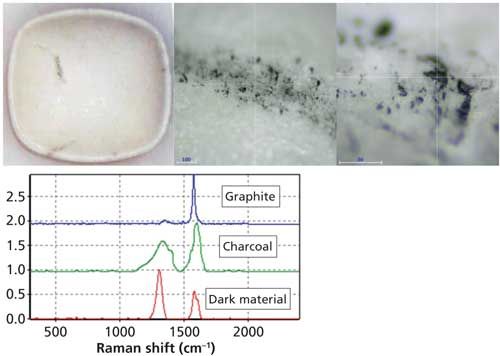
Figure 5: Images of dark material on a tablet. The Raman spectrum (red spectrum) indicated it was charcoal (charred organic material) (green spectrum) and not graphite (blue spectrum), metal, or dirty oil from the processing equipment. (The spectra are offset for clarity.)
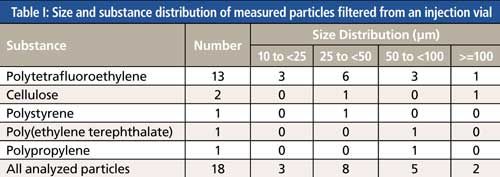
The U.S. Food and Drug Administration (FDA) requires visual inspection of all vials of injectables to ensure there are no visible particles. Particles that are visible are generally about 100 µm or larger, depending on the other dimensions, the refractive indices of the particles and the solution, and color. Those vials must be rejected, but companies that are interested in improving their products have them analyzed. A vial that was determined to have a visible particle was filtered onto a gold-coated filter for particle analysis. Two particles 100 µm or larger were detected as well as 16 other particles in the range of 10 to 100 µm (see Table I.) The counting and identity of these particles provides information about other contaminants. These could likely be in vials that were not analyzed. The smaller micro- and nanoparticles can cause immune responses and other damaging effects in patients. Sometimes there are thousands of particles in samples, and Raman spectroscopy can be used to analyze a good portion of these in a reasonable amount of time (6).
Raman is also very good at identifying materials on tablets. Because of the small laser spot, microscopic areas can be examined on a tablet surface. Figure 5 shows a tablet and the dark regions expanded. Raman spectroscopy of the dark area indicated charcoal, which is essentially charred organic material. The material was not as crystalline as graphite, so the source of charred organic could be confirmed. The dark material was also confirmed not to be metal or dirty oil from the processing equipment. Spectra of different areas of the tablet indicated cellulose, lactose, and active pharmaceutical ingredient, confirming the expected ingredients.
Conclusions
Raman spectroscopy was shown to be quite useful for the identification of contaminant materials in pharmaceuticals. Raman was able to identify cellulose and dye in cellulose and natural and synthetic fibers. Raman was also able to identify material as glass. LIBS analysis on the particle can be made without additional preparation and was able to identify the elements in the glass, which was very helpful in determining the source of the glass to eliminate it from future samples. Depending on the instrument and the sample preparation, Raman can be used to identify multiple particles from a vial, and along with microscopy, those particles can be counted and sized. Raman can be used for identification of materials on a tablet confirming it was not counterfeit, and for identification of a black contaminant as charred organic and not metal or dirty oil from the processing equipment. Raman was shown to be able to identify a silicone coating on a PTFE particle, which may be useful in finding the source of the particle. Accurate and quality spectral interpretation is very important for material identification. Identification of the materials is the first step to understanding the source.
References
- T. Tran, T.C. Kupiec, and L.A. Trissel, Int. J. Pharm. Compd.10, 3 (2006).
- T.A. Barber, Control of Particulate Matter Contamination in Healthcare Manufacturing (CRC Press, Boca Raton, Florida, 2000).
- S.E. Langille, PDA J. Pharm. Sci. Technol. 67(3), 86â200 (2013).
- United States Pharmacopeia General Chapter <1790>, “Visual Inspection Of Injections” (United States Pharmacopeial Convention, Rockville, Maryland).
- McCrone Atlas of Microscopic Particles, http://www.mccroneatlas.com/.
K.A. Lee, M. Lankers, and O. Valet, Drug Dev. Delivery, in press (2016).
Kathryn Lee is the Lab Head with rap.ID Inc., in Monmouth Junction, New Jersey. Markus Lankers is the President at rap.ID GmbH in Berlin, Germany. Oliver Valet is the Vice President at rap.ID GmbH. Justyna Cherris is a lab assistant at rap.ID GmbH. Direct correspondence to: Kathryn.Lee@rap-id.com

AI-Powered SERS Spectroscopy Breakthrough Boosts Safety of Medicinal Food Products
April 16th 2025A new deep learning-enhanced spectroscopic platform—SERSome—developed by researchers in China and Finland, identifies medicinal and edible homologs (MEHs) with 98% accuracy. This innovation could revolutionize safety and quality control in the growing MEH market.
New Raman Spectroscopy Method Enhances Real-Time Monitoring Across Fermentation Processes
April 15th 2025Researchers at Delft University of Technology have developed a novel method using single compound spectra to enhance the transferability and accuracy of Raman spectroscopy models for real-time fermentation monitoring.
Nanometer-Scale Studies Using Tip Enhanced Raman Spectroscopy
February 8th 2013Volker Deckert, the winner of the 2013 Charles Mann Award, is advancing the use of tip enhanced Raman spectroscopy (TERS) to push the lateral resolution of vibrational spectroscopy well below the Abbe limit, to achieve single-molecule sensitivity. Because the tip can be moved with sub-nanometer precision, structural information with unmatched spatial resolution can be achieved without the need of specific labels.