Raman Spectroscopy of Pharmaceutical Ingredients in a Humidity-Controlled Atmosphere
Special Issues
Full and detailed characterization of pharmaceutical formulations is required before the release of new drugs.
Full and detailed characterization of pharmaceutical formulations is required before the release of new drugs. Vibrational spectroscopy, and in particular Raman spectroscopy, provides quantities of valuable information about the structural properties of such formulations. Polymorphism is the perfect example of the benefit brought by Raman spectroscopy; being highly chemically selective, Raman might be used to check the presence of the desired (or undesired) form of the active ingredient. When exposed to warm and humid weather over time, ingredients may undergo changes in their hydration level. This can, of course, greatly affect the properties or efficiency of the drug. Raman spectroscopy, combined with a temperature and humidity controller can mimic such harsh conditions and can be used to monitor the properties of the different ingredients. For example, the hydration of anhydrous lactose was found to be incomplete after 24 h exposure to 95 °C. In addition, Raman mapping can be performed over time in such a controlled environment to effectively spatially monitor the kinetics of hydration of an active ingredient.
Before being introduced to the market, pharmaceutical products need to be fully analyzed; this includes detailed characterization of the active ingredient in terms of physical and structural properties. Active substances may exist as various polymorphic forms, or with different hydration levels, which may have an impact on the efficacy of the drug.
Characterization also involves stability studies of both the active substrate and the entire formulation. Several factors may affect the stability such as temperature, light, and humidity. The impact of the storage conditions of manufactured drugs must be thoroughly evaluated, considering that some tropical countries are constantly exposed to warm and humid weather, which may alter the dosage form over time.
Raman spectroscopy is commonly used in the investigation of pharmaceutical compounds, and its applications have been extensively reviewed (1).
Raman spectroscopy is highly chemically selective and offers the possibility to monitor the chemical and structural change of ingredients when exposed to harsh conditions. It can be combined with a temperature- and humidity-controlled cell to understand the modifications induced by environmental changes.
Raman Spectroscopy Applied to Polymorphism Characterization
Polymorphism expresses the possibility of a given material to exist as different forms of its crystalline structure. These different forms might be more or less stable at certain conditions of temperature and pressure. This is the case, for example, with quartz existing as α-quartz, which has a trigonal crystal system and is stable at room temperature, but undergoes a polymorphic change to obtain the β-quartz form at 570 °C with a hexagonal crystal system. This type of changes in the crystal symmetry and the unit cell will modify the resulting Raman spectrum.
Similarly, during the manufacturing of the active pharmaceutical ingredient (API), depending on the crystallization process, pseudo-polymorphs resulting from the hydration or solvation of the crystals can be formed. Various examples describe the use of Raman spectroscopy to study the hydration of crystalline structures (2–4), either in situ or in the dosage form, and for both qualitative and quantitative characterization.
Experimental
A LabRAM HR Evolution micro-Raman spectrometer from Horiba Scientific was used to perform the measurements, while the samples were maintained to a certain temperature and humidity level via the use of a commercially available humidity control cell from Linkam Scientific Instruments.
Approximately 100 mg of each sample (anhydrous lactose and theophylline) were loaded into a 6-mm-diameter crucible and set into the hermetically closed chamber of the cell. The humidity within the cell was raised to and maintained at 95% relative humidity (RH) to create favorable conditions for hydration and polymorph change, and the temperature was set constant at 25 °C.
The Raman spectra measurements were performed by focusing the laser through the glass window of the cell onto the powder.
- For the anhydrous lactose, a laser emitting at 785 nm was used, with a power applied to the sample of approximately 100 mW. The beam was focused via a ×50 long working distance (10.6 mm) objective. Spectral data were acquired using a dispersive grating of 300 gr/mm; during 15-s times two accumulations were obtained in the fingerprint range, that is, between 200 and 1700 cm-1, where the main spectral features of the lactose lie.
- For the theophylline, a laser emitting at 532 nm was used and focused through a ×10 objective. Approximately 100 mW was applied on the sample and the acquisition time per spectrum was 0.15 s. Data were acquired within the 150–3300 cm-1 range, using a dispersive grating of 300 gr/mm.
For the theophylline experiment, the mappings were performed using a XY moving stage, acquiring data every 20 µm in both the x and y axis. A macrospot of 20 µm2 was created via the use of fast rastering mirrors to enlarge the laser beam size and ensure that the overall area of the packed powder was fully covered.
Hydration of Anhydrous Lactose
Anhydrous lactose is often found as an inactive ingredient in different medications. It is particularly useful because it contains no water, which means that it will not react with medications that are sensitive to moisture.
Lactose also exists as a monohydrate form, which can behave differently from the anhydrous form when formulated with other ingredients. It is therefore important to understand the conditions at which anhydrous lactose converts into the monohydrated form. Anhydrous and monohydrate lactose have different Raman features as shown in Figure 1.
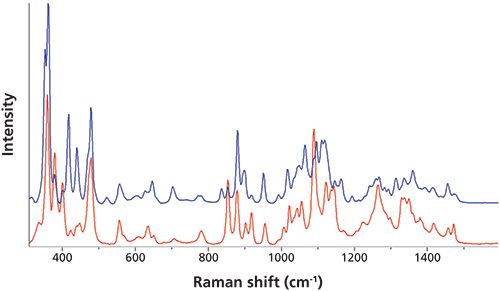
Figure 1: Raman spectra of anhydrous lactose (blue) and lactose monohydrate (red).
Anhydrous lactose was exposed during 24 h in the hermetic humidity controlled cell, set to a RH value of 95%, with a constant temperature of 25 °C. The spectra were measured every 1 min and the spectral features of the dataset were analyzed to determine if anhydrous lactose underwent changes.
The spectra of both pure anhydrous and monohydrate forms were used with the classical least squares (CLS) fitting algorithm to determine the proportion of each form during the experiment.
Figure 2 indicates that the anhydrous crystals gradually (and nonlinearly) absorb water to form the monohydrate form. After 24 h the transformation is incomplete, and provided that both pure spectra of anhydrous lactose and lactose monohydrate were acquired with the same measurement parameters as the dataset, it gives a fair estimate of the conversion to the monohydrate form.
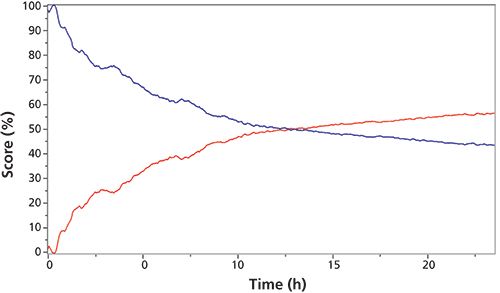
Figure 2: Scores (%) of anhydrous lactose (blue) and lactose monohydrate (red) obtained from CLS fitting, during a 24-h exposure of anhydrous lactose to a relative humidity of 95%.
Hydration of Theophylline
Theophylline, also known as 1,3-dimethylxanthine, is a methylxanthine drug used in therapy for respiratory diseases. As a member of the xanthine family, it bears structural and pharmacological similarity to caffeine.
Similar to lactose, theophylline exists in different forms: monohydrated, anhydrous I, and anhydrous II. The anhydrous II form is stable at room temperature, whereas anhydrous I isn't. The solubility, and consequently the bioavailability, of theophylline is affected by hydration, and it is thus of importance to understand the kinetics of hydration.
Anhydrous theophylline was placed in the moisture-controlled cell maintained at 25 °C and with a RH of 95% for 24 h. Figure 3 indicates that the anhydrous II and the monohydrated forms have rather different spectra, notably the peaks at 1166 and 1683 cm-1 are characteristic of the monohydrated form.
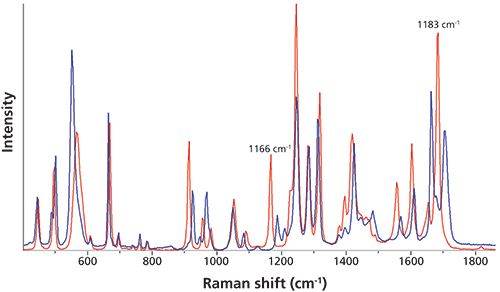
Figure 3: Raman spectra of the anhydrous (blue) and monohydrated (red) forms of theophylline.
Spectra were taken every 30 s, and the dataset was analyzed with the CLS fitting algorithm using both pure anhydrous II and monohydrate forms to evaluate the proportion of each form in each spectrum.
The profiles in Figure 4 suggest an instantaneous transformation of the anhydrous form after 6 h of exposure; however, this statement only applies within the few cubic micrometer sampling volume resulting from the microscope sampling geometry. For powders, made of grains varying in size and shape, such sampling is clearly not statistically viable, and the results in Figure 4 may not reflect the bulk behavior of the powder. To check if the conversion is homogeneous, various maps were taken in a repeated analysis of anhydrous theophylline submitted to a RH of 95%. An area of 1.6 × 1.6 mm of packed anhydrous powder in a crucible was mapped every 4 min over the 24-h experiment time. Each map comprised 400 data points, corresponding to a map size of 80 µm-the DuoScan macrospot option was used to match the laser spot size to this step, to ensure full coverage of the sample surface.
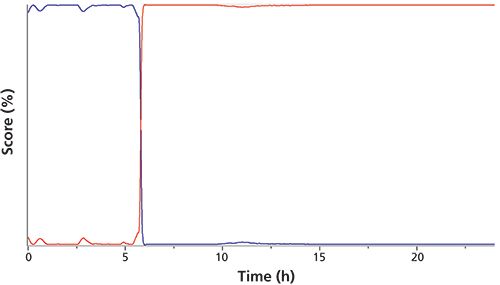
Figure 4: Scores (%) of anhydrous theophylline (blue) and theophylline monohydrate (red), obtained from CLS fitting, during a 24-h exposure of anhydrous theophylline to a relative humidity of 95%.
Spectral features of the monohydrate form were used to monitor its presence in each map.
The maps represented in Figure 5 reveal that the transformation to the monohydrated form is indeed not homogeneous over the whole area. Some spots start to convert after just a few hours and the conversion to monohydrate spreads out to the rest of the area from these starting points. The transformation to monohydrate is complete after the 24 h test.
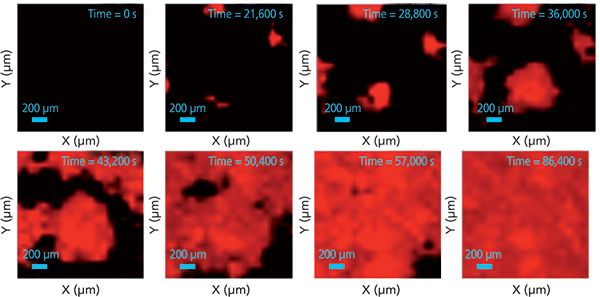
Figure 5: Raman images of the monohydrated form of the theophylline at different time of the exposure to 95% RH: 0 h, 6 h, 8 h, 10 h, 12 h, 14 h, 16 h, and 24 h.
By taking the average spectra of each mapped area, and applying the CLS fitting algorithm, it is then possible to plot the conversion to monohydrate form over time (Figure 6) in a more comprehensive and rigorous way than by analyzing one single spot (Figure 4).
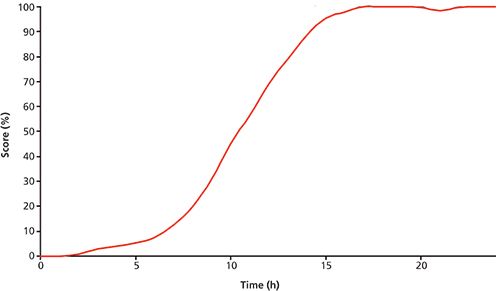
Figure 6: Scores (%) of the monohydrated form, obtained with the CLS fitting of the averaged spectra of each mapped area.
Conclusion
The combined use of Raman microspectroscopy and the controlled-humidity cell offers the possibility to accurately follow the structural changes of pharmaceutical substances when exposed to given environmental conditions (RH and temperature). Such capabilities allow not only monitoring of sample hydration (as in the case of lactose and theophylline discussed in this article), but also characterization of polymorphic or phase transitions, and swelling or degradation induced by moisture. The use of the cell is also compatible with Raman imaging, and thus is ideally suited for the analysis of heterogeneous samples, for example, structural modifications in dosage forms such as tablets.
Vincent Larat is a Raman application scientist with HORIBA Jobin Yvon S.A.S., in Villeneuve d'Ascq, France. Caroline Feltham is a scientist with Linkam Scientific Instruments Ltd., in Surrey, United Kingdom. Direct correspondence to: vincent.larat@horiba.com
References
(1) G. Fini, J. Raman Spectrosc. 35, 335 (2004).
(2) A. Amado, M. Nolasco, and P. Ribeiro-Claro, J. Pharm. Sci. 96, 1366–1379 (2007).
(3) H. Wikström, C. Kakidas, and L. Taylor, J. Pharm Biomed. Analysis 49, 247–252 (2009).
(4) P-F. Sung, Y-L. Hsieh, K. Angonese, D. Dunn, R. King, R. Machbitz, A. Christianson, W. Chappell, L. Taylor, and M. Harris, J. Pharm. Sci. 100, 2920–2934 (2011).

New Study Reveals Insights into Phenol’s Behavior in Ice
April 16th 2025A new study published in Spectrochimica Acta Part A by Dominik Heger and colleagues at Masaryk University reveals that phenol's photophysical properties change significantly when frozen, potentially enabling its breakdown by sunlight in icy environments.