Raman Spectroscopy as a Quantitative Tool for Industry
Special Issues
This tutorial demonstrates that Raman is well-suited to tackle two challenges faced by industry: complex mixtures and isomers.
As Raman spectroscopy becomes a more sophisticated and widely used research tool, it is also penetrating industry, where manufacturers are harnessing it for process monitoring and quality control. This tutorial examines how Raman is well-suited to tackle two of the challenges faced by industry: mixtures and isomers. We look at recent examples in the literature addressing real industry applications and illustrate the solutions using some simple Raman experiments. First, we demonstrate nondestructive measurement of the concentration of a specific component in a mixture (ethanol), even when the mixture is complex and its other components are unknown. Second, we show how Raman spectroscopy is well-suited to distinguish the different isomers of a compound, showing both alcohol and xylene isomer spectra as examples.
Raman spectroscopy has come a long way since the Raman effect was first observed in 1928. For decades it was an esoteric technique, one that was complicated to use because of the need for a powerful, coherent source and sensitive detectors. The last two decades have seen the field come to maturity, thanks in large part to lasers with improved stability, power, size, and cost, as well as more sensitive detectors. Better filtering technology enables steeper and deeper blocking of the laser and fluorescence background and chemometrics software extracts more information from the generated spectra. Furthermore, the market now offers "build your own" modular systems in which the components are designed to be easily interfaced, giving users greater flexibility to customize or alter their system as required.
When turnkey operation is necessary, application-specific systems designed for industry address chemical identification, pharmaceutical quality control, process monitoring, and first responder applications with novice-friendly features like trigger operation and integrated display screens. Though not quite a household name, Raman spectroscopy has become a mature spectroscopic technique in its application to industry.
Nonetheless, Raman spectroscopy still retains an air of mystery for inexperienced users. Just how does one coax these spectra with hundreds of peaks to reveal their secrets? This article looks at some of the complex problems being tackled by Raman spectroscopy in research and industry and illustrates the method of analysis via spectra from chemicals possessing much simpler Raman signatures.
Quantifying Mixtures
It's easy enough to grasp how Raman spectroscopy can be used to identify a specific chemical — a spectrum is generated where peaks correspond to specific vibrational and rotational modes within the molecule. Each chemical has its own unique fingerprint, which can be cross-referenced with a library of known Raman spectra for identification. When dealing with a mixture, however, peaks quickly begin to overlap and spectra become more convoluted.
In some cases, the Raman spectra of the mixture's constituents are quite simple, and it is only the conditions of measurement that are complex. Raman spectroscopy has been evaluated for real-time monitoring of the quality of liquid oxygen in the delivery line during ground testing of rocket engines, in which high temperature and pressure limit the performance of commercially available sensors. Tiwari and colleagues (1) developed an all-optical cryogenic fluid sensor to measure the concentration of liquid nitrogen in liquid oxygen, working with the 2331 cm-1 peak of liquid nitrogen and the 1556 cm-1 peak of liquid oxygen. Their work compared performance using both standard 532-nm lasers and a more cost-effective 670-nm diode laser. They found the sensor to be very sensitive at low concentrations, capable of measuring liquid nitrogen percentages as low as 1% in a sample mixture for a 532-nm laser and ~20% for a 670-nm diode laser (limited by the need for better filtering of background light).
At other times, the constituent to be measured is a relatively simple molecule, but the mixture is complex. Anand and colleagues (2) demonstrated that it is possible to measure the proportion of methanol by volume in gasoline mixtures using Raman spectroscopy. Methanol is favored as an alternative transport fuel because it is relatively inexpensive, is nonpetroleum based, burns cleanly, and can be stored as a liquid at room temperature. It can be used in a modified version of the standard combustion engine, with an 85:15 methanol–gasoline mix used most often. Anand and colleagues used a 785-nm excitation laser, observing that the peak height at 729 cm-1 decreased linearly as the proportion of methanol by volume increased.
To illustrate how a single component in a mixture can be quantified, we prepared standard solutions of ethanol (Aldrich Chemicals) in deionized water ranging from 0–100% in glass vials. Raman spectra were taken using a modular system from Ocean Optics, comprising a QE65000-Raman spectrometer (range 780–930 nm, optical resolution ~0.4 nm FWHM, and 90% quantum efficiency), SpectraSuite operating software, an InPhotonics 785-nm probe (RIP-Probe-785), and a 785-nm stabilized laser. All measurements were taken using the same acquisition parameters: an 8-s integration time, 1 scan to average, and 0 box car smoothing. We used the peak height at 880 cm-1 to generate a second-order polynomial calibration curve against concentrations for the standard solutions (Figure 1).
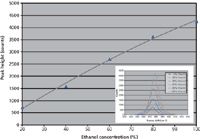
Figure 1: Calibration curve for ethanol in water (inset shows 880 cm-1 peaks used to generate the curve).
Also, a Raman spectrum was taken for some discount-store hand sanitizer using the same acquisition parameters, with the peak height at 880 cm-1 used to determine the ethanol content from the calibration curve. Hand sanitizers contain up to a dozen inactive ingredients, such as carbomer, triethanolamine, propylene glycol, tocopherol acetate, dyes, and scents. The resulting spectrum is more complicated than ethanol in water, but the 880-cm-1 peak remains very clear (Figure 2). Though most brand-name sanitizers contain 60% or more ethanol, as recommended by the FDA, the discount sanitizer was found to have only ~45% ethanol.
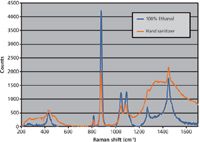
Figure 2: Raman spectra of pure ethanol and an unknown hand sanitizer.
Peak height is often sufficient for quantitative analysis, but using area under the peak can improve accuracy. When there is significant interference between characteristic peaks, peak ratios are sometimes used for analysis, or partial least squares analysis is applied through commercially available chemometric software packages such as GRAMS AI from Thermo Scientific and Analyze IQ Lab from Analyze IQ Limited.
Sometimes extensive data processing is needed to achieve the desired accuracy, as in the case of McGoverin and colleagues (3), who had some success in predicting the solid fat content and triacylglycerols of anhydrous milk fat, the most commercially important separated fat component of milk. The study used a 752-nm excitation laser with a spectrometer for detection. They used a combination of software to perform a number of corrections, including smoothing, correction for baseline, standard normal variate (to remove scatter), Norris derivative smoothing, and area normalization. They used additional analysis methods to determine which calibration treatments yielded the best quality prediction models, working with multiple bands within the spectra.

Figure 3: 1-Butanol and 2-butanol isomers.
Raman spectroscopy also has the ability to look beyond chemical structure in quantification. Fourier transform (FT)-Raman has been used to measure the degree of crystallinity of cellulose, which is important because it affects physical, mechanical, and chemical properties. Tensile strength, dimensional stability, and density all increase with crystallinity, but chemical reactivity and swelling decrease. Though most often measured by wide-angle X-ray scattering, researchers Agarwal and colleagues (4) found FT-Raman to be a more accurate method for determining the degree of crystallinity in cellulose. FT-Raman is preferred over conventional Raman in this case because of its ability to analyze samples that would typically fluoresce.
Distinguishing Isomers
Some of the mixtures under scrutiny in industry contain two or more isomers of a given chemical. Even though isomers share the same molecular formula, their properties can be very different depending on the type of isomer. Structural isomers differ in arrangement of their functional groups, such as degree of branching of hydrocarbons or the positions of functional groups on a chain or ring. Their chemical properties tend to be quite different. Stereoisomers share the same bond formation, but differ in how one or more atoms or functional groups are positioned geometrically in space; diastereomers possess one or more portions that appear "flipped" or rotated relative to the other, while enantiomers are full mirror images of one another. Stereoisomers share the same physical properties and behave very similarly in chemical reactions, unless reacting with other stereoisomers or enzymes, giving them very different biological effects.

Figure 4: Structures of p-, o-, and m-xylene isomers.
Separating isomers is a challenge that appears regularly in industry and can require highly specialized techniques. Chromatography, absorption, and crystallization all can be used, but become more difficult when the physical properties of the isomers are similar. Any improvement in efficiency or selectivity can mean significant cost savings, driving the development of new separation techniques.
We find one such example in the gasoline industry, where benzene content has been decreased, increasing the need for catalytic isomerization to convert straight-chain hydrocarbons to branched hydrocarbons. Branched hydrocarbons burn more efficiently and have a higher octane number, but are difficult to separate from the residual linear hydrocarbons. Molecular sieving is typically used, but requires large amounts of zeolite. The use of novel sorbents such as silicalite to exploit subtle entropy effects may prove more efficient (5), but requires real-time monitoring.
Another example comes from the textiles industry, where dinitrotoluene is a key component in making polyurethanes used in materials like insulation, soundproofing, linings for clothing and sleeping bags, cushions, and spandex. A mixture of the isomers 2,4- and 2,6-dinitrotoluene is used because of the difficulty of separation, despite the expectation that polyurethanes synthesized from pure 2,6-dinitrotoluene would have a higher glass transition temperature and greater stability (6). If it could be efficiently isolated, the reaction speed with a single isomer would also be more consistent.
Raman spectroscopy is well-suited to serve as a diagnostic tool for these types of separation challenges, both for development and in-process. It is rapid, noninvasive, moves easily between solids and liquids, and deals well with mixtures. Its ability to instantly probe the vibrational and rotational modes of any molecule with a single incident wavelength makes it extremely versatile. To better understand how Raman would be used in these applications, let's look at the spectra of some simple compounds occurring as isomers: butanol and xylene.
Butanol occurs as 1-butanol, a naturally occurring minor product of fermentation and an intermediate in the production of butyl acetate (a flavorant and industrial solvent), and as 2-butanol, produced on a large scale as a precursor to the industrial solvent methyl ethyl ketone (found in many domestic cleaning agents and paint removers). 2-Butanol is chiral, found as an equal mix of the two stereoisomers.
Xylene occurs as three isomers: meta-, ortho-, and para-xylene, depending on where the methyl groups are attached to the benzene ring. Technical grade xylene is typically 45–55% m-xylene and approximately 20% each of o- and p-xylene, with the remainder consisting of ethyl benzene. Xylene is used as a solvent in many industries, from leather and printing to rubber and plastic. It is also used for cleaning steel, as paint thinner, and can be found in gasoline and airplane fuel. Knowledge of the relative proportion of the three isomers is important in the manufacturing of polymer compounds.
Because of its potentially adverse health effects, xylene falls into the volatile organic compound (VOC) category. Regulatory agencies monitor the levels of xylene in drinking water, in the workplace and in the environment. Because only o-xylene occurs naturally (m- and p-xylene are man-made), a technique that can discriminate among the three isomers is useful.
Samples of each chemical isomer were prepared in glass vials (Aldrich Chemicals) and placed in sequence into a closed container into which the laser probe was directed. Measurements were made using the same modular Raman system from Ocean Optics described previously, but using an 8-s integration time.
The spectra acquired for butanol are shown in Figure 5. Some peaks are shared between the two isomers, including the typical CH3 group peak at ~1460 cm-1 (7). Alcohols have distinct skeletal vibrations that are caused by hydrogen bonding. The addition or deletion of groups causes changes in the geometry and distribution of electrons, altering the Raman spectra. This is seen in the range 700–1200 cm-1 because of differences in the C-C and C-O stretching modes of the two isomers. The broadened peak at 775–785 cm-1 for 2-butane is consistent with a wider range of vibrational frequencies calculated for the different conformers relative to the more consistent vibration at 842–844 cm-1 (8).
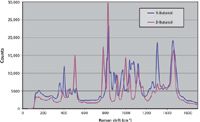
Figure 5: Raman spectra of 1- and 2-butanol.
Spectra acquired for xylene are shown in Figure 6. Although all three isomers of the xylene share peaks that are caused by ring modes in the 1400–1600 cm-1 range, they vary in the 700–1200 cm-1 range, with a unique C-H bending band for p-xylene at 800–840 cm-1 (7). By using partial least-squares regression analysis, Cooper and colleagues (9) demonstrated that the concentration of an individual xylene isomer can be measured to within ±0.15% using a low-cost dispersive spectrometer. More recently, coherent anti-Stokes Raman scattering (CARS) has been used by Li and colleagues (10) to measure concentrations as low as 1% in binary mixtures of o- and p-xylene at a 12-m standoff distance.
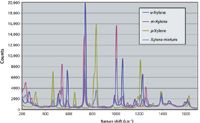
Figure 6: Raman spectra of p-, m-, and o-xylene.
When the isomerism is more subtle, such as in stereoisomers, multiple peaks and peak ratios may be needed for identification, as demonstrated by Zheng and colleagues (11) in their studies of reversibly photoswitchable azobenzene. Photoswitchable molecules can act as molecular machines. Azobenzene is a popular choice for study because of its simple molecular structure and spectra. It alternates between the cis and trans isomers upon exposure to UV and blue light, respectively. Zheng and colleagues had the idea to combine the single-molecule sensitivity of surface enhanced Raman scattering (SERS) with a controlled nanoscale environment of self-assembled monolayers of alkanethiol molecules on gold. They matched the excitation wavelength to the resonant wavelength of the Au substrates, using a 632.8-nm He-Ne laser with a Raman system for detection. They then took SERS spectra of the tethered azobenzene while alternating exposure of the sample to UV (365 nm) and blue (450 nm) light to trigger photoisomerization of the azobenzene between the cis and trans forms of the molecule (Figure 7).

Figure 7: Isomerization of azobenzene between cis and trans forms. Image adapted from http://en.wikipedia.org/wiki/File:Azobenzene_isomerization.png.
As a benchmark, they compared their data to theoretical calculations of the isomers' Raman spectra, generated via B3LYP/6-31G* calculations (12) using a NWChem program package. Reversible cis–trans photoisomerization was observed by monitoring peak area ratios as a function of time as the sample was exposed to UV and then blue light in turn, showing good agreement with simulation. Their work has applicability to all-optical molecular devices.
Raman spectroscopy is even finding its way into medical applications and biotechnology. Cysteamine exhibits rotational isomerism and is used in the treatment of radiation sickness as well as other disorders of cystine excretion. Goto and colleagues (13) used SERS to probe the molecule while exerting a magnetic pulling force to control the rotational isomerization equilibrium between the trans and gauche modes. They used a 514.5-nm laser for excitation in combination with a Raman microscope system. Relative peak intensities for the C-S stretching modes for the two isomers clearly showed that the exerted magnetic force was able to shift the molecule from the gauche to the trans conformation by exerting a stretching force.
Finally, our review would not be complete without an example of quantifying isomers using Raman. P. Novak and colleagues (14) used FT-Raman spectroscopy for in-situ monitoring during the synthesis of entacapone, a drug used in the treatment of Parkinson's disease. Entacapone exists as two isomers, E (trans-) and Z (cis-), with the drug form consisting of 99.5% E-isomer, the more pharmaceutically active of the two. They used the technique to compare reaction speed in different solvents, analyzing their data using principal component analysis.
Conclusion
Raman spectroscopy has moved well beyond basic identification of compounds in its applicability to industry and now tackles more complex problems like quantification in mixtures and isomers with ease. The increasing availability of both turnkey and high quality modular systems allows even inexperienced users to harness this powerful technique.
Yvette Mattley, PhD, is senior applications scientist with Ocean Optics in Dunedin, Florida. Lilian Norris is an applications laboratory specialist for Ocean Optics. Cicely Rathmell is principal at Mapleseed, LLC in Dunedin, Florida. Direct correspondence to Rob.Morris@oceanoptics.com.
References
(1) V.S. Tiwari, R.R. Kalluru, F.Y. Yueh, J.P. Singh, W. St. Cyr, and S.K. Khijwania, Appl. Opt. 46, 3345–3351 (2007).
(2) K. Anand, V. Asundi, and R. Vasudeva, SAE Technical Paper 2000-01-1336 (2000).
(3) C.M. McGoverin, A.S.S. Clark, S.E. Holroyd, and K.C. Gordon, Anal. Methods 1, 29–38 (2009).
(4) U.P. Agarwal, R.S. Reiner, and S.A. Ralph, Cellulose 17, 721–733 (2010).
(5) R. Krishna and B. Smit, Chem. Innov. 31(1), 27–33 (2001).
(6) H.A. Zinnen and T.S. Franczyk, Process for Separating Isomers of Dinitrotoluene, U.S. Patent 4,642,397 (1987).
(7) B.C. Smith, Infrared Spectral Interpretation: A Systematic Approach (CRC Press, Boca Raton, Florida, 1999).
(8) H. Hageman, J. Mareda, C. Chiancone, and H. Bill, J. Mol. Struct. 410, 357–360 (1997).
(9) J.B. Cooper, P.E. Flecher, T.M. Vess, and W.T. Welch, Appl. Spectrosc. 49, 586–592 (1995).
(10) H. Li, D.A. Harris, B. Xu, P.J. Wrzesinski, V.V. Lozovoy, and M. Dantus, Appl. Opt. 48(4), B17–B22 (2009).
(11) Y.B. Zheng, J.L. Payton, C.-H. Chung, R. Liu, S. Cheunkar, B.K. Pathem, Y. Yang, L. Jensen, and P.S. Weiss, Nano Lett. 11(8), 3447–3452 (2011).
(12) A.D. Becke, J. Chem. Phys. 98, 5648–5652 (1993).
(13) T. Goto and H. Watari, Langmuir 26(7), 4848–4853 (2010).
(14) P. Novak, A. Kišic, T. Hrenar, T. Jednacak, S. Miljanic, and G. Verbanec, J. Pharm. Biomed. Anal. 54(4), 660–666 (2011).

AI-Powered SERS Spectroscopy Breakthrough Boosts Safety of Medicinal Food Products
April 16th 2025A new deep learning-enhanced spectroscopic platform—SERSome—developed by researchers in China and Finland, identifies medicinal and edible homologs (MEHs) with 98% accuracy. This innovation could revolutionize safety and quality control in the growing MEH market.
New Raman Spectroscopy Method Enhances Real-Time Monitoring Across Fermentation Processes
April 15th 2025Researchers at Delft University of Technology have developed a novel method using single compound spectra to enhance the transferability and accuracy of Raman spectroscopy models for real-time fermentation monitoring.
Nanometer-Scale Studies Using Tip Enhanced Raman Spectroscopy
February 8th 2013Volker Deckert, the winner of the 2013 Charles Mann Award, is advancing the use of tip enhanced Raman spectroscopy (TERS) to push the lateral resolution of vibrational spectroscopy well below the Abbe limit, to achieve single-molecule sensitivity. Because the tip can be moved with sub-nanometer precision, structural information with unmatched spatial resolution can be achieved without the need of specific labels.