Raman Thermometry: Understanding the Mathematics to Better Design Raman Measurements
Raman measurements can be used to infer the temperature of a material based on the Stokes and anti-Stokes band signal strengths, and by applying a predefined mathematical relationship. In reality, the temperature, Raman shift, and laser excitation wavelength all interact, and should be considered to better understand these measurements.
Spectroscopists are generally aware that the temperature of a material can be determined through the measurement of the Stokes and anti-Stokes Raman band signal strengths. However, inspection of the equation describing that mathematical relationship by itself does not immediately reveal those temperature ranges and corresponding frequencies of vibrational modes for which one could reliably determine temperature by using this method of Raman spectroscopy. Mathematical computation of this relationship allows users to understand and visually grasp how temperature, Raman shift, and laser excitation wavelength all interact, and thereby better design Raman thermometry experiments or measurements with realistic expectations for the determination of temperature.
David Tuschel
Methods for determining the temperature of a material by either measuring the Raman peak position as a function of temperature or obtaining the ratio of the anti-Stokes to Stokes signal strengths of a specific Raman band were explained and discussed in a previous issue of Spectroscopy (1). The latter way of determining the temperature is to measure the signal strengths of a particular Raman band at the Stokes and anti-Stokes positions, and calculate the temperature based on a Boltzmann distribution of the ground and first excited state populations.
The expression most frequently given to describe this relationship is shown in equation 1, where T is the temperature, k is Boltzmann’s constant, h is Planck’s con stant, νlis the frequency of the laser, νv is the frequency of the vibrational mode (Raman band position), and the Stokes (IS) and anti-Stokes (IAS) Raman scattering strengths are based on energy detection of the signals (2).

The means of experimentally detecting the Stokes and anti-Stokes Raman scattering is very important. The use of equation 1 is appropriate when spectra are acquired with energy based detection, whereas equation 2 should be used when photon counting is the basis for detection (3,4):

When spectra are acquired using a charge coupled device (CCD) detector, which is a photon counting device, equation 2 is more appropriate for the analysis of the data. An additional point regarding units should be clearly understood. Planck’s constant is in units of J × s and Boltzmann’s constant is in units of J/K. Therefore, νv must be in units of s-1 for units to cancel providing T in degrees Kelvin when rearranging equations 1 and 2 to calculate T or the ratio of the anti-Stokes to Stokes signal strengths as a function of temperature.
One of the more important aspects of Raman thermometry discussed in the prior work (1) was the significant difference between the Stokes and anti-Stokes signal strengths, which are related to the populations of the ground and first excited vibrational states, respectively. At room temperature, the partition function informs us that the population of the ground state will be higher than that of the excited state for oscillators with energies of vibrational modes. Consequently, we can expect that the higher the energy of the vibrational mode is, the lower the population of the excited state and therefore the weaker the signal strength of the anti-Stokes Raman band will be. Indeed, it is a good rule of thumb that Raman bands at lower frequencies will generally have higher anti-Stokes signal strengths and better signal-to-noise ratios, thereby yielding a more accurate temperature determination. However, we show through calculations employing equation 1 that the relationship of the ratio of anti-Stokes to Stokes signal strengths to temperature and Raman band shift can be far more complicated, depending upon the temperature range in which one expects to make Raman measurements. The Raman band at the lowest available frequency is not always the best choice.
The purpose of this installment of “Molecular Spectroscopy Workbench” is to help users to understand and visually grasp how temperature, Raman shift, and laser excitation wavelength all interact through equation 1, and thereby better design Raman thermometry experiments or measurements with realistic expectations for the determination of temperature. To that end, we have written interactive programs in Mathematica software to calculate the ratio of the anti-Stokes to Stokes signal strengths of Raman bands with variable inputs of laser excitation wavelength, Raman band position, and temperature. The results of these calculations are presented as plots of the ratio of the anti-Stokes to Stokes signal strengths as a function of temperature or Raman band position. These plots are highly instructional, insofar as they reveal the optimal choice of Raman band for a particular range of temperatures. Conversely, they also show spectral ranges that would not allow the spectroscopist to determine the temperature because of the weak variance of the anti-Stokes to Stokes signal strengths of Raman bands over a particular temperature range or because the ratio values are too low for meaningful experimental measurement.
The point concerning the weak variance of the ratio of anti-Stokes to Stokes signal strengths of Raman bands as a function of temperature is perhaps the most important, and the plots offer a caution to spectroscopists performing Raman thermometry. Inspection of equation 1 by itself does not immediately reveal those temperature ranges and corresponding frequencies of vibrational modes for which one could not reliably determine temperature by using the anti-Stokes to Stokes method of Raman spectroscopy. Therein lies the danger. The spectroscopist may falsely assume from equation 1 that any pair of Stokes and anti-Stokes Raman bands will be appropriate for the determination of temperature in any temperature region, as long as the signal-to-noise ratio of the paired bands are adequate. Indeed, we show with interactive computations that some Raman frequency ranges are well suited for Raman thermometry in a particular temperature range, whereas other Raman shift ranges will yield unreliable temperature results notwithstanding the acquisition of spectra with good signal-to-noise ratios.
The calculated Raman responses shown in this article were produced by a Mathematica-based document written by the author that includes instructional text and interactive programs on the subject of Raman thermometry. Users of the program are able to see how the ratio of the anti-Stokes to Stokes signal strengths varies with temperature, wavenumber of the Raman band, and excitation wavelength. The technical and interactive document is available from the author in Mathematica notebook file format and computable document format (CDF). Those who do not have Mathematica will need to download the free Wolfram CDF Player (http://www.wolfram.com/cdf-player/) from Wolfram in order to interact with the CDF document.
Raman Signal Strength as a Function of Temperature
As mentioned. our goal is to allow users to understand and visually grasp how temperature, Raman shift, and laser excitation wavelength all interact through equation 1, and thereby better design Raman thermometry experiments or measurements with realistic expectations for the determination of temperature. A good way to visually accomplish this task is to plot the ratio of the anti-Stokes to Stokes signal strengths as a function of temperature. The interactive program written for this work calculates the ratio of the anti-Stokes to Stokes signals as a function of temperature with the options to select the laser excitation wavelength and Raman shift. The temperature range discussed in this work is from 77 K (liquid nitrogen) to 600 K. The initial Laser Wavelength and Raman Shift values selected in the interactive program are 532 nm and 10 cm-1, respectively. One can see in Figure 1 that, for these settings, the slope of the plot of the ratio of the anti-Stokes to Stokes signal strengths as a function of temperature is greatest at 77 K, and decreases with increasing temperature. The slope at a given temperature is directly related to one’s ability to resolve higher or lower temperatures through the measurement of the ratio of the anti-Stokes to Stokes signal strengths. The greater the slope, the better one will be able to resolve temperature differences by the Raman method.
Figure 1: IAS/IS response to Raman shift: the ratio of the anti-Stokes to Stokes signal strengths as a function of temperature calculated for a Raman shift of 10 cm-1 with an excitation wavelength of 532
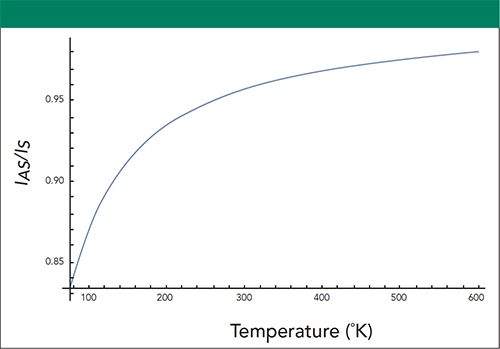
Based upon the plot obtained at these settings, the temperature range from 77 to 200 K offers the best temperature resolution for a Raman band at 10 cm-1 and using 532 nm excitation. However, note that the ratio of the anti-Stokes to Stokes signal strengths varies between approximately 0.83 and 0.93 between 77 and 200 K, a range of merely 0.1. Therefore, even though the slopes between 77 and 200 K are favorable, the narrow range of intensity ratios will require strong signal-to-noise ratios to experimentally resolve temperatures. The slope in the range from 200 to 300 K decreases progressively, but should still be adequate to experimentally determine the temperature. Beyond 300 K, the slope becomes flatter with increasing temperature and so a Raman band at 10 cm-1 and using 532 nm excitation would not be a good choice in this temperature range. Movement of the Laser Wavelength slider from 400 nm to 800 nm in the interactive program reveals that the shape of the calculated function does not change at all and the ratios of the anti-Stokes to Stokes signal strengths as a function of temperature change only slightly. Therefore, the ratio of the anti-Stokes to Stokes signals as a function of temperature at this low Raman shift is independent of excitation wavelength.
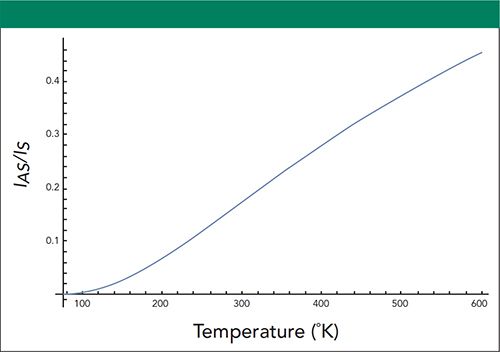
With the Laser Wavelength remaining at 532 nm, the Raman shift slider is moved from 10 cm-1 to 400 cm-1, as shown in Figure 2. Notice how significantly the plot of the ratio of the anti-Stokes to Stokes signal strengths as a function of temperature changes shape. Whereas the slopes had previously been most steep between 77 and 200 K, they are now flat or shallow between 77 and 140 K. At temperatures greater than 140 K, the plot seems to have an approximately constant slope, and appears fairly linear. If the Laser Wavelength slider is moved between 400 and 800 nm, one observes that the shape of the plot doesn’t change, but that all of the ratios of the anti-Stokes to Stokes signals as a function of temperature increase slightly with increasing laser wavelength. Setting the excitation wavelength to 800 nm increases the maximum ratio of the anti-Stokes to Stokes signals to 0.48 from 0.44 at 532 nm excitation, thereby offering a slight improvement over ratio values expected at 532 nm. Therefore, a longer excitation wavelength should yield only a marginally better ratio of the anti-Stokes to Stokes signals as a function of temperature when monitoring a Raman band at 400 cm-1. Also, note that the ratio of the anti-Stokes to Stokes signals varies between approximately 0.02 and 0.44 at an excitation wavelength of 532 nm. That is a range of 0.42, which is a significant improvement over the range of 0.1 for the Raman band at 10 cm-1. However, it will be very difficult experimentally to accurately measure the ratio of the anti-Stokes to Stokes signal strengths at values of 0.05 or less. Consequently, it would be impractical to make temperature determinations at 200 K or less based upon the ratio of signal strengths of a Raman band at 400 cm-1. Note that the ratios of the anti-Stokes to Stokes signals range from 0.1 to approximately 0.44 at temperatures between 240 and 600 K, respectively. Therefore, a Raman band at 400 cm-1 should be experimentally very useful in determining temperature between 240 and 600 K.
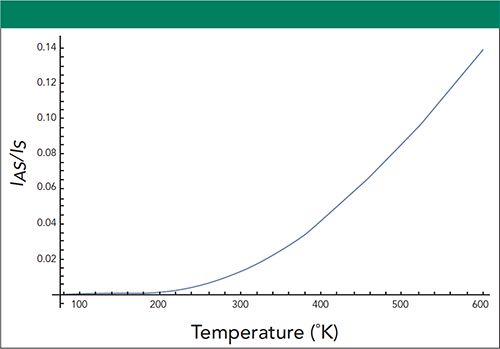
We now increase the frequency of the Raman band and move the Raman Shift slider to 1000 cm-1, as shown in Figure 3. The plot of the ratio of the anti-Stokes to Stokes signal strengths as a function of temperature is approximately horizontal and the slope zero between 77 and 200 K. Consequently, a Raman band at 1000 cm-1 cannot be used in this temperature range to experimentally determine temperature. At temperatures greater than 200 K, the slope begins to increase with increasing temperature thereby leading one to think that the 1000 cm-1 band can be used for thermal analysis between 200 and 600 K. However, note that at a Raman shift of 1000 cm-1 the ratios of the anti-Stokes to Stokes signals have reduced to an operational range of approximately 0.00 to 0.14 between 77 and 600 K, respectively. Therefore, even though the slopes between 200 and 600 K are favorable, the values of intensity ratios of 0.05 or less below 440 K preclude that thermal range from accurate temperature determination using a Raman band at 1000 cm-1. At temperatures greater than 440 K, it will require strong signal-to-noise ratios of the acquired spectra to resolve temperatures because of the low ratio values of the anti-Stokes to Stokes signal strengths in a range from 0.05 to 0.14. Again, movement of the Laser Wavelength slider from 400 to 800 nm reveals that all of the ratios of the anti-Stokes to Stokes signals as a function of temperature increase slightly with increasing wavelength. Therefore, a longer excitation wavelength should yield a marginally better ratio of the anti-Stokes to Stokes signals as a function of temperature when monitoring a Raman band at 1000 cm-1.
Figure 3: IAS/IS response to Raman shift: the ratio of the anti-Stokes to Stokes signal strengths as a function of temperature calculated for a Raman shift of 1000 cm-1 with an excitation wavelength of 532
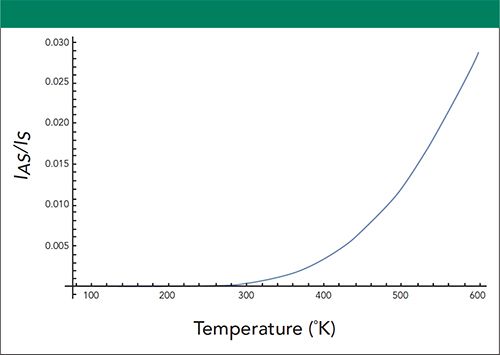
Finally, as shown in Figure 4, we set the Raman Shift slider to 1800 cm-1. The plot of the ratio of the anti-Stokes to Stokes signal strengths as a function of temperature is now approximately horizontal and the slope zero between 77 and 300 K. A Raman band at 1800 cm-1 cannot be used in this temperature range to experimentally determine temperature. At temperatures greater than 300 K, the slope begins to increase with increasing temperature, thereby suggesting that the 1800 cm-1 band may be used for thermal analysis between approximately 380 and 600 K. However, note how very small the ratios of the anti-Stokes to Stokes signals have become, diminishing to an operational range of approximately 0.002 to 0.028. Those are exceedingly small values! Therefore, even though the slopes between 380 and 600 K are favorable, it may not be possible to experimentally measure such values by either Raman peak height or area to accurately resolve temperatures.
Raman Signal Strength and Vibrational Mode Energy
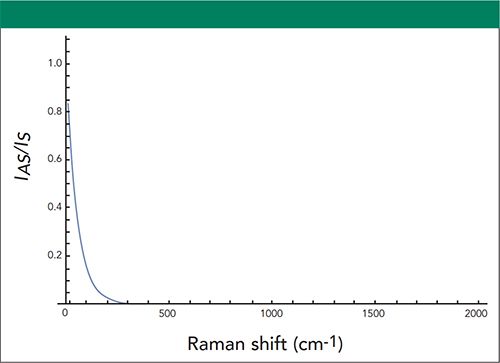
We have visualized the Raman Thermometry relationship by plotting the ratio of the anti-Stokes to Stokes signal strengths as a function of temperature. Now, let’s take a different perspective on that relationship by plotting the ratio of the anti-Stokes to Stokes signal strengths as a function of Raman shift with the options of selecting the laser excitation wavelength and temperature. Of course, the interactive program used to calculate and plot the results is also based upon equation 1. The Raman shift scale is plotted from 10 cm 1 to 2000 cm-1. Figure 5 shows that the initial laser wavelength and temperature values are 532 nm and 77 K, respectively. One can see that for these settings the slope of the plot of the ratio of the anti-Stokes to Stokes signal strengths as a function of Raman shift is greatest at 10 cm-1 and decreases with increasing Raman shift. At Raman band shifts greater than 200 cm-1, the function rapidly approaches zero, thereby indicating that only Raman bands less than 200 cm-1 can practically be used to determine temperature at or near 77 K. Furthermore, although not shown here, changing the laser excitation wavelength from 400 nm to 800 nm has no effect on the calculated plot of the ratio of the anti-Stokes to Stokes signal strengths as a function of Raman shift. Therefore, we must use a Raman band less than 200 cm-1 for all excitation wavelengths if we wish to determine the temperature near 77 K.
We now set the Temperature slider to room temperature at 298 K, as shown in Figure 6. The plot of the ratio of the anti-Stokes to Stokes signal strengths as a function of Raman shift is no longer as steep and more gradually decreases out to a practical limit of 0.1 at approximately 600 cm-1, beyond which the function decreases to ratio values of 0.05 or less. It will be very difficult experimentally to accurately measure the ratio of the anti-Stokes to Stokes signal strengths at values of 0.05 or less. Consequently, it would be impractical to make temperature determinations based upon the ratio of signal strengths of Raman bands greater than 800 cm-1 at 298 K. However, note that the ratios of the anti-Stokes to Stokes signals range from nearly 1 to approximately 0.1 at Raman shifts between 10 cm-1 and 600 cm-1, respectively. Therefore, this low wavenumber spectral region should be experimentally very useful in determining temperature at or near room temperature. Varying the excitation wavelength from 400 to 800 nm at this temperature changes the plot of the ratio of the anti-Stokes to Stokes signal strengths as a function of Raman shift only marginally, and so the choice of excitation wavelength will have no material bearing on the experimental results.
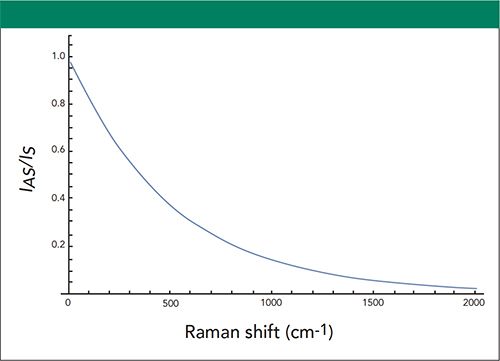
Finally, we set the Temperature slider to 600 K, as shown in Figure 7. The plot of the ratio of the anti-Stokes to Stokes signals as a function of Raman shift is even less steep and decreases even more gradually out to a practical limit of 0.1 at approximately 1300 cm-1, beyond which the function decreases to ratio values of 0.05 or less. Consequently, it would be impractical to make temperature determinations based upon the ratio of signal strengths of Raman bands greater than 1500 cm-1 at 600 K. However, the ratios of the anti-Stokes to Stokes signals range from nearly 1 to approximately 0.1 at Raman shifts between 10 and 1300 cm-1, respectively. Therefore, this wide spectral region should be experimentally very useful in determining temperature at or near 600 K.
Conclusion
The determination of the temperature of the material through the measurement of the ratio of the anti-Stokes to Stokes signal strengths is not experimentally straightforward. The work presented here and the Mathematica programs on which this publication is based are intended to help the spectroscopist with experimental design in choosing the most suitable Raman band and excitation wavelength for the temperature range in which temperatures are to be determined. Alternatively, one can use these programs and the plots of the ratio of anti-Stokes to Stokes signal strengths as a function of Raman shift or temperature to determine whether a temperature determination by Raman spectroscopy is impractical for a particular material; that is, if Raman bands are not available at frequencies suitable for the temperature range under study.
References
- D. Tuschel, Spectroscopy 31(12), 8–13 (2016).
- S.D. McGrane, D.S. Moore, P.M. Goodwin and D.M. Dattelbaum, Appl. Spec.68, 1279–1288 (2014).
- J.J. Gallardo, J. Navas, D. Zorrilla, R. Alcantara, D.Valor, C. Fernandez-Lorenzo and J. Martin-Calleja, Appl. Spec.70, 1128–1136 (2016).
- B.J. Kip and R.J. Meier, Appl. Spec.44, 707–711 (1990).

David Tuschel is a Raman applications scientist at Horiba Scientific, in Edison, New Jersey, where he works with Fran Adar. David is sharing authorship of this column with Fran. He can be reached at: SpectroscopyEdit@MMHGroup.com
New Study Reveals Insights into Phenol’s Behavior in Ice
April 16th 2025A new study published in Spectrochimica Acta Part A by Dominik Heger and colleagues at Masaryk University reveals that phenol's photophysical properties change significantly when frozen, potentially enabling its breakdown by sunlight in icy environments.
Advanced Raman Spectroscopy Method Boosts Precision in Drug Component Detection
April 7th 2025Researchers in China have developed a rapid, non-destructive Raman spectroscopy method that accurately detects active components in complex drug formulations by combining advanced algorithms to eliminate noise and fluorescence interference.
