Rapid Bacterial Diagnostics Via Surface-Enhanced Raman Microscopy
SERS of bacterial cells can be a useful technique for clinical diagnostics, as illustrated by the analysis of a human urine sample spiked with urinary tract infection bacteria.
There is a continuing need to develop new techniques for rapid and specific identification of bacterial pathogens in human body fluids especially given the increasing prevalence of drug-resistant strains. Efforts to develop a surface-enhanced Raman spectroscopy (SERS)-based approach, which encompasses sample preparation, SERS substrates, portable Raman microscopy instrumentation, and novel identification software, are described. The progress made in each of these areas in our laboratory is summarized and illustrated by a spiked infectious sample for urinary tract infection diagnostics. SERS bacterial spectra exhibit both enhanced sensitivity and specificity, allowing the development of an easy-to-use, portable, optical platform for pathogen detection and identification. SERS of bacterial cells is shown to offer reproducible molecular spectroscopic signatures for analytical applications in clinical diagnostics. The approach is a new tool for studying biochemical activity in real time at the outer layers of these organisms.
The ability to rapidly detect and identify bacterial cells in human body fluids for a relatively low cost in point-of-care settings is a continuing need for health care providers worldwide. Bacteremia, the presence of bacteria in blood, results from severe infections at sites in the body, surgical wounds, or contaminated implanted devices and may lead to the potentially fatal condition of sepsis. Because of an ~40% mortality rate, sepsis ranks 13th among the causes of overall death in the United States (1–3). Urinary tract infections (UTI), evidenced by bacteria in urine, are among the most common types of infections in humans. Approximately 50% of all women will have at least one UTI in their lifetime, and a sizable percentage of those will suffer from chronic UTIs (4,5). In the United States alone, UTIs are responsible for more than 7 million doctor office visits and more than 1 million hospital admissions at a cost of approximately $1 billion per year. Sepsis and UTIs are caused by a variety of bacterial species and strains. Furthermore, the increasing proliferation of drug-resistant strains places an increasing premium on identifying these microbes with strain specificity in a useful time frame for narrow spectrum antibiotic drug prescription (6). In addition, the need for rapid bacterial identification methods for food and water safety applications has been illustrated by the several high-profile incidents reported nationwide over the past few years (7).
Traditional methods of bacterial identification are phenotypic-based approaches that require a cell growth period and are consequentially slow (24–48 h or longer). Also, distinguishing closely related strains may be difficult via traditional methods and it is not a point-of-care technique. The best current methods are molecular diagnostic approaches that utilize specific primers or probes for particular gene targets, such as "real time" polymerase chain reaction methods (PCR) (8), which are increasingly finding use in clinical settings. If no culturing is required, PCR time frames are typically in the 2–6 h range. However, PCR is not without some limitations or liabilities, including sample contamination, infectious mixture resolution, the need for required primer sets, speed, cost, and point-of-care capabilities (9). Hence, at the very least, there is a continuing need for competing or orthogonal bacterial identification methods.
For the past few years we have been developing an optical approach for rapid, sensitive, and specific bacterial diagnostics based on surface-enhanced Raman spectroscopy (SERS) (10–14). SERS is a well-known spontaneous light scattering technique, discovered ~35 years ago, that results in the 105–108 effective enhancement of the Raman scattering intensity of some molecular vibrational modes of molecules that are close (≤~5 nm) to nanostructured metal surfaces (15,16). This effect is predominantly attributed to the plasmonically enhanced local electric fields that become concentrated near nanosized structures that are coincident with the surface plasmon resonances of these nanomaterials. These plasmon resonances are usually in the near-infrared (NIR) to visible range for the most commonly employed metals, silver (Ag) or gold (Au). Aside from the advantages of speed, ease-of-use, and potential cost introduced by the development of an optical approach for bacterial diagnostics, a SERS-based platform also offers the advantage of portability because only a few milliwatts of laser power are required for acquisition of high-quality SERS spectra. This portability is central for the application of this SERS platform to a wide variety of applications in addition to clinical bacterial diagnostics, such as forensics, food and water safety testing, and in situ studies of works of art and cultural heritage materials.
Overview of the SERS Platform
The total SERS pathogen detection platform may be viewed as consisting of four key components, described below.
Sample preparation device or procedure: Although often overlooked, sample preparation is a key ingredient for the effective use of novel pathogen detection methods. We are developing a two-stage approach for bacterial enrichment from human blood (12,17). Detecting bacteria in blood is extremely challenging because red blood cell concentrations are ~109/mL in human blood, and other particles, such as white blood cells and platelets, are present at ~106/mL levels. In contrast, medically relevant concentrations corresponding to bacteremic presentations are in the 102–103/mL range, and the surface area of a red blood cell is about an order of magnitude larger than that of a typical bacterial cell. However, through selective lysis, centrifugation, and micro-evaporation sufficient enrichments of ~105 can be achieved, allowing for the acquisition of SERS spectra in 100-nL volumes starting with 10 mL of infected blood. Sensitivities down to 103/mL have already been achieved in a bench top procedure and an automated device is currently being developed in our laboratory (12). The required sample preparation procedures for UTI detection is simpler because the concentration of other cells in urine is normally low and the clinical levels of bacterial infection concentrations are much higher in urine (≥105/mL) than blood, as described further below.
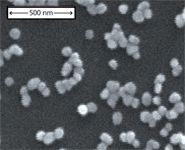
SERS substrate: Most of our SERS data have been acquired from bacterial cells placed on a substrate produced by a gold-ion doped sol-gel procedure (10). These substrates yield strongly enhanced, reproducible SERS signals for vegetative bacterial cells with 785-nm excitation. As shown in Figure 1, these substrates have clusters of 80-nm Au nanoparticles physiadsorbed to the outer surface of a SiO2 matrix. Further improvements in SERS chip performance will only enhance the value of this technique. We have collaborated on the design and production of several engineered substrates (18–20), however, the sol-gel Au nanoparticle "chips" have proven to provide the best signal and noise for bacterial identification purposes of those we have tested so far.

Figure 1: A scanning electron micrograph image of the Au nanoparticleâcovered SERS substrate produced by an Au-ion doped sol-gel process. Clusters of 1â15 ~80-nm Au particles are evident on the surface of the SiO2 SERS chip. Adapted from reference 10 with permission.
A portable SERS signal acquisition instrument: Although several handheld Raman devices with nearly point-and-click capabilities are commercially available, true microscopic capabilities are necessary for this SERS application. Thus, we designed and built several prototype high-performance (cooled CCD array, ~5-cm-1 spectral resolution, piezo-driven sample positioning stages, and submicrometer imaging resolution) portable Raman microscopes for this purpose. This unique instrument allows positioning of the 785-nm Raman excitation on a specific cell or sample region on the SERS substrate for Raman analysis. Imaging also provides additional morphology information that can help with identification procedures. Our most recent version of the Raman microscope was built in collaboration with BioTools, Inc.
Bacterial identification software: As described further below, we have developed a novel multivariate data analysis technique that provides accurate distinction between the SERS spectra of closely related bacterial species and strains when combined with a previously developed reference library.
Characteristics of Bacterial SERS
Following multiple cycles of centrifugation and washing with distilled water, bacterial cells are resuspended in water and placed on the SERS substrate for signal acquisition. The maximum scattering intensity of the SERS spectrum on a per-bacterium (not per-molecule) basis is between 104 to 105 times larger than the observed maximum signal for the normal Raman spectrum of the same bacterium (10). This per-bacterium signal enhancement factor enables signal acquisition close to the single-cell level, although usually SERS spectra are acquired from about 10–20 bacterial cells in the sample region. This level of signal enhancement allows the development of a portable Raman instrument because excellent signal-to-noise scattering can be achieved with low incident laser power at 785 nm. Aside from a measure of sensitivity, the capability of obtaining spectra at the single-cell level offers the possibility of resolving infectious mixtures by selectively analyzing different members of the bacterial population.
Interestingly, there is no correspondence between the vibrational bands observed in the normal Raman spectrum and those in the SERS spectrum (10,13). Because of the distance dependence of the SERS enhancement mechanism, only those molecules at the outer layers or very close to the cell wall can contribute to the bacterial SERS spectrum. In contrast, all the molecules in the Raman illuminated region contribute to the normal Raman spectrum and that volume is dominated by the cell cytoplasm. Hence, the SERS and normal Raman spectrum of a given bacterial cell type are from totally different parts of the cell and have virtually no features in common.
Specificity
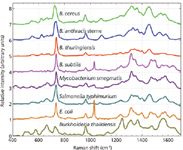
SERS spectra of eight different laboratory-cultured bacterial species from five genera are shown in Figure 2. These spectra are acquired with 10 s of ~2 mW of 785-nm incident laser power and result from the Raman excitation of 10–20 cells, typically. Spectra with excellent signal-to-noise ratios are obtained on our SERS substrates. As is evident in this figure, each species exhibits a unique SERS signature. Although the spectra have been arranged top to bottom by phylogenic proximity, only moderate correlation with this lineage is observed. Furthermore, no clear distinction between Gram-positive and Gram-negative bacteria is apparent. An under-appreciated aspect of bacterial SERS spectra is that, in addition to the enhanced sensitivity that SERS provides, the spectral differences between SERS spectra of different species or strains is greater in SERS than for normal Raman (13). In other words, SERS results in enhanced specificity as well as enhanced sensitivity for bacterial samples.

Figure 2: SERS spectra of eight bacterial species obtained on Au aggregateâcoated SiO2 chips (Figure 1). An incident laser power of ~2 mW and a data accumulation time of 10 s were used to obtain these spectra. Spectra are offset vertically for display purposes and top-to-bottom ordered according to their phylogenetic relationship.
Software for Bacterial Diagnostics
To exploit these unique SERS signatures for bacterial diagnostics, we have developed a principal components analysis (PCA)-based methodology for matching the acquired SERS spectrum to a known species or strain in a previously compiled library (13). After Fourier filtering the SERS spectrum, a bar-code is generated by using the sign of the second derivative of the spectrum — that is, whether the spectrum has curvature up or curvature down at each wavenumber — to assign a "one" or a "zero" as a function of scattered frequency. An example of a SERS-based bar-code is shown in Figure 3 for a SERS spectrum of B. cereus. These bar-codes, or arrays of ones and zeroes, color-coded as black (curvature down) or white (curvature up) per wavenumber interval in this figure, are the inputs for PCA and related standard analyses, such as discriminant function analysis (DFA) or hieracrchical cluster analysis (HCA). The bar-code methodology results in significantly enhanced diagnostic specificity and is the tool used for quantitative measures of reproducibility.

Figure 3: SERS spectrum of B. cereus. The corresponding second-derivative "bar-code" spectrum is given below. The bar-code is determined only by the sign of the second derivative (curvature up = white, curvature down = black). These bar-codes are the inputs for the principal component analysis (PCA) used to identify unknown bacteria with SERS, demonstrated in Figures 4 and 5.
As an example of the effectiveness of this bar-code methodology and how it is used for bacterial diagnostics, two PCA plots (PC2 vs. PC3) are shown in Figure 4. The left-hand panel results when six SERS spectra of four closely related Bacillus bacteria (B. thuringiensis, B. cereus, B. anthracis Sterne, and B. anthracis Ames) are the input vectors to a standard PCA procedure. Each spectrum corresponds to a "dot" in this plot, which has been color-coded to indicate the organism it represents; the rings correspond to 2D standard deviations. The tightness of the clusters for a given species or strain characterizes the reproducibility of the spectra and the distance between the color-coded clusters represents the specificity offered by these measurements. For example, B. anthracis Ames and B. thurengiensis cannot be separated in this treatment (Figure 4, left). However, when the input to the PCA treatment is the bar-code spectra, all species or strains are well-separated, and much tighter clusters are obtained, as seen in the PCA plot on the right side in Figure 4. The contrast between these two panels illustrates the enhanced specificity that results from this bar-coding procedure and is key to the use of this methodology for bacterial diagnostics (13).

Figure 4: Comparison of PCA plots (PC3 vs. PC2) for SERS spectra of four closely related Bacillus organisms (B. thuringiensis, B. cereus, B. anthracis Sterne, and B. anthracis Ames). When the observed SERS spectra are the inputs to the PCA, the contour plot shown in the left-hand panel results. By contrast, when the input to the PCA are the bar-code representations of the observed SERS spectra, the contour plot shown in the right-hand panel results. The enhancement in specificity resulting from the bar-code spectra is clearly evident by this comparison. Adapted from reference 13 with permission.
Following acquisition of the SERS spectrum of the unknown sample, the spectrum is converted to its corresponding bar-code and PCA analysis is performed with groups of bar-code SERS spectra of known bacterial identity selected from a previously developed library to identify the unknown bacteria. The species or strain group that the unknown clusters with determines the identity of the unknown. The identification method is only limited by the library size, which can be continuously and readily expanded, and is not dependent upon specific primer sets or antibody specificity. This approach is quite general and, in principle, could be expanded to other pathogens such as fungi or viral particles.
Origin of SERS Signals
The molecular origins of the vibrational bands usually observed in the SERS spectra of vegetative bacterial cells are attributed to the diversity of lipoproteins, proteins, lipids, and other cell-wall components at the outer membrane layer of these bacterial cells (21–23). The distance dependence of the SERS enhancement mechanism supports such a supposition. Despite this, we have discovered that nearly all of the observed vibrational signatures are due to small metabolites that are concentrated at the outer region of bacterial cells (24). In particular, the largest features in the SERS spectra are generally products in the purine degradation pathway. The large range and unique reproducible signatures found for the SERS bacterial spectra result from the large number of enzymatic variations in these metabolic pathways and the resulting different relative concentration of the many small molecules found in this near extracellular region. Thus, SERS offers not only reproducible molecular signatures for analytical detection and identification applications as shown here, but also a new tool for studying biochemical activity in real time at the outer layers of these organisms.
An Example: UTI Diagnosis
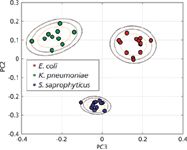
Although the bulk of our effort has been directed toward the very challenging problem of bacteremia diagnostics, efforts in our laboratory have recently expanded to develop this SERS-based approach for UTI diagnostics. With relatively routine centrifugation-based techniques, bacterial concentration enrichments of 103–104 can be achieved in urine samples that have been spiked at the clinically relevant concentration of 105 cfu/mL. Figure 5 shows the PCA plot for three different organisms known to be causative agents of UTI. These bacteria were spiked into human urine at 105 cfu/mL concentration, enriched through a centrifugation procedure, and then placed on the SERS substrate for data acquisition. Distinct clusters are readily obtained for the bacterial cells after recovery from urine indicating that species-specific SERS spectral signatures can be identified by this SERS bar-code procedure. This prototype, benchtop UTI test took about 30 min to perform, and the SERS based analysis illustrates the potential value of this promising methodology.

Figure 5: A PCA plot resulting from a SERS bar-code cluster analysis for three bacteria (E. coli, K. pneumoniae, and S. saprophyticus) that were recovered from spiked urine samples at medically relevant concentrations (105/mL).
Conclusion
The elements and basis for a SERS-based platform for bacterial diagnostics, which includes a sample preparation device, a portable Raman microscope, SERS substrates, and software for bacterial identification, have been described. This novel optical approach is a potentially transformative diagnostic procedure for the rapid, reliable identification of bacterial species or strains in patients with infectious disease symptoms. In addition, SERS provides an effective tool for learning about the chemical activity of molecules at the outer layers of these organisms and, in particular, is a new method for use in the recently established field of metabolomics.
References
(1) G.M. Bearman and R.P. Wenzel, Arch. Med. Res. 36, 646–659 (2005).
(2) D.C. Angus, W.T. Linde-Zwirble, J. Lidicker, G. Clermont, J. Carcillo, and M.R. Pinsky, Crit. Care Med. 29, 1303–1310 (2001).
(3) J.M. O'Brien, Jr., N.A. Ali, S.K. Aberegg, and E. Abraham, Am. J. Med. 120, 1012–1022 (2007).
(4) S.M. Schappert and E.A. Rechtsteiner, National Health Statistics Reports 8, (National Center for Health Statistics, Hyattsville, Maryland, 2008).
(5) T.L. Griebling, in Urologic Diseases in America, M.S. Litwin and C.S. Saigal, Eds. (Department of Health and Human Services, Public Health Service, National Institutes of Health, National Institute of Diabetes and Digestive and Kidney Diseases, Washington, D.C., 2007), pp. 587–619.
(6) X. Yu, M. Susa, J. Weile, C. Knabbe, R.D. Schmid, and T.T. Bachmann, Int. J. Med. Microbiol. 297, 417–429 (2007).
(7) http://en.wikipedia.org/wiki/List_of_foodborne_illness_outbreaks_in_the_United_States.
(8) K.A. Harris and J.C. Hartley, J. Med. Microbiol. 52, 685–691 (2003).
(9) C.E. Corless, M. Guiver, R. Borrow, V. Edwards-Jones, E.B. Kaczmarski, and A.J. Fox, J. Clin. Microbiol. 38, 1747–1752 (2000).
(10) W.R. Premasiri, D.T. Moir, M.S. Klempner, N. Krieger, G. Jones II, and L.D. Ziegler, J. Phys. Chem. B 109, 312–320 (2005).
(11) W.R. Premasiri, D.T. Moir, and L.D. Ziegler, Proc. SPIE 5795, 19 (2005).
(12) W.R. Premasiri, D.T. Moir, M.S. Klempner, and L.D. Ziegler, in New Approaches in Biomedical Spectroscopy, K. Kneipp, R. Aroca, H. Kneipp, and E. Wentrup-Byrne, Eds. (Oxford University Press, New York, New York, 2007), p. 164.
(13) I.S. Patel, W.R. Premasiri, D.T. Moir, and L.D. Ziegler, J. Raman Spectrosc. 39, 1660–1672 (2008).
(14) W.R. Premasiri, Y. Gebregziabher, and L.D. Ziegler, Appl. Spectrosc. 65, 493–499 (2011).
(15) D.L. Jeanmaire and R.P. Van Duyne, J. Electroanal. Chm. 84, 1–20 (1977).
(16) J.P. Camden, J.A. Dieringer, J. Zhao, and R.P. Van Duyne, Acc. Chem. Res. 41, 1653–1661 (2008).
(17) J.Y. Zhang, J. Do, W.R. Premasiri, L.D. Ziegler, and C.M. Klapperich, Lab Chip 10, 3265–3270 (2010).
(18) A. Gopinath, S.V. Boriskina, W.R. Premasiri, L.D. Ziegler, B.M. Reinhard, and L. Dal Negro, Nano Lett. 9, 3922–3929 (2009).
(19) B. Yan, A. Thubagere, W.R. Premasiri, L.D. Ziegler, L. Dal Negro, and B.M. Reinhard, Nano Lett. 3, 1190–1202 (2009).
(20) L. Yang, B. Yan, W.R. Premasiri, L.D. Ziegler, L. Dal Negro, and B.M. Reinhard, Adv. Functional Mater. 20, 2619–2628 (2010).
(21) R.M. Jarvis and R. Goodacre, Anal. Chem. 76, 40–47 (2004).
(22) R.M. Jarvis, A. Brooker, and R. Goodacre, Faraday Discuss. 132, 281–292 (discussion 309-19) (2006).
(23) T.-T. Liu, Y.-H. Lin, C.-H. Hung, T.-J. Liu, Y. Chen, Y.-C. Huang, T.-H. Tsai, H.-H. Wang, D.-W. Wang, J.-K. Wang, Y.-L. Wang, and C.-H. Lin, PLoS ONE 4, e5470 (2009).
(24) W.R. Premasiri, J.C. Lee, R. Theberge, C. Costello, and L.D. Ziegler, "On the Molecular Origin of Bacterial SERS Spectra" (in preparation).
W.R. Premasiri and L.D. Ziegler are with the Department of Chemistry and the Photonics Center at Boston University in Boston, Massachusetts.
A.F. Sauer-Budge is with the Fraunhofer USA Center for Manufacturing Innovation in Brookline, Massachusetts and the Department of Biomedical Engineering at Boston University.
J.C. Lee is with Brigham and Women's Hospital at Harvard Medical School in Boston, Massachusetts.
C.M. Klapperich is with the Department of Biomedical Engineering, the Department of Mechanical Engineering, and the Photonics Center at Boston University.
Direct correspondence to: lziegler@bu.edu

New Study Reveals Insights into Phenol’s Behavior in Ice
April 16th 2025A new study published in Spectrochimica Acta Part A by Dominik Heger and colleagues at Masaryk University reveals that phenol's photophysical properties change significantly when frozen, potentially enabling its breakdown by sunlight in icy environments.