Rapid Determination of Trace Metals in Oil Using Handheld X-Ray Fluorescence Spectroscopy
Determination of trace metals in oil and petroleum typically is based on ICP-OES methods, requiring signficant sample preparation and expensive instrumentation. This article presents an alternative method, based on the use of a handheld energy-dispersive X-ray fluorescence analyzer, that involves minimal sample preparation, uses authentic standards for calibration, gives low parts-per-million detection limits, and provides significant time and cost savings.
Determination of trace metals in oil and petroleum products is typically based on inductively coupled plasma–optical emission spectroscopy (ICP-OES), which requires significant sample preparation and expensive instrumentation. This method, based on the use of a handheld energy-dispersive X-ray fluorescence analyzer, involves minimal sample preparation, uses authentic standards for calibration, gives low parts-per-million detection limits, and provides significant time and cost savings.
Metal contaminants in combustion engines can come from a number of sources, including oil, oil additives, and engine wear. In some cases, metals are intentionally added to oil and fuels to improve antioxidant, anticorrosive, dispersing, and anti-wear properties (1). During the refining process, metal contaminants decrease catalyst activity and selectivity, alter the product distribution (2,3), and cause auto-oxidation and decomposition of hyperoxides (4,5). In engines, metal contaminants can cause corrosion of parts such as bearings, valves, and pistons (1,6), eventually leading to engine failure (2). Early warning and appropriate corrective action are essential to improve engine performance, longevity, and cost savings (6,7). Moreover, the presence of toxic metals in automotive fuels and oils represents a potential source of environmental contamination (7–12).
As shown in Table I, a number of standard methods have been developed specifically for measuring trace metals in fuel, oil, and petroleum products. The most common methods are based on atomic absorption spectrophotometry (AAS) and inductively coupled plasma–optical emission spectroscopy (ICP-OES). These methods require significant sample preparation, which involves ashing the sample in a platinum crucible for 2–12 h, mixing with flux and heating to form a fusion, acid digestion to dissolve the residues, and dilution to a known volume (12,13). This process is labor intensive, time consuming, and expensive. In addition, the process can lead to erroneous results because of volatilization of metals or inadvertent introduction of metal contaminants from reagents and sample containers (1). After the samples are prepared, they are analyzed via AAS or ICP-OES. This process involves introduction of the sample into a nebulizer as an aqueous solution, an oil–water emulsion, a microemulsion (1), or a three-component emulsion (14,15). The use of nonaqueous solvents affects nebulization efficiency, atomization efficiency, precision, and accuracy (16), and the industry consensus is that the use of organic solvents gives erroneously low results (1). A related technique called rotrode-OES, which is based on the use of a rotating graphite disk-shaped electrode to concentrate large wear and contaminant particles and detection of specific metals via OES (17), is documented in ASTM method 6595 (18) and is widely used by the US military and postal service as a qualitative screen for metals in unfiltered oils.
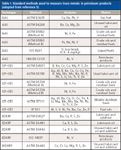
Table I: Standard methods used to measure trace metals in petroleum products (adapted from reference 5)
Energy dispersive X-ray fluorescence (EDXRF) and wavelength dispersive X-ray fluorescence (WDXRF) spectroscopy represent an alternative to the standard AAS and ICP-OES methods, and have been used to determine a variety of elements in petroleum cokes (11), petroleum oils (5,11,19,20), shale oil (21), lubricating oil (5), and residual oil (13). EDXRF systems can be purchased as benchtop instruments, portable units, or handheld analyzers. Numerous vendors have developed marketing literature based on the use of a benchtop EDXRF instrument or custom EDXRF instrument to measure trace metals in oil. It should be noted that some of this work is dated, uses nonportable laboratory-based instrumentation or obsolete products, and derives quantitative results through fundamental parameter based models (versus calibrating instrument response using authentic standards).
More recently, inductively coupled plasma–mass spectrometry (ICP-MS) (22–27) and total reflection X-ray fluorescence (TXRF) (4–6) have been used for this application. TXRF is a specialized configuration of EDXRF in which a small amount of sample is dissolved or suspended in a liquid matrix, applied to a quartz disk, dried, and analyzed as a thin film at a very low grazing angle. The use of a drying step and a low grazing angle provides detection limits that are two to three orders of magnitude lower than EDXRF methods. However, the use of small sample volumes and the various preparation steps can lead to nonrepresentative and erroneous results, respectively.
Recent developments in handheld EDXRF analyzers merit their reconsideration for elemental analysis applications (28,29). Compared to AAS, ICP-OES, and TXRF, handheld EDXRF requires much simpler sample preparation procedures and provides the convenience of handheld analysis for off-site or in-field work. The goal of this study was to develop and characterize a new handheld EDXRF method for this application based on the use of authentic standards to provide accurate quantification of V, Cr, Fe, Ni, and Zn. This article provides details for the method, analytical figures of merit (linearity, detection limits, precision, accuracy, robustness), and a comparison of results from the analysis of a set of oil samples using both handheld EDXRF and ICP-OES methods.
Methods
A total of 22 samples previously analyzed via ICP-OES were acquired from the San Francisco Branch of Inspectorate America Corporation. These samples represent a variety of matrices, including crude oil, gas oil, diesel, hydrocracked gas oil, and bunker fuels. Samples were stored in 8-oz clear glass bottles at ambient temperature.
Accurate quantification via XRF frequently requires the use of authentic standards to calibrate instrument response. Preparation of standards containing several different metals in an oil-based matrix is nontrivial and time consuming. Here, a commercially available stock multielement solution containing 500 ppm of several metals in an oil matrix (Conostan oil analysis custom blend multielement standard S-21) and metal-free oil diluent (Conostan element blank) were used to prepare a set of calibration standards (5, 10, 25, 50, and 100 ppm) via gravimetric dilution of the 500 ppm standard with the metal-free oil diluent.
Samples and standards were placed into XRF sample cells, sealed with 3.5-μm Mylar (polyethylene terephthalate) film, and mixed by hand for 1 min before analysis. Analysis was performed using an Olympus-Innov-X Delta premium model handheld EDXRF analyzer equipped with a rhodium tube, several different filters, and a silicon drift detector (SDD). Although this analyzer can be operated in handheld mode, for this work it was placed in a test stand to ensure minimal user exposure to the relatively low energy (<50 kV) and low power (50 W) X-ray tube source, and controlled from an IBM-compatible portable PC using Innov-X PC software to facilitate data acquisition and interpretation. All spectra were acquired with the analyzer set to "soil" mode using "beam 2" excitation conditions (35 kV and use of a custom filter) to give the best detection limits for the target metals of interest. All sample spectra were acquired using 2-min analysis times. Three replicate spectra were acquired for the blank, standards, and some of the samples to assess reproducibility.

Table II: Kα and Kβ energies (keV) for the five target metals
The target metals and their principal emission energies (Kα and Kβ) are provided in Table II. XRF theory and nomenclature is described in more detail elsewhere (30), but in brief K refers to the shell from which the electron was removed and the subscript refers to the shell from which an electron transitions to fill this hole (α is next higher shell and β is second higher shell). EDXRF has lower resolution than WDXRF and users need to be wary of spectral overlaps. As indicated in Table II, the Kβ fluorescence from V (5.43 keV) overlaps the Kα fluorescence from Cr (5.41 keV). These overlaps can lead to erroneous results, depending on the types and levels of elements in the sample (30).
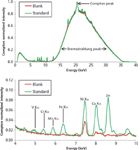
Figure 1: Full (top) and zoomed in (bottom) XRF spectra of a blank oil sample and an oil standard containing 25 ppm of several metals detectable via XRF.
Sample spectra were downloaded from the handheld EDXRF analyzer, uploaded into Microsoft Excel, and converted into the proper format (intensity in units of counts per second versus energy in units of keV). Calibration and calculation of sample concentrations was achieved using "first principles" as described below, but it should be noted that this process can be made easier by "recalibrating" the analyzer (that is, using a calibration curve that plots the analyzer-reported concentration versus the known concentration to determine an appropriate slope and offset). Peak intensities were determined by computing the maximum intensity within ±0.1 keV of the reference Kα energies of each metal shown in Table II. These intensities were normalized to that of the maximum Compton peak intensity (in the range of 20.2–20.9 keV). This procedure, commonly referred to as Compton normalization, is used to correct for variations in sample density, matrices, and orientation (30). Results from analysis of the blank and standards were used to generate calibration curves and compute metal concentrations in the samples.
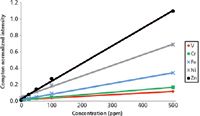
Figure 2: Compton normalized calibration curves for five target metals. R2 values for V, Cr, Fe, Ni, and Zn are 0.998, 0.999, 0.998, 0.998, and 0.998, respectively.
Results and Discussion
Representative EDXRF spectra of oil samples containing several trace metals are shown in Figure 1. The top spectrum shows a Compton peak at 20–21 keV and a broad bremsstrahlung peak in the range of 12–36 keV from the X-ray tube source. The bottom "zoomed-in" spectrum shows Kα peaks from V, Cr, Mn, Fe, Co, Ni, Cu, and Zn. The presence of Ni and Zn peaks in the blank are artifacts caused by their presence in the analyzer optical system and detector.

Table III: LODs for the five target metals
Most quantitative methods involve the preparation of a fresh set of calibration standards just before analysis. Given the limited availability and high cost of the stock solution, a single set of standards was prepared and used to calibrate the response of the handheld EDXRF analyzer throughout the 47-day course of this study. Representative calibration curves for various metals are shown in Figure 2. The use of a single set of excitation conditions gave different sensitivities for each metal, with the best sensitivity (largest slope) for Zn and slightly reduced sensitivity (smaller slopes) for metals with smaller atomic numbers. Over a one month data collection period, calibration curves consistently gave correlation coefficients (R2) values of at least 0.998 for the metals of interest, demonstrating that this method provides a good correlation between Compton normalized peak intensities and concentrations.
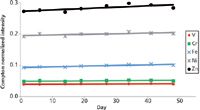
Figure 3: Plot of analyzer response for a 100 ppm standard as a function of time. The trends and small slopes demonstrate the stability of EDXRF response and standard concentrations over the duration of the study (47 days).
Limits of detection (LODs) were computed using a method similar to that employed in various Environmental Protection Agency (EPA) methods (that is, using a concentration that provides a signal-to-noise ratio of 3). Three replicate spectra of the 0, 5, and 10 ppm standards were analyzed to compute the signal-to-noise ratio of the Kα peaks for each metal. The signal was computed as the difference between the maximum Compton-normalized intensity of the Kα peak of the metal of interest within ±0.1 keV of the reference line energy of the standard and the Compton-normalized intensity of the blank at the same energy. The noise was computed from the standard deviation of the Compton-normalized intensity of the standard. Because the signal-to-noise ratios are proportional to concentration, these data can be used along with the equation above to compute the LODs, which are provided in Table III. The lowest LODs were obtained for the metal with the highest atomic number (Zn), which is consistent with the slopes in the calibration curves shown in Figure 2.
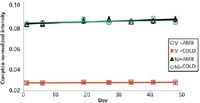
Figure 4: Plot of analyzer response for the 25 ppm standard stored at ambient conditions (AMB) and at 10 °C (COLD) as a function of time. The trends and small slopes demonstrate that EDXRF response and standard concentrations were relatively independent of temperature. %RSDs for V response at ambient and cold conditions were 2% and 4%, respectively; %RSD for Ni response at ambient and cold were 2% and 6%, respectively.
Precision, as measured by the percent relative standard deviation (%RSD) of the Compton-normalized intensity, was in the range of 2–5% for standards ranging from 5 to 100 ppm. To further evaluate reproducibility and robustness of the method, XRF response was studied as a function of time, temperature, and laboratory analyst. Figure 3 shows a plot of the Compton-normalized intensity for a 100 ppm standard over a 47-day time period. Figure 4 shows a plot of analyzer response for a 25 ppm V standard analyzed at ambient and refrigerator temperature. These data, particularly the small %RSD and lack of significant trends in response (slopes < 10-4) as a function of both time and storage temperature, demonstrate the stability of both XRF response and the standard concentration. Figure 5 shows a comparison of Ni concentration from two laboratory analysts in the four samples where it was above the LOD. These data, which correspond to differences of 2–5%, demonstrate that similar results can be achieved by different operators.
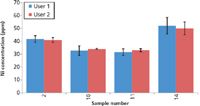
Figure 5: Results from analyses of Ni in four different samples by two analysts, demonstrating reproducibility between different users.
Results from analysis of the 22 samples were compared to those from ICP-OES, both with respect to the presence or absence of a metal and computed concentrations. For the purposes of this discussion, ICP-OES results are considered to represent the "true" values, but it should be reiterated that this method may give erroneous results as described earlier. With respect to determining the presence or absence of a metal, EDXRF results can be grouped into four categories: correct and incorrect detection (true and false positives) and correct and incorrect nondetection (true and false negatives). EDXRF correctly identified the presence and absence of the five target metals in 72% and 91% of the samples, respectively. False positives and negatives occurred in 28% and 9% of the measurements, respectively. Although these rates are rather high, it should be noted that each false positive and false negative occurred when the metal concentration was below the limit of quantification (LOQ, defined as the concentration giving a signal to noise of 10) and very close to the limit of detection. A comparison of the quantitative results is shown in Figure 6, which shows EDXRF and ICP-OES results from the determination of Ni in six samples where Ni levels were above the LOQ.
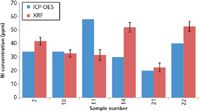
Figure 6: Comparison of ICP-OES and EDXRF results for determination of Ni in six samples containing Ni levels above the XRF LOQ.
Some discussion on these differences as well as the larger issue of the suitability of XRF for quantitative analysis is appropriate here. The differences between the EDXRF and ICP-OES results shown in Figure 6 were consistent between two operators analyzing these same samples, and can be attributed to determinate errors in the ICP-OES or EDXRF methods. The analysis of nonhomogeneous samples containing large particles or flakes of metals via XRF may yield erroneously high results because of the settling of these more dense materials to the bottom of an XRF sample cup. To get around this problem, one might use a single method (such as ICP-OES) to attempt to determine total metal concentrations in a sample or two or more methods to determine metal concentrations in filtered oil samples (for example, XRF or ICP-OES) and the composition of metal particulates (for example, rotrode-OES or scanning electron microscopy with energy dispersive X-ray spectroscopy [SEM-EDX]). Differences between the matrices and densities of the standards (prepared in an oil matrix) and samples (that is, crude oil, gas oil, diesel, hydrocracked gas oil, and bunker fuels in this study) can also cause determinate errors. This problem can be resolved using the method of standard additions, but it is often impractical to perform this type of calibration for each different sample. Despite these caveats, handheld EDXRF can be used to screen for the presence of metals in oil, monitor trends in metal concentration in oil over time, or accurate quantitative analysis (assuming that the samples are relatively homogeneous and have matrices that are similar to the standards). From a more practical point of view, once the calibration curves have been derived from authentic standards, the slope and offset can be programmed into the XRF analyzer's "soil" mode of operation so that the analyzer will directly compute and display the concentrations of various elements in the sample.

Table IV: Typical times associated with determination of trace metals via ICP-OES and XRF methods
Conclusions
To the best of our knowledge, this is the first publication in a peer-reviewed journal describing the use of authentic standards and a handheld EDXRF analyzer for determination of trace metals in oil. Relevant figures of merit include minimal sample preparation, multielement analysis, linear calibration curves, LODs in the range of 1–5 ppm, and robustness (that is, relative independence of results as a function of time, sample temperature, and operator). Although this method can also be implemented on a benchtop EDXRF system, handheld units have detection limits that are in many cases within an order of magnitude of benchtop systems and are more than adequate for monitoring low parts-per-million levels of metals in oil. Moreover, handheld systems are typically less expensive, much simpler and easier to operate, and can be used in field work. The two most important advantages of this method versus more widely accepted AAS, ICP-OES, and ICP-MS methods are its far simpler sample preparation procedures and faster analysis times. These advantages are illustrated in Table IV, which shows the approximate times required for analysis of a blank, five standards, and one sample, and Table V, which shows a more detailed comparison of various figures of merit for AAS, ICP-OES, EDXRF, and TXRF methods. Given its clear advantages with respect to analysis times, capital equipment costs, and per sample costs, handheld EDXRF should be considered as a viable and potentially better method for this application.

Table V: Figures of merit for AAS, ICP-OES, EDXRF (including handheld, portable, and benchtop units), WDXRF, and TXRF methods for determination of trace metals in oil and petroleum products. The LODs for AAS, ICP-OES, and TXRF are based on preparation of oil samples, which involves use of small sample masses and dilution.
References
(1) R.Q. Aucélio, R.M. deSouza, R.C. deCampos, N. Miekeley, and C.L. daSilveira, Spectrochim. Acta Part B 62, 952–961 (2007).
(2) R.N. Merryfield and R.C.Loyd, Anal. Chem. 51, 1965–1968 (1979).
(3) E.R. Denoyer and L.A. Siegel, Anal. Chim.Acta 192, 361–366 (1987).
(4) K.M. Bichinho, G.P. Pires, F.C. Stedile, J.H. DosSantos, and C.R. Wolf, Spectrochim. Acta Part B 60, 599–604 (2005).
(5) A. Cinosi, N.Andriollo, G.Pepponi, and D. Monticelli, Anal. Bioanal. Chem. 399, 927–933 (2011).
(6) N. Ojeda, E.D. Greaves, J. Alvarado, and L. Sajo-Bohus, Spectrochim. Acta Part B 48, 247–253 (1993).
(7) M.F. Gazulla, M. Orduña, S. Vicente, and M. Rodrigo, Fuel 108, 247–253 (2013).
(8) M. Korn, D.S. Santos, B. Welz, M.G. Vale, A.P. Teixeira, D. Lima, and S.L. Ferreira, Talanta 73, 1–11 (2007).
(9) R.M. De Souza, A.L. Saraceno, C.L DaSilveira, and R.Q. Aucélio, Anal. At. Spectrom. 21, 1345–1349 (2006).
(10) C. Hardaway, J. Sneddon, and J.N. Beck, Anal. Lett. 37, 2881–2899 (2004).
(11) H. Kubo, R. Bernthal, and T.R. Wildeman, Anal. Chem. 50, 899–903 (1978).
(12) M.F. Gazulla, M. Rodrigo, S. Vicente, and M. Orduña, X-Ray Spectrom. 39, 321–327 (2010).
(13) R.M. DeSouza, A.L. Meliande, C.L. DaSilveira, and R.Q. Aucélio, Microchem. J. 82, 137–141 (2006).
(14) A.V. Zmozinski, A. DeJesus, M.G. Vale, and M.M. Silva, Talanta 83, 637–643(2010).
(15) A. DeJesus, A.V. Zmozinski, J.A. Barbara, M.G. Vale, and M.M. Silva, Energy Fuels 24, 2109–2112 (2010).
(16) E.S. Chaves, M.T. DeLoos-Vollebregt, A.J. Curtius, and F. Vanhaecke, Spectrochim. Acta Part B 66, 733–739 (2011).
(17) J.W. Robinson, E.M. Skelly Frame, and G.M. Frame, Undergraduate Instrumental Analysis (6th ed., Decker, New York, 2005), pp. 469–470.
(18) R.A. Kishore Nadkarni, Guide to ASTM Test Methods for the Analysis of Petroleum Products and Lubricants (ASTM International, West Conshohocken, Pennsylvania, 2007).
(19) S.A. Bartkiewicz and E.A. Hammati, Anal. Chem. 36, 833–836 (1964).
(20) J.G. Bergmann, C.H. Ehrhardt, L. Granatelli, and J.L. Janik, Anal. Chem. 39, 1258–1261 (1967)
(21) C.L. Wilkerson, Fuel 61, 63–70 (1982).
(22) C. Duyck, N.Miekeley, C.L. Porto da Silveira, R.Q. Aucélio, R.C. Campos, P. Grinberg, and G.P. Brandao, Spectrochim. Acta Part B 62, 939–951 (2007).
(23) C. Duyck, N. Miekeley, C.L. Porto da Silveira, and P. Szatmari, Spectrochim. Acta Part B 57, 1979–1990 (2002).
(24) J. Heilmann, S.F. Boulyga, and K.G. Heumann, J. Anal. At. Spectrom. 24, 385–390 (2009).
(25) J.S. Pereira, D.P. Moraes, F.G. Antes, L.O. Diehl, M.F. Santos, R.C. Guimaraes, T.C. Fonseca, V.L. Dressler, and E.M. Flores, Microchem. J. 96, 4–11 (2010).
(26) R. Magarini, Spectroscopy 25(11), supplement Applications of ICP & ICP-MS Techniques for Today's Spectroscopists, pp. 30–45 (2010). Available at: http://www.spectroscopyonline.com/spectroscopy/Articles/Trace-Elemental-Determination-in-Residual-Fuel-Oil/ArticleStandard/Article/detail/697443.
(27) J. Perkel, Am. Lab. Mar. 6, 2012, http://www.americanlaboratory.com/1413-Issues/38750-March-2012/.
(28) L. Bush, Spectroscopy 26(7), 40–44 (2011).
(29) P.T. Palmer, J. Chem. Ed. 88, 868–872 (2011).
(30) R. Grieken and A. Markowicz, Handbook of X-Ray Spectrometry (CRC Press, Boca Raton, Florida, 2001).
Gabriel Chu is a graduate student in the Department of Chemistry and Biochemistry at San Francisco State University in San Francisco, California. David Guinea is an undergraduate student in the Department of Chemistry and Biochemistry at San Francisco State University. Peter T. Palmer is a professor in the Department of Chemistry and Biochemistry at San Francisco State University. Direct correspondence to: palmer@sfsu.edu
LIBS Illuminates the Hidden Health Risks of Indoor Welding and Soldering
April 23rd 2025A new dual-spectroscopy approach reveals real-time pollution threats in indoor workspaces. Chinese researchers have pioneered the use of laser-induced breakdown spectroscopy (LIBS) and aerosol mass spectrometry to uncover and monitor harmful heavy metal and dust emissions from soldering and welding in real-time. These complementary tools offer a fast, accurate means to evaluate air quality threats in industrial and indoor environments—where people spend most of their time.
AI Shakes Up Spectroscopy as New Tools Reveal the Secret Life of Molecules
April 14th 2025A leading-edge review led by researchers at Oak Ridge National Laboratory and MIT explores how artificial intelligence is revolutionizing the study of molecular vibrations and phonon dynamics. From infrared and Raman spectroscopy to neutron and X-ray scattering, AI is transforming how scientists interpret vibrational spectra and predict material behaviors.
Advancing Corrosion Resistance in Additively Manufactured Titanium Alloys Through Heat Treatment
April 7th 2025Researchers have demonstrated that heat treatment significantly enhances the corrosion resistance of additively manufactured TC4 titanium alloy by transforming its microstructure, offering valuable insights for aerospace applications.