Sequentially Shifted Excitation Raman Spectroscopy
A method for removing fluorescence-induced backgrounds from Raman spectra using sequentially shifted excitation (SSE) is described. The method uses a temperature-tuned, distributed Bragg reflector diode laser to produce the multiple excitation spectra required to implement the SSE algorithm. Examples applying the SSE method to analysis of motor oils and edible oils are given.
A method for removing fluorescence-induced backgrounds from Raman spectra using sequentially shifted excitation (SSE) is described. The SSE method generates Raman spectra in true spectral space and does not require the generation (and subsequent reconstruction) of derivative spectra used in shifted excitation Raman difference spectroscopy (SERDS). This feature of SSE Raman spectroscopy results in improved signal-to-noise ratios compared to traditional fluorescence rejection methods while providing instrument-limited bandwidth resolution. In this work, a temperature-tuned, distributed Bragg reflector diode laser is used to produce the multiple excitation spectra required to implement the SSE algorithm. Examples applying the SSE method to analysis of motor oils and edible oils are given.
Widespread use of Raman spectroscopy began shortly after the development of the argon ion laser in 1964 by William Bridges (Hughes Aircraft, Inc.). Although the adoption of Raman spectroscopy slowed with the advent and rapid adoption of Fourier transform infrared spectroscopy (FT-IR) in the early 1980s, Raman began to receive renewed interest in the 1990s with the availability of charge-coupled detectors, high-performance long-pass filters, and diode lasers. However, throughout its history, Raman has always suffered from interference because of the fluorescence of samples, impurities, and matrix components. Elimination of fluorescence interference was first effectively demonstrated by Funfschilling and Williams in 1976 (1). Based on the previous concepts using phase sensitive detection for nuclear magnetic resonance (NMR), electron paramagnetic resonance (EPR), and photoelectron spectroscopy measurements to shift signals while leaving backgrounds unshifted, the authors showed that by modulating the excitation wavelength of a tunable dye laser, the Raman signal could be recovered as a derivative signal even when Raman was not detectable with single excitation. This difference technique was later popularized as shifted excitation Raman difference spectroscopy (SERDS) by Shreve, Cherepy, and Mathies (2) in the early 1990s when it was applied to a multichannel charge-coupled device (CCD). The major drawbacks of this technique are the necessity to reconstruct the Raman spectrum from the difference spectrum, and a departure from shot noise limited performance because of the difference calculation. Originally, the reconstruction required a baseline correction followed by a Gaussian polynomial-fitting procedure. Although this required user supervision, subsequent spectral reconstruction algorithms have focused on deconvolution techniques using Fourier transforms, which strictly speaking did not require user supervision (3). However, these methods lead to the generation of noise and spectral artifacts unless appropriate smoothing functions such as apodization are applied and still require baseline correction of the derivative spectral data before convolution processing (4–6). More recently, Brady and colleagues have shown that the use of multiple excitation frequencies (>2) can dramatically enhance the extraction of Raman signals when high fluorescence is encountered (7). In this work, the authors use a bank of eight diode lasers at different wavelengths to acquire up to eight shifted spectra. The Raman is extracted using an expectation-maximization (EM) algorithm. Since the lasers are not equally separated in wavenumber, a regularization algorithm requiring some user tuning is required. Regardless, the results are impressive with the signal-to-noise ratio (S/N) of the extracted Raman spectrum increasing proportionally with the number of excitations used while keeping total integration time of the Raman spectra constant. The use of an iterative algorithm as applied in the Brady approach is computationally demanding; however, other work by Willet (8) showed that the use of wavelet filtering at each iteration stage greatly accelerated the algorithm. The use of a filtering stage required user tuning of the algorithm for different samples. Following this demonstration of multiexcitation Raman spectroscopy (MERS), De Luca and colleagues (9) introduced modulated Raman spectroscopy (MRS), where the bank of eight lasers was replaced with an external-grating tuned diode laser and the Raman difference spectrum was extracted using principal component analysis (PCA). In addition to the advantages of a simplified experimental setup, the PCA extraction (which sorts orthogonal components by variance) efficiently extracted the dominant variance (the shifting of the Raman) from the remaining variance (fluorescence, noise, fixed pattern background, and so on). Although quite impressive, the resulting Raman spectrum is still in derivative space and requires the use of reconstruction algorithms (and their requisite user-intervention) to create a Raman spectrum. In an attempt to overcome the limitations described above, we have developed a new method, sequentially shifted excitation (SSE) Raman spectroscopy, which allows efficient elimination of fluorescence in true spectral space without user intervention (10,11).
Instrumentation
The instrumentation used for this method is rather simple and has been described previously (10). In brief, the Raman spectrometer consists of an F# = 2 spectrograph with a volume holographic transmission grating and detection using a back-thinned CCD. Excitation is carried out using a distributed Bragg reflector (DBR) diode laser at 785 nm. The laser is shown in Figure 1 and was developed in conjunction with Photodigm. As shown, the laser is mounted in a hermetically sealed transmitter optical subassembly (TOSA) electronic package with a total volume of approximately 1 cm3. Within the TOSA package, the laser is mounted on an aluminum nitride micro-bench, which is soldered onto the top surface of a Peltier thermoelectric cooler (TEC). The TEC is soldered to the TOSA base. The laser also includes a thermistor that is mounted in close proximity to the DBR grating. We have previously described the advantages of using DBR lasers for Raman spectroscopy including the ability to temperature tune the laser across a broad wavelength range (>20 °C) at a fixed current without incurring mode hops (12). A microcontroller is used to control the laser temperature as well as the CCD acquisition. Because of the small mass of the laser diode and aluminum nitride (AlN) microbench, it is possible to lock-in laser shifts of >4 cm-1 in less than 100 ms. The total size of the Raman spectrometer including drive electronics is 5 × 4 × 1 in., thus, it is ideal for handheld applications. The displayed Raman spectra using this instrument were acquired using a 2-s integration period per spectrum, with six excitation shifts of the 785-nm laser, each spaced by 2 cm-1. All samples were placed in a 3-mL glass vial.
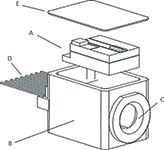
Figure 1: Design of the compact (~1 cm3 volume) 785-nm DBR diode laser. The diode laser assembly (A) consists of a DBR GaAs diode laser mounted on an AlN microbench along with a thermistor. The microbench is soldered to the top of a TEC. The assembly is sealed within a (B) TOSA electronic package with a (E) hermetically sealed lid and (C) optical window. Electrical connections to the laser are provided via (D) an electrical feed-through. The laser can be temperature tuned without mode hops across a 30 °C range while driven at 200 mA and providing >25 cm-1 of total laser shift.
Implementation of Sequentially Shifted Excitation Raman Spectroscopy
Conceptually, the SSE algorithm takes advantage of the fact that the Raman spectra correspond to the combination of Raman spectral components that shift with the laser, and non-Raman components (such as fluorescence and fixed pattern noise) that do not shift with the laser. It can be shown that there exists a shift matrix operator H such that
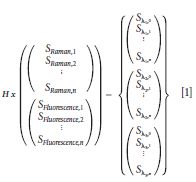
Operation by H on a single column vector containing the pure Raman spectrum followed by the spectrum of the non-Raman components (for example, fluorescence) gives a single column vector containing the experimentally acquired Raman spectra at each laser wavelength. An inverse solution to equation 1 yields both the pure Raman spectrum and the spectrum of the non-Raman spectral components. Although spectra are dispersed as a function of wavelength for dispersive instruments, traditionally Raman spectra are presented on a calibrated wavenumber axis that is linear with energy. The formulation of the operator matrix H is greatly simplified if two conditions are met: The x-axis is presented with equally spaced wavenumbers, and the separation between the laser wavelengths is an identical number of wavenumbers and is equal to an integral number of x-axis units. Condition one is maintained by splining the data to a wavenumber (cm-1) axis that does not limit the resolution of the spectrum (typically 1 cm-1), and condition two is maintained by calibrating the absolute wavenumber of the laser as a function of temperature. For a given laser, this will be a constant relationship that only needs to be determined once by plotting the wavenumber shift of a standard as a function of the thermistor temperature. From such a plot, the temperatures required for 1-cm-1 shift increments can be generated. Under these conditions, the operator matrix H for a three excitation experiment can be defined as follows:

where the superscript R denotes sub-matrices that operate on the pure Raman components, and the superscript F denotes submatrices that operate on the non-Raman (fluorescence) components. Since the non-Raman components do not shift with small wavenumber shifts of the laser excitation, the HF submatrices are simply the identity matrix. This is also true for HRλ1 since the first Raman spectrum is unshifted (that is, all other spectra are shifted relative to it). Thus, for the simple three laser case, the two shift matrices are simply
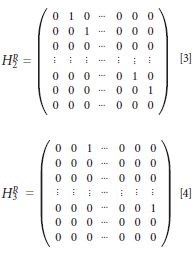
where each laser is separated by 1 cm-1, the total number of spectral data points is equal to n, and each spectral data point is separated by 1 cm-1. To maintain a high signal-to-noise ratio outcome another condition must be placed on the experiment: The total shift in excitation must be greater than or equal to the full width at half maximum (FWHM) of the spectral data. Also, to ensure that minimum bandwidth is obtained, a final condition is that each individual shift must be less than the FWHM. Thus, for the present instrumentation, which has a resolution of 10 cm-1, these final two requirements can be met by using 10 laser wavelengths (each separated by 1 cm-1), or five laser wavelengths (each separated by 2 cm-1), or four laser wavelengths (each separated by 3 cm-1), . . . and so on. If the separation between lasers is m × 1 cm-1, then the corresponding shift matrices would need to exhibit a shift of m (as opposed to the 1 cm-1 shift shown in equations 3 and 4). Since a large number of the submatrices are the identity, and all submatrices are sparse and consist of the elements of 1 or 0, an iterative inverse solution exists that is not computationally intensive and converges rapidly. We have previously described this solution and its convergence follows a standard spectral entropy minimization (10,13). Although we have used 1 cm-1 in describing the SSE implementation, any spectral point separation that maintains resolution is acceptable.
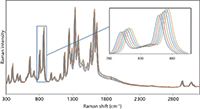
Figure 2: Six Raman spectra of acetaminophen acquired by shifting the DBR laser by a constant interval of 2 cm-1. The inset shows an expanded region of the overlaid spectra for clarity. Each spectrum was acquired with a 2-s integration period with an incident optical power of 45 mW at the sample.
Examples of SSE Raman Spectroscopy
Figure 2 shows spectra of acetaminophen acquired using six different excitation energies of a 785-nm laser. Each excitation is separated by 2 cm-1. As described above, the temperature change required to cause a 2-cm-1 shift varies with laser wavelength, and in general it requires about ~1 °C/cm-1 of shift. The resulting Raman spectrum after applying the SSE algorithm is shown in Figure 3, along with the spectrum of acetaminophen acquired using an FT-Raman spectrometer with 1064-nm excitation. Although the resolution of the dispersive Raman approach (10 cm-1) is lower than that of the FT-Raman approach (4 cm-1), the spectral features coincide even for the very low intensity combination and overtone bands (see inset Figure 3). In addition, the weak fluorescence background in the original Raman spectra (Figure 2) is now absent. The difference in relative intensity between the two spectrometers is because of the response differences of the CCD (dispersive Raman) and the InGaAs (FT-Raman) detectors. This is particularly evident in the C-H stretching region where the CCD quantum efficiency decreases dramatically. Both spectra give similar signal-to-noise despite the SSE spectrum having 1/10 the integration time and 1/10 the laser power.
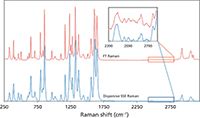
Figure 3: A comparison of (top) an acetaminophen spectrum collected using a Bruker MultiRam FT-Raman spectrometer (4-cm-1 resolution; 120-s total integration time; and 450-mW sample-incident optical power) with (bottom) an acetaminophen spectrum obtained by treatment of the shifted spectra shown in Figure 2 with the SSE algorithm (10-cm--1 resolution; 12-s total integration time; and 45-mW sample-incident optical power). The insets show an expanded overtone-combination spectral region.
A more challenging set of samples is presented in Figure 4, where the dispersive Raman spectra of grape seed oil and olive oil are shown. The fluorescence for both samples is very intense, and as shown in the inset, the low wave-number region (500–750 cm-1) shows no Raman peaks above the fluorescence background. The SSE Raman of the same samples are shown in Figure 5, and as can be seen, the fluorescence background is not only removed, but the Raman peaks in the 500–750 cm-1 range are extracted with a high S/N (see inset in Figure 5). A final example is provided for commercial motor oils in Figure 6. The spectra for the two oils appear to be indistinguishable. However, as shown for the SSE Raman spectra of the oils in Figure 7, there are several weak Raman bands that can be observed and used to distinguish the two oils.
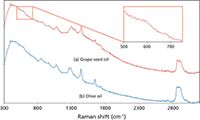
Figure 4: Dispersive Raman spectra at 785 nm of (a) grape seed oil and (b) extra virgin olive oil. The inset shows an expanded region of the grape seed oil spectrum where Raman is not discernible.
Conclusions
SSE Raman spectroscopy provides a way to obtain pure Raman spectra even in the presence of intense fluorescence without the need to take derivative spectra that must be reconstructed. The ability to generate Raman spectra in true spectral space as opposed to derivative space allows spectra to be obtained without requiring user intervention. Coupled with the improved signal-to-noise ratio, this is a distinct advantage over SERDS. By ensuring that each excitation shift is less than the FWHM of the Raman bands, the native bandwidth of the instrument is maintained. DBR diode lasers provide an inexpensive way to obtain reliable and rapid shifting of the laser in an extremely small package.
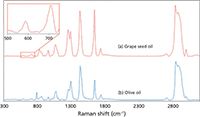
Figure 5: SSE Raman spectra of (a) grape seed oil and (b) extra virgin olive oil. The inset spectral region for the grape seed oil spectrum is identical to the inset spectral region shown in Figure 4, but now the Raman peaks are easily observed.
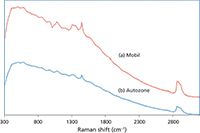
Figure 6: Dispersive Raman spectra at 785 nm of (a) Mobil 1 0W-20 synthetic motor oil and (b) AutoZone conventional 10W-30 motor oil. The oils are almost indistinguishable.
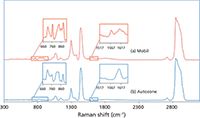
Figure 7: SSE Raman spectra of (a) Mobil 1 0W-20 synthetic motor oil and (b) AutoZone conventional 10W-30 motor oil. The insets show expanded regions comparing subtle differences between the Raman spectra that allow the oils to be easily distinguished.
References
(1) J. Funfschilling and D. Williams, Appl. Spectros. 30, 443–446 (1976).
(2) A.P. Shreve, N.J. Cherepy, and R.A. Mathies, Appl. Spectros. 46, 707–711 (1992).
(3) J. Zhao, M.M. Carrabba, and F.S. Allen, Appl. Spectros. 56, 834–845 (2002).
(4) P.A. Mosier-Boss, S.H. Lieberman, and R. Newberry, Appl. Spectros. 49, 630–638 (1995).
(5) I. Osticioli, A. Zoppi, and E.M. Castellucci, J. Raman. Spectrosc. 37, 974–980 (2006).
(6) I. Osticioli, A. Zoppi, and E.M. Castellucci, Appl. Spectros. 61, 839–844 (2007).
(7) S.T. McCain, R.M. Willet, and D.J. Brady, Opt. Express. 16, 10975–10991 (2008).
(8) R.M. Willet, IEEE International Conference (2007).
(9) A.C. De Luca, M. Mazilu, A. Riches, C.S. Herrington, and K. Dholakia, Anal. Chem. 82, 738–745 (2009).
(10) J.B. Cooper, M. Abdelkader, and K.L. Wise, Appl. Spectros. 67, 973–984 (2013).
(11) J.B. Cooper, S. Marshall, R. Jones, M. Abdelkader, and K.L. Wise, Appl. Optics. 53, 3333–3340 (2014).
(12) J.B. Cooper, P.E. Flecher, S. Albin, T.M. Vess, and W.T. Welch, Appl. Sectros. 49, 1692–1698 (1995).
(13) S. Mallat, A Wavelet Tour of Signal Processing, 2nd Edition (Academic Press, 1999, ISBN 0-12-466606-X), p. 530.
John B. Cooper, Richard W. Jones, and Sarah Marshall are with the department of chemistry and biochemistry at Old Dominion University in Norfolk, Virginia. Kent L. Wise is with SGS North America in The Woodlands, Texas. Direct correspondence to: jcooper@odu.edu

AI-Powered SERS Spectroscopy Breakthrough Boosts Safety of Medicinal Food Products
April 16th 2025A new deep learning-enhanced spectroscopic platform—SERSome—developed by researchers in China and Finland, identifies medicinal and edible homologs (MEHs) with 98% accuracy. This innovation could revolutionize safety and quality control in the growing MEH market.
New Raman Spectroscopy Method Enhances Real-Time Monitoring Across Fermentation Processes
April 15th 2025Researchers at Delft University of Technology have developed a novel method using single compound spectra to enhance the transferability and accuracy of Raman spectroscopy models for real-time fermentation monitoring.
Nanometer-Scale Studies Using Tip Enhanced Raman Spectroscopy
February 8th 2013Volker Deckert, the winner of the 2013 Charles Mann Award, is advancing the use of tip enhanced Raman spectroscopy (TERS) to push the lateral resolution of vibrational spectroscopy well below the Abbe limit, to achieve single-molecule sensitivity. Because the tip can be moved with sub-nanometer precision, structural information with unmatched spatial resolution can be achieved without the need of specific labels.