Surface-Enhanced Raman Spectroscopy: From Concept to Practical Application
Spectroscopy
In the last decade, numerous SERS substrates have been developed, but it is difficult to compare and validate their plasmonic performance. In this overview, the authors discuss the three physical parameters of any new SERS platform that must be measured-morphological characterization, optical scattering (far-field response), and near-field properties-and future prospects for the development of new SERS platforms.
Surface-enhanced Raman spectroscopy (SERS) is broadly used in various research fields ranging from biochemistry to art conservation science. The SERS phenomenon is based on localization and amplification of photons by localized surface plasmon resonances (LSPRs) of noble metals. Over the past decade, numerous SERS platforms, including nanoparticles and SERS substrates, have been developed. However, because of a lack of commonly accepted standards of their spectroscopic characterization, it is nearly impossible to compare and validate their plasmonic performance. In this review, we discuss why it is important to report three physical parameters for any newly developed SERS platform: microscopic characterization and near- and far-field responses. We also provide a short overview of several newly developed SERS substrates that were created during the last decade. Finally, this review shows several intriguing examples of recently reported applications of SERS in plasmon-driven photocatalysis, art conservation, and forensics.
Surface-enhanced Raman spectroscopy (SERS) is a powerful analytic technique that is capable of detecting analytes down to the single-molecule level and providing direct molecular specific information (1–3). The discovery of SERS was based on the electrochemical work of Fleischmann and colleagues (4) that was reported in 1974. In that manuscript, the authors reported Raman spectra of pyridine adsorbed on a rough silver (Ag) electrode. It should be noted that Fleischmann and colleagues neither noticed that the Raman spectra of pyridine on Ag surface had unexpectedly high intensity nor discussed the origin of this phenomenon. Inspired by this observation, Van Duyne and Jeanmaire (5) investigated the origin of such drastic enhancement of Raman spectra. They suggested that it could be caused by electrochemical interfacial field gradient. Several years later, Van Duyne and Schatz proposed the "electromagnetic theory" of the SERS effect (6,7). It has been suggested that SERS originated from the intensity anomaly, which occurs when the sum of the dipole induced in the adsorbed molecule is added to its image in the metal, in the limit of zero separation between the two. Independently, Moskovits proposed that a localization and amplification of the incident light by surface plasmon resonances (localized and propagating) of noble metals are responsible for the high amplification of the Raman signal (8). Localized surface plasmon resonances (LSPRs) are coherent oscillations of the conduction band electrons in noble metal nanostructures (discussed later in the "Optical Scattering" section) (9–13). The LSPR drastically enhances the local electric field (E) in the vicinity of the metallic nanoparticle, which can reach 100–1000 times the incident electric field (E0), leading to enhancements of the Raman signal up to 108.
Nanoparticle-Based SERS Platforms
In the past decade, numerous SERS platforms have been developed, including nanoparticle- and substrate-based platforms. Chemically synthesized nanoparticles, both in solution and on supporting materials, have been broadly used as SERS substrates. They have been used primarily because chemically synthesized nanoparticles exhibit high enhancement factors, easy synthesis, and the possibility to tailor their sizes and geometries to fulfill particular experimental needs (14–18). During the past decade a variety of different flavors of nanoparticles have been reported, including porous nanoparticles, octopods or nanostars, octahedra, concaved and etched nanocubes, and nanocuboids (Figure 1) (14,18–22). A major drawback of nanoparticle SERS platforms is the difficulty of their large-scale fabrication. Also, precursors of their synthesis, such as cetyltrimethylammonium bromide (CTAB) and citric acid, typically remain on their surface, which commonly overcomplicates their practical applications in SERS and LSPR sensing (23,24). At the same time, the removal of these surfactants commonly leads to random aggregation and precipitation of the metallic nanoparticles, which reflects on a poor reproducibility of the provided SERS enhancement.
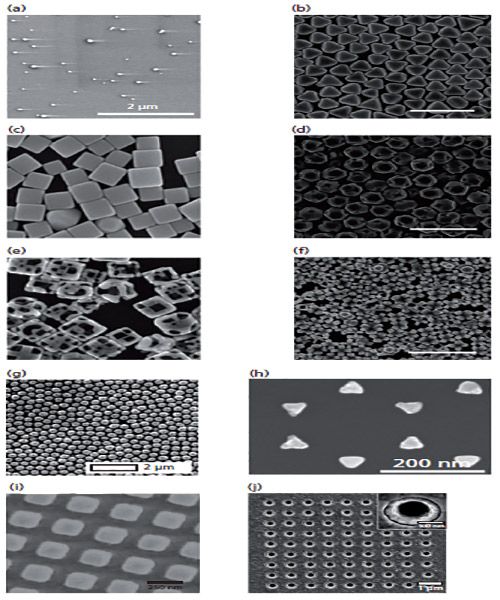
Figure 1: SEM images of nanoparticles (a–f) with different morphology: (a) nanoparticles produced by reduction of Ag ions, (b) Ag nanocubes, (c) Ag nanocubes etched by HAuCl4, (d) Ag octahedra, (e) Ag octahedra etched by HAuCl4, (f) Ag octapods etched from Ag by HAuCl4 octahedra. SERS substrates (g–j): (g) film over nanospheres (FONs), (h) periodical particle array (PPA), (i) regular array of metal structures patterned by electron beam lithography, and (j) array of plasmonic nanoholes created using lithography, atomic layer deposition (ALD), metal deposition, and anisotropic etching. Adapted from reference 15 with permission from the PCCP Owner Societies.
An interesting approach of "surfactant free" nanoparticle synthesis was discovered by Leopold and Lendl (25). It has been demonstrated that a reduction of silver nitrate with hydroxylamine at alkaline pH and at room temperature yielded highly sensitive SERS colloids within a short time. Variations in the mixing order and rate of the two involved solutions, silver nitrate and hydroxylamine hydrochloride containing sodium hydroxide, allow for control of the size and dispersion of the produced colloids.
There are also many different strategies to controllably assemble nanoparticles, ranging from simple modulation of electrostatic interactions between colloids to functionalization of nanoparticles with DNA and small organic molecules (26–28).
SERS Substrates
Based on the fabrication techniques used, there are several types of SERS substrates. One example is lithographic substrates that are characterized by well-defined nanostructures at specific locations on the substrate and hence achieve high SERS enhancement factors (typically, 106–108) (29–31). One of the most well-developed types of lithographic substrates is periodic particle arrays, which are fabricated by metal evaporation on a mask of close-packed silica or polystyrene spheres (30,32,33). The resulting surface is referred to as metal film-over-nanospheres (FONs) (Figure 1g).
Alternatively, a silica or polystyrene sphere mask, with metal deposited on the top, can be removed by pealing (Figures 1h and 2). The remaining surface will contain triangular nanostructures, known as periodical particle arrays (PPAs). If glass or quartz coverslips were used as the support for silica or polystyrene spheres, PPA SERS substrates would be transparent. Such transparent SERS substrates were found to be advantageous for numerous experimental applications if an epi (bottom)-illumination Raman system was used for spectral acquisition (34,35).
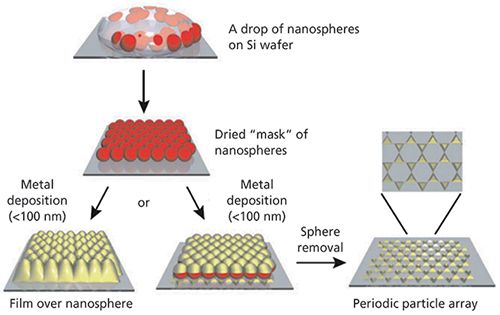
Figure 2: Schematic representation of the nanosphere lithography process for fabricating a metal film over nanospheres and periodic particle arrays of metal nanotriangles.
Electron beam lithography (EBL) is also commonly used to fabricate arrays with various shapes with tunable interparticle distances (Figures 1i and 1h) (36,37). However, the high labor intensity and time consumption of EBL-based substrates and high fabrication costs limit their broad- and large-scale utilization (31). The fabrication of nonlithographic substrates is commonly carried out through thermal evaporation of plasmonic metals on a glass or silicon substrate (34). This fabrication results in the generation of nanometer-scale plasmonic features (38,39). Although the fabrication of nonlithographic substrates, such as metal islands or porous films, is relatively facile, it is practically impossible to control the nanostructure geometry and architecture, and, consequently, their uniformity.
A hybrid of nanoparticle and substrate was proposed in the 1980s (40–42) and recently commercialized (43,44), in which paper or fabric is used to anchor and assemble nanoparticles (Figure 3). These SERS substrates have been demonstrated to be very promising platforms for the detection and identification of various chemical and biological analytes, providing detection down to the nanogram and femtogram levels (43).
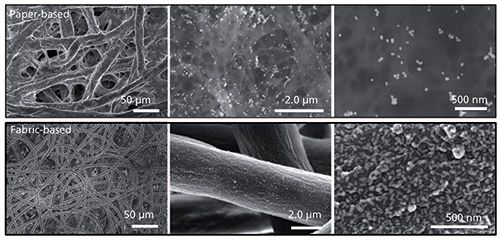
Figure 3: SEM images of commercially available paper- and fabric-based 3D SERS substrates. Adapted from reference 10 with permission from The Royal Society of Chemistry.
It was demonstrated that nanoparticles could be deposited on the substrates using simple ink-jet printers, which drastically decreases their production costs and enables on-site fabrication (43,45). During this process, nanoparticles penetrate down through the paper's or fabric's fibers and form different aggregates on their surfaces (Figure 3). Therefore, these substrates can be considered as the first three-dimensional (3D) SERS platforms. Consequently, in the past decade, 3D SERS substrates gained enormous popularity in various fields ranging from analytical chemistry to biology (15,46–48). However, the feasibility of their large-scale production remains unclear. Finally, it has been noticed that insects have highly periodic structures on their wings. Deposition of metal on such nature-built masks provides cheap and highly uniform SERS substrates (49,50).
Spectroscopic Properties of SERS Substrates
There are no commonly accepted standard procedures for substrate or nanoparticle characterization, as well as criteria to which the newly developed SERS platforms should be compared. As a result, it becomes extremely challenging to compare the substrates and nanoparticles discussed above and, consequently, fully recognize their spectroscopic properties. Recently, it has been proposed to report the following physical characteristics of newly developed SERS platforms:
- morphological characterization,
- optical scattering (far-field response), and
- near-field SERS properties (51).
The proposed set of three measurements is very logical and truly represents the minimum physical characterization that is required to evaluate spectroscopic performance of any SERS platform. For instance, morphological characterization is necessary to understand the substrate uniformity and nanoparticle composition. Far-field measurements are required to reveal LSPRs, which determine the near-field properties of the substrate. Far-field response also indicates how broad the expected near-field response can be of a particular substrate. At the same time, near-field measurements are required to unravel the enhancement factor (EF) (discussed below) of the substrate and understand the fundamental physics that lie behind the electromagnetic and chemical mechanisms of the substrate enhancement. The following sections demonstrate, in detail, what information one will obtain by determining each of these physical properties.
Morphological Characterization
Morphological characterization is commonly achieved by electron microscopy (EM) or scanning probe microscopy (SPM). Scanning electron microscopy (SEM) is typically used to investigate the morphology of SERS substrates, whereas transmission electron microscopy (TEM) can only be used for the determination of shape, size, and uniformity of nanoparticles. SPM is less commonly used for the morphological characterization of SERS substrates (Figures 1 and 3), primarily because SPM is much more labor-intensive and can be used only on relatively flat (that is, having a roughness of several micrometers) surfaces.
One may argue that morphological characterization provides very little, if any, information about spectroscopic properties of SERS substrates. For example, it is very difficult to predict the optimal enhancement wavelength for the SERS substrates shown in Figures 1 and 3 based on their morphologies (13). Nevertheless, spectroscopic properties of nanoparticles can be much more accurately predicted based on their TEM images. For instance, it is known that 80-nm Au nanoparticles will exhibit the highest EF at ~800 nm, whereas nanoprisms or nanoplates will be plasmonically active in the infrared (IR) region of the electromagnetic spectrum (11,29).
The information obtained upon morphological examination of the substrate is also often used to develop theoretical models that help to understand spectroscopic properties of SERS substrates (18,52,53). Finally, based on the microscopic examination, the substrate is classified to the particular class of substrates, such as nanoparticle-, nanohole-, or bowtie-based substrates.
Optical Scattering
Optical scattering is by far the most robust and reliable method to obtain information about plasmonic properties of SERS substrates and nanoparticles. According to the Mie theory, the extinction spectrum, E (λ), of an arbitrarily shaped nanoparticle is given by equation 1:

where εr and εi are the real and imaginary components of the metal dielectric function εin, respectively; εout is a dielectric constant of the external environment; and a is a nanoparticle radius (54). The shaper factor χ = 2 for a sphere and >2 for spheroids. For gold and silver nanoparticles, the dielectric resonance condition (εr ≈ – χ•εout) is met in the visible region of the spectrum. Therefore, noble metal nanoparticles are commonly used for the fabrication of SERS platforms.
As evident from equation 1, the LSPR also depends on nanoparticle size (16,31,55). This dependence can be simplified to the following rule: The larger the nanoparticle size is, the more to the red its LSPR will be shifted (Figure 4). One can expect that to achieve the highest EF, the excitation wavelength should match, or be close to, the LSPR. Recently, Greeneltch experimentally demonstrated that the highest EF can be obtained if the LSPR is located between the photon energy of Rayleigh and Raman photons (56). The broadness of the LSPR peak allows for estimation of the region of the electromagnetic spectrum where a decent SERS signal can be obtained.
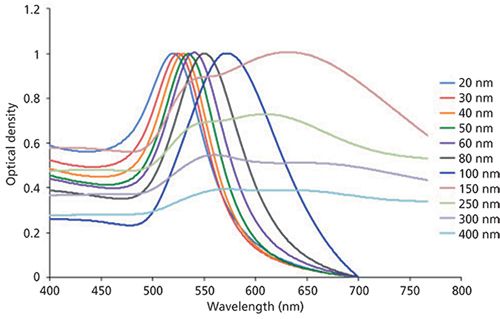
Figure 4: Dependence of the LSPR spectra on the Au nanoparticle size. LSPR red-shifts as nanoparticle size increases. Adapted with permission from Cytodiagnostics Inc., www.cytodiagnostics.com.
The Van Duyne laboratory demonstrated that the highest electromagnetic field is reached in the junction between two nanoparticles, a so called hot spot (57). Moreover, Wustholz and colleagues investigated spectroscopic properties of nanoparticles in different aggregation states (dimers, trimers, and so forth) and correlated them with TEM images of the particles (57). It has been found that EFs did not correlate with nanoparticle aggregation state. This indicated that a single hot spot between two particles was sufficient and the "extra" particles did not contribute significantly to the SERS signal.
LSPR maxima of the SERS substrate will shift upon the adsorption of a molecular analyte to the metal surface (58–60). This principle was used by the Van Duyne laboratory to develop LSPR-based sensors. Such sensors are primarily noble metal nanoparticles that can be functionalized individually to bind a variety of analytes, making it optimal for miniaturized, multiplexed sensing. A more detailed description of the LSPR-based sensors can be found in the excellent review by Sagle and colleagues (58).
At the same time, there are SERS platforms that exhibit very little if any far-field response. For instance, Kurouski and colleagues recently reported that 3D SERS substrates had extremely weak optical scattering that did not allow for prediction of their plasmonic properties (13). Moreover, observed optical scattering was dominated by signals from individual nanoparticles, whereas the plasmonic activity of the substrates was determined by nanoparticle dimers and their aggregates. Therefore, it is extremely important to determine a near-field SERS response of any newly developed SERS platform to fully understand its plasmonic properties.
Near-Field Response
Near-field response originates from both electromagnetic (EM) and chemical enhancements. EM enhancement reaches 104–108 (with theoretical predictions up to 1011), whereas chemical enhancement, also known as charge transfer, gives only (101–102). Experimentally, the near-field response is characterized by an EF as given in equation 2:

where Nvol and Nsurf are the average number of molecules in the scattering volume for the normal Raman measurement and the number of adsorbed molecules in the scattering volume for the SERS measurement, respectively. IRS and ISERS are the corresponding normal Raman and SERS intensities.
Nonresonant molecules are commonly used as the signal reporters to avoid amplification of SERS by the resonance Raman effect, which can increase the EF by 103–106. One of the most commonly used nonresonant signal reporters is benzenethiol. Benzenethiol is primarily used because it forms a monolayer on metal surfaces upon vapor or solution deposition and has a large Raman cross-section. Also, benzenethiol packing density has been previously calculated (6.8×10¹⁴ molecules/cm2). To determine the EF, the following measurements have to be performed: the dimension of the beam cone of the objective (XYZ), and normal Raman spectrum of a solution of neat benzenethiol (61). Measurements of the microscope beam cone define the surface area and solution volume that are illuminated by the laser light and consequently contribute to the collected Raman signal. Each microscope objective or a set of optics will have a different beam cone. The normal Raman spectrum of a solution of neat benzenethiol is used as a reference (equation 2).
It should be noted that EF (if calculated by equation 2) does not depend on the resonance effect since its contribution will be in both the denominator and numerator and thus is canceled out.
It is often important to measure the EF at different wavelengths to investigate the near-field profile of the SERS substrate (Figure 5). This measurement allows for the direct elucidation of broadness of the substrate plasmonic activity. Moreover, this near-field response can be correlated with the optical scattering profile of the substrate, which allows for unraveling of the fundamental relationship between the far- and near-field responses for that particular SERS substrate. Finally, it is important to measure and report a near-field response from multiple locations on a single SERS substrate, as well as on multiple fabricated batches of the substrate. This process is necessary to reveal uniformity, repeatability, and feasibility for scale-up manufacturing of any newly developed SERS platform.
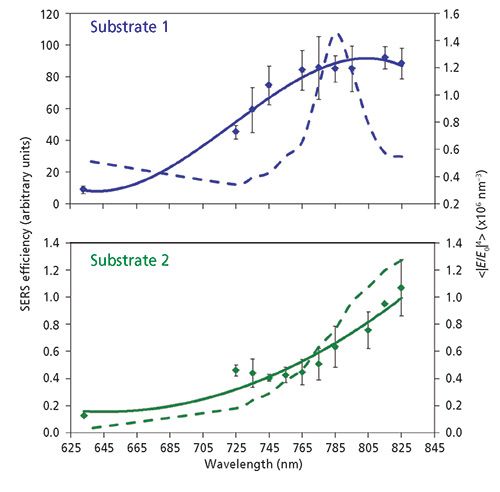
Figure 5: WS-SERES profiles of two (a) paper-based and (b) fabric-based SERS substrates. Adapted from reference 10 with permission from The Royal Society of Chemistry.
Wavelength scanned surface-enhanced Raman excitation spectroscopy (WS-SERES) is a sophisticated spectroscopic approach that allows for the successful characterization of the near-field response of SERS substrates and aggregated nanoparticles (62). It has been previously used to determine the near-field response of PPAs, nanoparticle assemblies, and 3D paper- and fabric-based SERS substrates (62–64). The 3D SERS substrates exhibited a very similar relationship between the far-field optical response and near-field surface-enhanced Raman scattering to the nanoparticle assemblies. This behavior was expected because their enhancement properties are based on nanoparticles and nanorods adsorbed in various aggregation states onto the surfaces of paper or fabric. In the 3D SERS substrates, the near-field SERS maxima are red-shifted by approximately 200 nm relative to the calculated LSPRs (13).
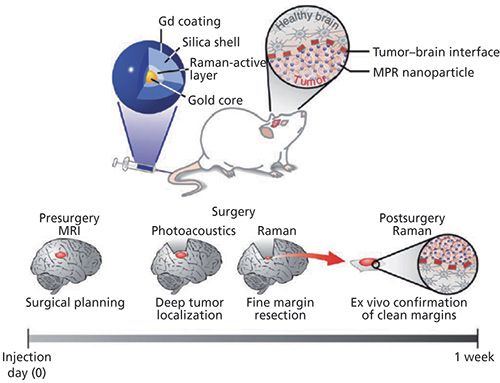
Figure 6: MCA concept based on silica-coated AuNPs with Raman-active (trans-1,2-bis(4-pyridyl)-ethylene) and MRI-active (maleimide-DOTA-Gd) layers. After intravenous injection, MCA diffuses through the disrupted blood–brain barrier and is sequestered by the tumor. MCA does not accumulate in healthy brain tissue because they are too large to cross the intact blood–brain barrier. Preoperative MRI imaging defines tumor margins, while both PA and Raman imaging, with their high resolution and deep tissue penetration, guide bulk tumor resection intraoperatively. The resected specimen can subsequently be postoperatively examined using Raman imaging to verify clear tumor margins. Adapted with permission from reference 68. Copyright 2016, Nature Publishing Group.
To summarize, we have demonstrated that only direct measurements of the morphological organization as well as far- and near-field responses of any newly developed SERS platform provide a clear understanding about its plasmonic activity. Moreover, a determination of the relationship between near- and far-field properties allows for an unambiguous elucidation of the fundamental physics that lie behind the plasmonic performance of the SERS substrate. This information can be used to tailor plasmonic properties of the SERS substrate to the particular experimental needs.
Detection Versus Quantification
The practical applications of SERS discussed above demonstrate that this analytic technique is capable of the confirmatory identification of analytes with single-molecule resolution. It also requires minimal sample amount and has the advantage of fluorescence quenching. The question to ask is whether such detection can be quantitative.
In 2015, Krämer and colleagues demonstrated that quantitative SERS could be achieved if the analyte was measured simultaneously with different concentrations of an "internal standard" (65). Using this approach, a calibration curve is built based on the known concentrations of the "standard" and then is used to determine the concentration of the analyte. In the proof-of-concept study, methyl red was used as the "internal standard" to obtain quantitative determination of the analyte of interest, Congo red. Such an approach could be used if both the internal standard and the analyte have similar or equal adsorption affinity to the metal surface. It should also be noted that vibrational "fingerprints" of the internal standard should not overlap with the Raman spectrum of the analyte (65).
Independently, Bin Ren's laboratory demonstrated that quantitative SERS could be achieved using core-molecule-shell (CMS) nanoparticles (66). In CMS nanoparticles, the molecular layer is sandwiched between the core and shell and, consequently, is not influenced by the outer environment. The shell surface can be accessed by target molecules without competition in the dynamic replacement. Finally, the molecular layer in CMS nanoparticles can be simultaneously used as the internal standard and enhancing substrate. Using 4-mercaptopyridine (Mpy) as the internal standard molecule, Shen and colleagues demonstrated that concentrations of 1,4-phenylene diisocyanide (PDI), uric acid (UA), and basic red 9 (BR9) could be quantitatively determined by CMS nanoparticles (66).
Finally, Chen and colleagues recently reported on an Ag-nanoparticle-based SERS substrate that allowed for quantitative SERS measurements at the single-molecule level (67). This result was achieved by precise control of the SERS enhancement factor and detection of a hot zone using ligand-regulated silver nanoparticle super-lattices with a built-in internal standard.
Future Perspectives
SERS has become a powerful stand-alone analytical technique that is currently utilized in various research areas ranging from art conservation science to forensics and medicine. It can be integrated with existing biosensing assays and bioimaging techniques to quantify biomarker levels and confirm a diagnosis or the efficacy of drug delivery. Because of the technique's sensitivity and the ability to detect bioanalytes, its application has expanded beyond the analytical chemistry laboratory to biomedical imaging facilities (for example, magnetic resonance imaging [MRI]) and into clinics (68). SERS is also highly efficient in the detection and identification of bacteria in urine and serum (69,70). This methodology will allow for detection of pathogenic bacteria in a very short timeframe, which is vitally important for rapid treatment of severe bacterial diseases such as sepsis.
Another interesting application of SERS is plasmonic catalysis. Recent findings demonstrate that plasmon-driven photocatalysis (PDP) is the route to concentrate and channel the energy of low-intensity visible light onto adsorbed molecules (71). PDP is based on the nonradiative Landau damping of LSPR, which results in energetic "hot" carriers: electrons above the Fermi energy of the metal or holes below the Fermi energy (72,73). It should be noted that hot refers to carriers of an energy that would not be generated thermally at ambient temperatures.
PDP can be used to enhance the rates of chemical transformations and control reaction selectivity. It can be indirect where excitation of LSPR is used to transfer photon energy to semiconductors, molecular photocatalysts, or metals and direct where coinage metal nanoparticles act as the light absorber and the catalytically active site. For instance, it has been shown that the Na desorption rate from 50-nm Na clusters strongly correlates with photon excitation wavelength (energy) (74). In 2008, Chen and colleagues (75) reported that Au nanoparticles supported on optically inert SiO2 exhibited HCHO oxidation activity under red light illumination (600-700 nm). The photocatalytic activity has been observed on both visible light active semiconductors (Fe2O3) and optically inactive supports (SiO2). Recently Christopher and colleagues showed that the rate of ethylene epoxidation (C2H4 + 1/2O2 → C2H4O) executed over Ag nanocubes supported on Al2O3 could be significantly enhanced by low-intensity visible light illumination (76). One of the most fascinating examples of plasmonic photocatalyst activity was recently reported by the Halas group. Using Al nanocrysyals, Zhou and colleagues demonstrated plasmon-driven hydrogen dissociation on their surface (73).
Conclusions
From the perspective of a substrate development, one can envision that a fabrication of SERS substrates with an EF greater than 107 is strongly desired. During the last decade, numerous research laboratories developed new SERS platforms with exotic morphology or modified currently known SERS substrates. At the same time, these new substrates often exhibit an EF on the range of 106. In this regard, it is important to question why a newly invented SERS platform is better than hundreds of previously reported ones. It is also important to work toward elucidation of the plasmonic properties of new materials, which will allow us to perform SERS in a broader range of the electromagnetic spectrum, such as in the ultraviolet (UV) and IR regions. Additionally, the replacement of Au and Ag with more economical plasmonic materials, such as Al, will decrease the substrate fabrication cost and allow their utilization in the UV region of the electromagnetic spectrum (77).
A very important issue that remains to be addressed is the repeatability of fabrication or scale-up manufacturing of SERS substrates. Whereas a fabrication of a single copy of a substrate is relatively facile, manufacturing of identical (from the perspective of their uniformity and consequently plasmonic activity) SERS platforms is a challenging task. This difficulty often reflects in poor reproducibility of acquired SERS spectra, from an industrial perspective. Therefore, one can envision that the development of a robust and highly repeatable substrate fabrication procedure will be strongly desired to broaden the applicability of SERS to pharmaceutical and other industrial applications.
References
(1) K. Kneipp, Y. Wang, H. Kneipp, L.T. Perelman, I. Itzkan, R.R. Dasari, and M. Feld, Phys. Rev. Lett. 78, 1667 (1997).
(2) S. Nie and S.R. Emory, Science 275, 1102–1106 (1997).
(3) J.A. Dieringer, K.L. Wustholz, D.J. Masiello, J.P. Camden, S.L. Kleinman, G.C. Schatz, and R.P. Van Duyne, J. Am. Chem. Soc. 131, 849–854 (2009).
(4) M. Fleischmann, P.J. Hendra, and A.J. McQuillan, Chem. Phys. Lett. 26, 163–166 (1974).
(5) R.P. Van Duyne and D.L. Jeanmaire, J. Electroanal. Chem. 84, 1–20 (1977).
(6) F.W. King, R.P. Van Duyne, and G.C.Schatz, J. Chem. Phys. 69, 4472–4481 (1978).
(7) G.C. Schatz and R.P. Van Duyne, Surf. Sci. 101, 425–438 (1980).
(8) M. Moskovits, J. Chem. Phys. 69, 4159–4161 (1978).
(9) K.L. Kelly, E. Coronado, L.L. Zhao, and G.C. Schatz, J. Phys. Chem. B 107, 668–677 (2003).
(10) D. Kurouski, I.K. Llednev, and R.P. Van Duyne, Analyst 140, 4967–4980 (2015).
(11) A.J. Haes, C.L. Haynes, A.D. McFarland, G.C. Schatz, R.P. Van Duyne, and S. Zou, MRS Bull. 30, 368–375 (2005).
(12) E. Ringe, J.M. McMahon, K. Sohn, C. Cobley, Y. Xia, J. Huang, G.C. Schatz, L.D. Marks, and R.P. Van Duyne, J. Phys. Chem. C 114, 12511–12516 (2010).
(13) D. Kurouski, N. Large, N. Chiang, N. Greeneltch, K.T. Carron, T. Seideman, G.C. Schatz, and R.P. Van Duyne, Analyst 141, 1779–1788 (2016).
(14) Q. Zhang, N. Large, and H. Wang, ACS Appl. Mater. Interf. 6, 17255–17267 (2014).
(15) J.F. Betz, W.W. Yu, Y. Cheng, I.M. White, and G.W. Rubloff, Phys. Chem. Chem. Phys. 16, 2224–2239 (2014).
(16) S.L. Kleinman, R.R. Frontiera, A.I. Henry, J.A. Dieringer, and R.P. Van Duyne, Phys. Chem. Chem. Phys. 15, 21–36 (2013).
(17) B. Sharma, R.R. Frontiera, A.I. Henry, E. Ringe, and R.P. Van Duyne, Mater. Today 15, 16–25 (2012).
(18) Q. Zhang, N. Large, P. Nordlander, and H. Wang, J. Phys. Chem. Lett. 5, 370–374 (2014).
(19) M.J. Mulvihill, X.Y. Ling, J. Henzie, and P. Yang J. Am. Chem. Soc. 132, 268–274 (2009).
(20) M. Rycenga, M.R. Langille, M.L. Personick, T. Ozel, and C.A. Mirkin, Nano Lett. 12, 6218–6222 (2012).
(21) Z. Shao, W. Zhu, H. Wang, Q. Yang, S. Yang, X. Liu, and G. Wang, J. Phys. Chem. C 117, 14289–14294 (2013).
(22) H. Jing, Q. Zhang, N. Large, C. Yu, D.A. Blom, P. Nordlander, and H. Wang, Nano Lett. 14, 3674–3682 (2014).
(23) D. Kurouski and R.P. Van Duyne, Anal. Chem. 87, 2901–2906 (2015).
(24) E. Martinsson, M.M. Shahjamali, N. Large, N. Zaraee, G.C. Schatz, D. Aili, and C.A. Mirkin, Small 12, 330–342 (2015).
(25) N. Leopold and B. Lendl, J. Phys. Chem. B 107, 5723–5727 (2003).
(26) D. Graham, D.G. Thompson, W.E. Smith, and K. Faulds, Nature Nanotechnol. 3, 548–551 (2008).
(27) R.W. Taylor, T.C. Lee, O.A. Scherman, R. Esteban, J. Aizpurua, F.M. Huang, J.J. Baumberg, and S. Mahajan, ACS Nano 5, 3878–3887 (2011).
(28) R.A. Alvarez-Puebla, R. Contreras-Caceres, I. Pastoriza-Santos, J. Perez-Juste, and L.M. Liz-Marzan, Angew. Chem. Int. Ed. 48, 138–143 (2009).
(29) P.L. Stiles, J.A. Dieringer, N.C. Shah, and R.P. Van Duyne, Ann. Rev. Anal. Chem. 1, 601–626 (2008).
(30) A.I. Henry, B. Sharma, M.F. Cardinal, D. Kurouski, and R.P. Van Duyne, Anal. Chem. 88, 6638–6647 (2016).
(31) R.J. Brown and M.J.T. Milton, J. Raman. Spectr. 39, 1313–1326 (2008)
(32) J.P. Camden, J.A. Dieringer, J. Zhao, and R.P. Van Duyne, Acc. Chem. Res. 41, 1653–1661 (2008).
(33) L.A. Dick, A.D. McFarland, C.L. Haynes, and R.P. Van Duyne, J. Phys. Chem. B 106, 853–860 (2002).
(34) J.A. Dieringer, A.D. McFarland, N.C. Shah, D.A. Stuart, A.V. Whitney, C.R. Yonzon, M.A. Young, X. Zhang, and R.P. Van Duyne, Farad. Discuss. 132, 9–26 (2006).
(35) A.B. Zrimsek, A.I. Henry, and R.P. Van Duyne, J. Phys. Chem. Lett. 4, 3206–3210 (2013).
(36) E.J. Gunnarsson, H. Bjerneld, S. Xu, B. Petronis, B. Kasemo, and M. Kall, Appl. Phys. Lett. 78, 802–804 (2001).
(37) T. Atay, J.-H. Song, and A.V. Nurmikko, Nano Lett. 2004, 1627–1631 (2004).
(38) P.F. Liao, J.G. Bergman, D.S. Chemla, A. Wokaun, J. Melngailis, A.M. Hawryluk, and N.P. Economou, Chem. Phys. Lett. 82, 355–359 (1981).
(39) C.Y. Chen and E. Burstein, Phys. Rev. Lett. 45, 1287–1291 (1980).
(40) C.D. Tran, Anal. Chem. 56, 824–826 (1984).
(41) T. Vo-Dinh, M. Uziel, and A.L. Morrison, Appl. Spectr. 41, 605–610 (1987).
(42) A. Berthod, J.J. Lasernas, and J.D. Winefordner, J. Pharmaceutical. Biomed. Anal. 6, 599–608 (1988).
(43) W.W. Yu and I.M. White, Analyst 138, 1020–1025 (2013).
(44) W.W. Yu and I.M. White, Anal. Chem. 82, 9626–9630 (2013).
(45) P. Fierro-Mercado, B. Renteria-Beleno, and S.P. Hernandez-Rivera, Chem. Phys. Lett. 552, 108–113 (2012).
(46) E.P. Hoppmann, W.W. Yu, and I.M. White, Methods 63, 219–224 (2013).
(47) W.-J. Liao, P.K. Roy, and C. Chattopadhyay, Analyst 4, 40487–40493 (2014).
(48) E.P. Hoppmann, W.W. Yu, and I.M. White, J. Select. Topics Quantum Electron. 20, 7300510 (2014).
(49) N.L. Garrett, R. Sekine, M.W. Dixon, L. Tilley, K.R. Bambery, and B.R. Wood, Phys. Chem. Chem. Phys. 17, 21164–21168 (2015).
(50) N.L. Garrett, P. Vukusic, F. Ogrin, E. Sirotkin, C.P. Winlove, and J. Moger, J. Biophoton. 2, 157–166 (2008).
(51) B. Sharma, M.F. Cardinal, S.L. Kleinman, N.G. Greeneltch, R.R. Frontiera, M.G. Blaber, G.C. Schatz, and R.P. Van Duyne, MRS Bull. 38, 615–624 (2013).
(52) M. Zhang, N. Large, A.L. Koh, Y. Cao, A. Manjavacas, R. Sinclair, P. Nordlander, and S.X. Wang, ACS Nano 9, 9331–9339 (2015).
(53) J.K. Day, N. Large, P. Nordlander, and N.J. Halas, Nano Lett. 15, 1324–1330 (2015).
(54) G. Mie, Ann. Phys. 25, 377–445 (1908).
(55) A. Zrimsek, N. Chiang, M. Mattei, S. Zaleski, M. McAnally, C. Chapman, A.-I. Henry, G.C. Schatz, and R.P. Van Duyne, Chem. Rev . 117, 7583–7613 (2017).
(56) N.G. Greeneltch, M.G. Blaber, A.I. Henry, G.C. Schatz, and R.P. Van Duyne, Anal. Chem. 85, 2297–2303 (2013).
(57) K.L. Wustholz, A.I. Henry, J.M. McMahon, R.G. Freeman, N. Valley, M.E. Piotti, M.J. Natan, G.C. Schatz, and R.P. Van Duyne, J. Am. Chem. Soc. 132, 10903–10910 (2010).
(58) L.B. Sagle, L.K. Ruvuna, J.A. Ruemmele, and R.P. Van Duyne, Nanomedicine 6, 1447–1462 (2011).
(59) A. Yang, M.D. Huntington, M.F. Cardinal, S.S. Masango, R.P. Van Duyne, and T.W. Odom, ACS Nano 8, 7639–7647 (2014).
(60) J.M. Bingham, J.N. Anker, L.E. Kreno, and R.P. Van Duyne, J. Am. Chem. Soc. 132, 17358–17359 (2010).
(61) E.C. Le Ru, E. Blackie, M. Meyer, and P.G. Etchegoin, J. Phys. Chem. C. 111, 13794–13803 (2007).
(62) A.D. McFarland, M.A. Young, J.A. Dieringer, and R.P. Van Duyne, J. Phys. Chem. C 109, 11279–11285 (2005).
(63) S.L. Kleinman, B. Sharma, M.G. Blaber, A.I. Henry, N. Valley, R.G. Freeman, M.J. Natan, G.C. Schatz, and R.P. Van Duyne, J. Am. Chem. Soc. 135, 301–308 (2012).
(64) M.D. Doherty, A. Murphy, J. McPhillips, R.J. Pollard, and P. Dawson, J. Phys. Chem. C. 114, 19913–19919 (2010).
(65) E. Kammer, K. Olschewski, S. Stockel, P. Rosch, K. Weber, D. Cialla-May, T. Bocklitz, and J. Popp, Anal. Bioanal. Chem. 407, 8925–8929 (2015).
(66) W. Shen, X. Lin, C. Jiang, C. Li, H. Lin, J. Huang, S. Wang, G. Liu, X. Yan, Q. Zhong, and B. Ren, Angew. Chem. Int. Ed. 54, 7308–7312 (2015).
(67) H.Y. Chen, M.H. Lin, C.Y. Wang, Y.M. Chang, and S. Gwo, J. Am. Chem. Soc. 137, 13698–13705 (2015).
(68) M.F. Kircher, A. de la Zerda, J.V. Jokerst, C.L. Zavaleta, P.J. Kempen, E. Mittra, K. Pitter, R. Huang, C. Campos, F. Habte, R. Sinclair, C.W. Brennan, I.K. Mellinghoff, E.C. Holland, and S.S. Gambhir, Nature Med. 18, 829–834 (2012).
(69) B.N.V. Kumar, S. Guo, T. Bocklitz, P. Rosch, and J. Popp, Anal. Chem. 88, 7574–7582 (2016).
(70) A. Walter, A. Marz, W. Schumacher, P. Rosch, and J. Popp, Lab on Chip 11, 1013–1021 (2011).
(71) M.J. Kale, T. Avanesian, and P. Christopher, ACS Catal. 4, 116–128 (2013).
(72) D.F. Swearer, H. Zhao, L. Zhou, C. Zhang, H. Robatjazi, J.M. Martirez, C.M. Krauter, S. Yazdi, M.J. McClain, E. Ringe, E.A. Carter, P. Nordlander, and N.J. Halas, Proc. Nat. Acad. Sci. U.S.A. 32, 8916–8920 (2016).
(73) L. Zhou, C. Zhang, M.J. McClain, A. Manjavacas, C.M. Krauter, S. Tian, F. Berg, H.O. Everitt, E.A. Carter, P. Nordlander, and J.J. Halas, Nano Lett. 16, 1478–1484 (2016).
(74) W. Hoheisel, K. Jungmann, M. Vollmer, R. Weidenauer, and F. Trager, F. Phys. Rev. Lett. 60, 1649–1652 (1988).
(75) X. Chen, H.Y. Zhu, J.C. Zhao, Z.F. Zheng, and X.P. Gao, Angew. Chem. Int. Ed . 47, 5353–5356 (2008).
(76) P. Christopher, H. Xin, and S. Linic, Nature Chem. 3, 467–472 (2011).
(77) N.S. King, L. Liu, X. Yang, B. Cerjan, H.O. Everitt, P. Nordlander, and N.J. Halas, ACS Nano 9, 10628–10636 (2015).
Dmitry Kurouski was with Boehringer Ingelheim Pharmaceuticals, Inc., in Ridgefield, Connecticut and the Chemistry Department at Northwestern University in Evanston, Illinois at the time this paper was accepted. He is now with the Biochemistry and Biophysics Department at Texas A&M University in College Station, Texas. Heewon Lee, Frank Roschangar, and Chris Senanayake are with Boehringer Ingelheim Pharmaceuticals, Inc. Direct correspondence to: dkurouski@tamu.edu
Geographical Traceability of Millet by Mid-Infrared Spectroscopy and Feature Extraction
February 13th 2025The study developed an effective mid-infrared spectroscopic identification model, combining principal component analysis (PCA) and support vector machine (SVM), to accurately determine the geographical origin of five types of millet with a recognition accuracy of up to 99.2% for the training set and 98.3% for the prediction set.
Authenticity Identification of Panax notoginseng by Terahertz Spectroscopy Combined with LS-SVM
In this article, it is explored whether THz-TDS combined with LS-SVM can be used to effectively identify the authenticity of Panax notoginseng, a traditional Chinese medicine.