Raman Microscopy Combined with Tensile Deformation for Understanding Changes in Polymer Morphology
We show Raman spectra of polymeric fibers acquired as a function of increasing stress and temperature. With knowledge of Raman band assignments, it becomes possible to understand, in detail, the molecular changes that are responsible for polymer orientation and crystallization.
Polarized Raman spectra of polymeric fibers are known to provide information on molecular orientation. We have long felt that it would be of interest to study spin-oriented fibers of polyethylene terephthalate (PET) in situ, under tensile stress. In this column installment, we show Raman spectra acquired as a function of increasing stress and temperature. With knowledge of Raman band assignments (such as which molecular vibrating units, in which conformations, are responsible for particular Raman bands), it becomes possible to understand, in detail, the molecular changes that are responsible for polymer orientation and crystallization. Ultimately, the goal would be to confirm (or not) certain models for polymer morphology.
Polarized Raman spectra of polymeric fibers are known to provide information about molecular orientation (1). In collaboration with Dr. Herman Noether, a retired polymer physicist from Hoechst Celanese (now deceased), we showed that the polarized spectra of a series of spin-oriented fibers of polyethylene terephthalate (PET) clearly showed the development of molecular orientation in the fibers as a function of take-up speed (2). We also showed that if the fibers had been drawn above the glass transition temperature (Tg) they exhibited crystallinity, as reflected in the width of the carbonyl band (2). In addition, we determined that fibers that are drawn at room temperature show increased orientation, but without an increase in crystallinity. We have long felt that it would be of interest to study such fibers, in situ, under tensile stress. In this installment of "Molecular Spectroscopy Workbench," we show spectra acquired as a function of increasing stress and temperature. With knowledge of Raman band assignments (such as which molecular vibrating units, in which conformations, are responsible for particular Raman bands [3]), it becomes possible to understand, in detail, the molecular changes that are responsible for orientation and crystallization. Ultimately the goal would be to confirm (or not) certain models for polymer morphology.
Before starting the measurements that will be shown, I went through my "collection" of fibers and thought it might be interesting to study the behavior of spider silk fibers under stress. Spider silk is interesting because the animal spins multiple types of fibers for different purposes. But this idea had to be tabled because the sample labeled spider silk in my drawer could not be spider silk since it had no amide I band. In addition, I contacted Professor Michel Pezolet to see if he had any material that he could spare, and he told me that some years ago he had built a tension device to study B. mori silk fibers under stress (4). In the interest of time, I decided to use fibers of amorphous polyethylene terephthalate (PET) as my sample of study; PET has the advantage of being fairly well-studied and understood. Based on my previous work, I had certain expectations of what I might see. So for those of you who follow my work, I apologize that I am working yet again on PET. On the other hand, because we know so much about this material, interpretation of the results has the potential to contain less conjecture.
Description of the Sample and Measurement Conditions
The fibers that I used were totally noncrystalline. PET is known to crystallize at a temperature near 90 °C, a value that is somewhat dependent on the history of the sample. We also know that we can increase the orientation by drawing the fibers, even at room temperature. A 1–2 in. segment of a 19-fiber bundle of amorphous PET fibers was teased apart and mounted in the tensile chuck of a Linkam TST350 stage (Linkam Scientific Instruments), which can take a sample to a temperature as high as 350 °C. I mounted the fibers in the chuck and then either varied the distance between the plates of the chuck or the temperature (while maintaining tension on the fibers). Initially, I measured the full polarization spectra (ZZ, RR, RZ, and ZR) for a fiber that had been oriented to confirm that the Raman system was doing what was expected. The fiber was fixed on the stage, and the laser polarization and Raman analyzer were controlled to select conditions. The measurements were made on an Evolution Raman microscope (Horiba Scientific), using a 1800-g/mm grating in an 800-mm focal length spectrograph, so that I would have the capability of monitoring small frequency shifts, if they occurred. Because this grating produces significant dichroism, a scrambler was mounted behind the analyzer. For a full explanation of the requirements to make this type of measurement, refer to one of my previous columns (5).
Figure 1 shows the ZZ, RR, ZR, and RZ spectra of a fiber in the tensile stage under conditions where the sample exhibited "necking," and the spectra were measured in the necking region. Necking is a phenomenon that occurs when these fibers are subjected to stress, and the material yields. In fact, we recorded the load measured by the stage and found that for the most part the load did not change as the chuck was separated, because of yielding, as exhibited by necking. For these measurements, unfortunately, we do not know how to calculate the actual load on the fibers examined because we do not know how many of the fibers in the bundle were actually captured in the chuck. (In the future, a small number of fibers needs to be mounted and confirmed to have been captured). So we are currently showing these measurements for proof of principle, not to be quantitative.
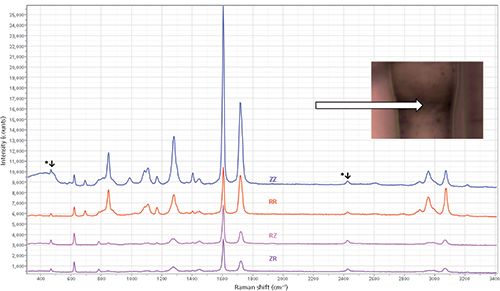
Figure 1: Polarized spectra of a partially oriented PET fiber mounted in a tensile stage. The laser polarization was either vertical (Z in this configuration) or horizontal (radially oriented to the fiber). An analyzer behind the microscope selected either the Z or R polarization, and a scrambler behind the analyzer compensated for differences in the instrument responses for the two polarizations. (The bands marked with an asterisk (*) are Hg plasma lines from the fluorescent lamps in the lab.)
The top spectrum in the figure was recorded with both the laser and the Raman analyzer parallel to the Z-axis. The next spectrum from the top has both the laser and the Raman analyzer perpendicular to the Z-axis. (I have consistently referred to this direction as R, even though it is not a nomenclature that has been adopted. I use R because the fibers are clearly uniaxial and are best described in cylindrical coordinates, whereas X or Y imply something about crystallographic axes.) The two bottom spectra, RZ and ZR, should be equivalent except under some very unusual conditions that are not relevant for this sample. The spectra are clearly equivalent, which means that these conditions compensate for the possible instrumental artifacts of my conditions. In addition, you can see that bands at about 630 and 780 cm-1 have higher intensities in the off-diagonal spectra (ZR and RZ) than either of the diagonal spectra (ZZ and RR), which is consistent with the group theoretical predictions for this material (2).
Temperature-Dependent Series of Measurements
In this section, we discuss spectra of a fiber fixed in the tensile stage and measured as a function of temperature. Figure 2 shows the ZZ and RR spectra of a fiber fixed in the stage and measured at 40 °C and 90 °C. Even though I did not adjust the tension, you can see the development of orientation by examining the change in the ZZ:RR spectral ratios.
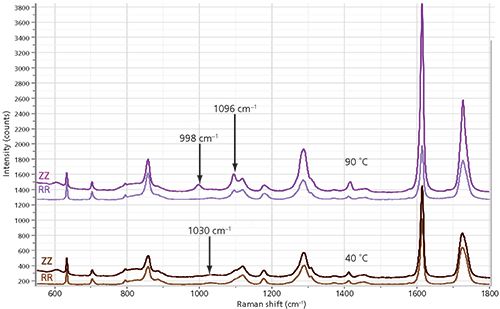
Figure 2: ZZ and RR spectra of a fiber fixed in the tensile chuck and recorded at 40 °C (bottom) and 90 °C (top).
I believe that the ratio increased with temperature because there has been yielding of the fiber. I did notice that the diameter of the fiber decreased, but unfortunately I did not measure it. However, I did record the measured tension, which decreased from 0.67 N to 0.42 N during the measurements. Clearly, a more thorough set of measurements should be done on a small set of fibers known to be fixed in the chuck so that there would be better control of the tension, measuring both in the narrowed region and the region that has not yielded. In addition to the development of molecular orientation as seen in the ZZ:RR ratio, especially in the aromatic band at 1615 cm-1, you can see clear changes in the region of the C-C and C-O bands between approximately 900 and 1200 cm-1. The significant changes for which we have some interpretation are highlighted with arrows in Figure 2. As the fiber develops orientation, the band at approximately 1030 cm-1, which is unpolarized, is replaced by a polarized band just under 1000 cm-1. The band at 1100 cm-1 is seen only as a shoulder in nonoriented material. Even the earliest articles discussing the vibrational spectra of amorphous versus crystalline PET considered the role of gauche and trans configurations in the glycol linkages; normal modes composed of C-C and C-O bonds would clearly arise from the glycol linkage (6). Examination of the carbonyl band at approximately 1725 cm-1 indicates that it has narrowed in the spectrum recorded at 90 °C, which is consistent with the understanding that the width of the carbonyl is a marker for crystallinity (7).
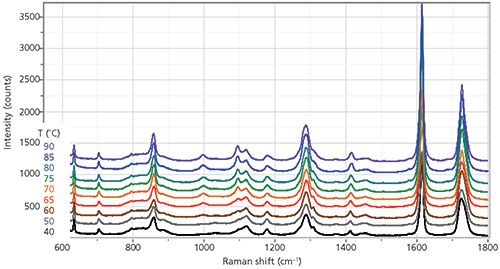
Figure 3: ZZ spectra of fiber recorded as a function of temperature.
The following figures follow these changes in more detail. Figure 3 shows the entire fingerprint spectrum for this fiber held at 40, 50, 60, 65, 70, 75, 80, 85, and 90 °C. The changes near 1000 and 1100 cm-1 occur continuously even though the glass transition temperature (Tg) is close to 90 °C at the end of the range measured; this result means that whatever is responsible for these changes is not crystallization. In addition, the width of the carbonyl band near 1730 cm-1 is decreasing with temperature.
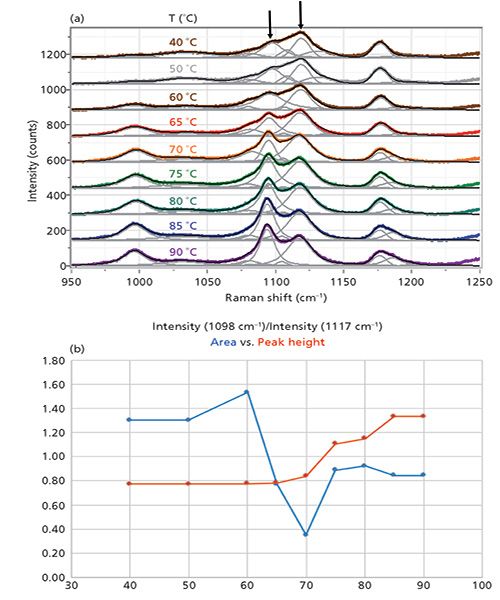
Figure 4: (a) ZZ spectrum as a function of temperature and band-fitted. (b) Peak ratio of bands at 1098 to 1117 cm-1. Both peak height values and peak areas are plotted.
Figure 4 shows the important region between 950 and 1200 cm-1 of the ZZ spectrum as a function of temperature, after band-fitting the various components. The peak positions are not labeled in the figure because the figure becomes too busy with those labels. As an alternative, the band-fitted peaks are tabulated in Table I.
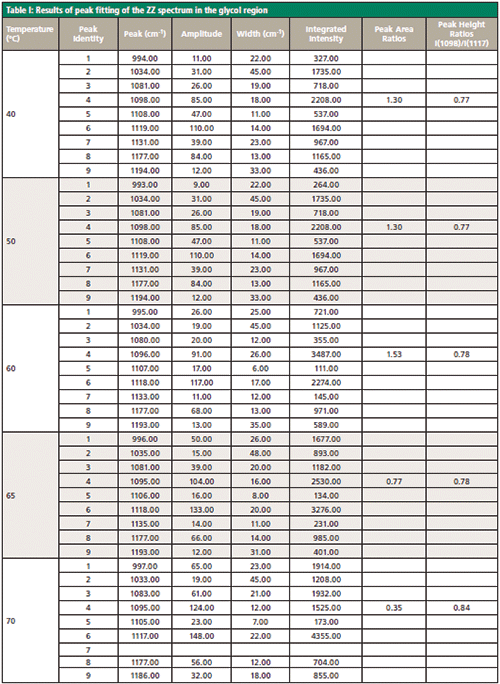
The arrows are placed to draw attention to the band just below 1100 cm-1 whose intensity is increasing with temperature (relative to the common band at about 1120 cm-1). Because the results of the fitting procedure can be imported into Excel, the behavior of the fitting parameters can be plotted as a function of temperature. Figure 4b shows the ratios of peak areas and peak heights (1098 cm-1 versus 1117 cm-1) as derived from the band-fitting. Clearly, the peak height values better reflect what one "sees" in the data, although more sophisticated mathematical algorithms such as principal component analysis or two-dimensional spectroscopy may reveal other behavior that may be of relevance to understand the morphological changes in these fibers.
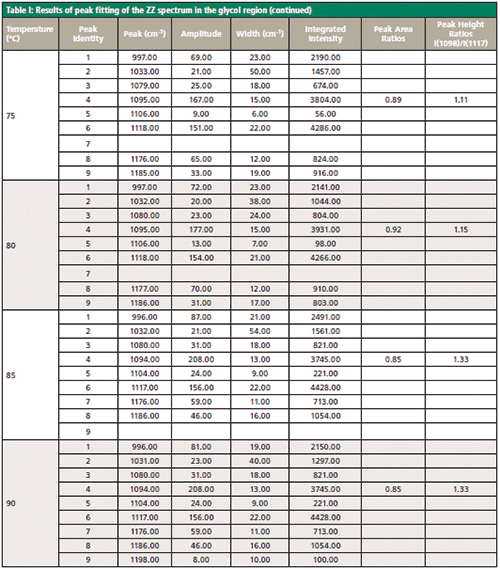
Figure 5 shows both the ZZ and RR spectra between 1550 and 1800 cm-1 as a function of temperature. The ZZ spectra show clear evidence of sharpening of the carbonyl band at 1725 cm-1 in the ZZ spectra from 70 °C and higher.

Figure 5: Expanded view of the ZZ and RR spectra in the higher frequency range for the aromatic and carbonyl bands.
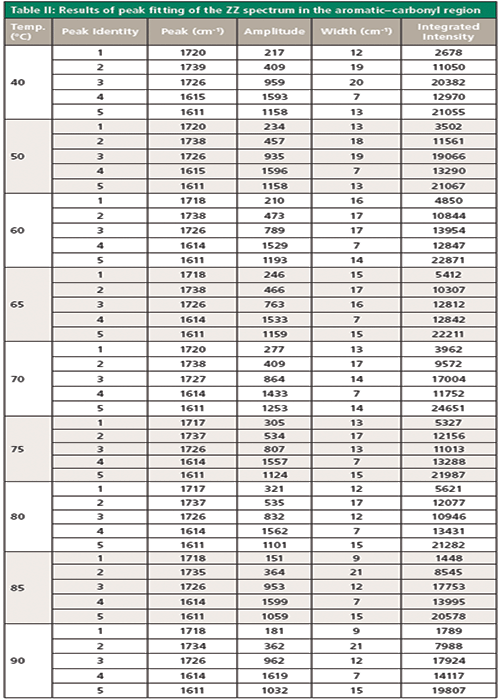
The band-fitted ZZ spectra of this region are shown in Figure 6. The peak positions again are not labeled in the figure because the figure becomes too busy with those labels, but the results of the fitting are shown in Table II. However, visual inspection of Figure 5 does yield some interesting qualitative information. The aromatic band near 1615 cm-1 is well fit by two components-one sharper than the other-and their relative contributions do not seem to change much with temperature. The carbonyl band is fit by three bands; the biggest change occurring with temperature is the sharpening of the central component. Figure 6 shows the behavior for the integrated intensities and the halfwidths of the components of the carbonyl line, plotted in Excel. The only parameter that shows a clear definitive trend is that of the width of the central carbonyl band at 1725 cm-1. The behavior of the other parameters may be meaningful, but some effort must be made to tease out the meaning.
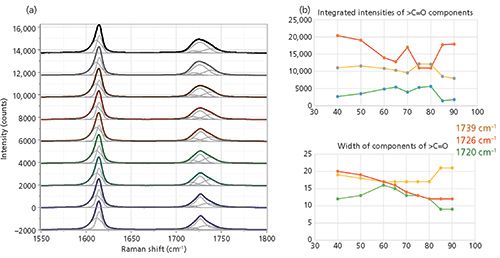
Figure 6: (a) ZZ spectra of the aromatic and carbonyl bands as a function of temperature, band-fitted to two bands in the aromatic region and three bands in the carbonyl region. (b) Integrated intensities of components of the carbonyl band (top) versus the widths of the components of the carbonyl band (bottom).
Strain-Dependent Series of Measurements
Measurements of a given fiber as a function of strain were less easy to control because the polymer was yielding during the measurement. Figure 7 shows a series of measurements recorded at room temperature in a necking region, and taken as a function of opening of the tensile chuck; at each position of the chuck a series across the neck was recorded. What is clear is that there are molecular changes occurring during the first two series of measurements but after that, the sample seems to have stabilized; that is, the region over which the measurements were made is no longer yielding. The amount of time involved is about 7 min at each position of the chuck; (there were 44 spectra recorded at 5 × 2 s each). What is curious is that in the first two series (4500 and 4700 µm) the peaks at 1000 and 1098 cm-1 increase in intensity, but then diminish in intensity in the later series at higher strains. It is almost as if the band at 1098 cm-1 represents a metastable state in the strained polymer that can disappear unless it is locked in by crystallization. This result is consistent with an expected initial increase in noncrystalline orientation, followed by a decrease of the same (8).
Discussion and Conclusions
An understanding of the morphology of PET has to be based on modeling of the rotations of the single bonds in the glycol linkage, and of the conformation of the carbonyl groups around the aromatic ring. Important aspects of a sample's history include whether the sample was drawn or extruded and to what temperatures it had been exposed, both while under stress and not. The drawing process tends to align the glycol atoms in their trans configuration (that is, reduce the number of gauche conformers), and heat treatment under strain tends to lock those configurations. Over the years, various authors have proposed how to use the Raman spectra of PET in terms of the various possibilities for its molecular configuration.
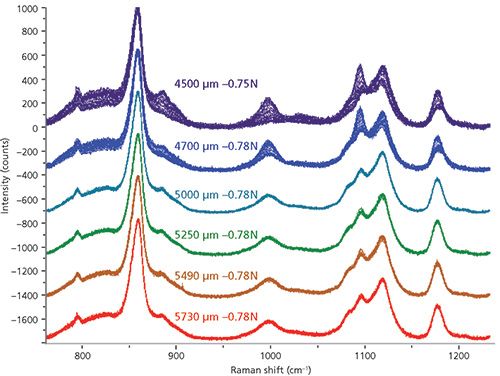
Figure 7: Measurements across a necking region taken as the distance between the vises in the chuck were increased (top to bottom). Note that the recorded tension did not change appreciably even though the fibers were being drawn, an observation that indicates that the polymer was yielding.
Melvegar's assignment of the carbonyl bandwidth to crystallinity in 1972 is actually based on the polymer density, which is assumed to be higher in the crystalline phase than the amorphous phase (6). However, to draw his conclusions, he does point out that the amorphous density has to be constant. He rationalizes the sharpening of the carbonyl line to the resonance stabilization of the π electrons in the >C=O bond with the π electrons in the ring. In fact, some later authors point out that the density of amorphous, oriented PET may be similar to that of the crystalline material.
The key to understanding the conformational changes that occur during the extrusion or drawing processes is to follow the gauche-to-trans rotational isomerization of the ethylene glycol units. As early as 1976, Boerio and Bahl recognized that "the crystallization process of PET was complex, involving both trans–gauche isomerization in the ethylene glycol segments and changes in the symmetry and resonance characteristics of the substituted benzenoid structure" (3). A detailed discussion of the various possibilities for trans and gauche conformations at the single bonds, and for cis and trans alignments of the carbonyl groups on either side of the aromatic ring appeared in 1982 (9) and has been cited in later publications. Presumably, there is a decrease in gauche with an increase in trans conformers during alignment. The changes that occur between 700 and 1150 cm-1 are attributed to these conformational changes (5,10). The gauche line at 1030 cm-1 is nonpolarized and decreases in intensity in oriented fibers. The line at 998 cm-1 is attributed to the O-CH2 and C-C stretch in the trans form, and appears only in oriented fibers, in the ZZ spectrum, with intensity increasing with orientation. Similarly, the trans line at 1100 cm-1 grows with orientation.
A careful reading of the 1976 Purvis and Bower publication indicates why the aromatic band at 1614 cm-1 is the best marker for orientation (6). This line involves only motion of the atoms in the aromatic ring and its Raman tensor can be approximated by invoking cylindrical symmetry about the C1–C4 direction. However, with respect to the samples they examined, they state (6),
The present samples are of low crystallinity and the increase in density has been ascribed primarily to an increase in amorphous density with orientation. Such a densification may be possible without an appreciable increase in the content of planar trans terephthaloyl residues, which necessarily occurs on crystallization, and it seems reasonable to conclude that the width of the line may be more related to the crystallinity than to the density, as suggested by Melveger.
The results in our column show that the ZZ to RR intensity of a fiber increases with tension or with heating under tension, which is easily interpreted as an increase in molecular orientation along the fiber direction. At temperatures close to or above the Tg, the carbonyl band sharpens. In particular, it is the central component of the band that sharpens in the ZZ spectrum. This presumably represents the annealing of the carbonyls into the plane of the aromatic ring, with the carbonyl units on each ring in the trans configuration. And our spectra indicate an increase in indicator bands for the trans glycol conformations that occur simultaneously with orientation. Thus, these measurements provide the capability to follow details of changes in polymer morphology and, in particular, to understand what changes are coupled together, and what changes may be independent. Ultimately, using this technology, our understanding of the polymer physics of these materials can be improved.
Acknowledgment
Many of the ideas in this article are the result of a wonderful collaboration with Herman Noether many years ago. In retrospect, I understand that he understood all of this but back then we did not have the capabilities to make these measurements.
References
(1) F. Adar, Spectroscopy 28(2), 14–22 (2013).
(2) F. Adar and H. Noether, Polymer 26, 1935–1943 (1985).
(3) F.J. Boerio, S.K. Bahl, and G.E. McGraw, J. Polymer Science: Polymer Physics 14, 1029–1046 (1976).
(4) T. Lefevre, F. Paquet-Mercier, S. Lesage, M-E. Rousseau, S. Bedard, and M. Pezolet, Vib. Spectrosc. 51, 136–141 (2009)
(5) F. Adar, Spectroscopy 32(2), 14–22 (2017).
(6) J. Purvis and D.I. Bower, J. Polymer Sci: Polymer Phys. 14, 1461–1484 (1976).
(7) A.J. Melveger, J. Polymer Sci. A-2(10), 317–322 (1972)
(8) Private communication, Professor Mike Jaffe, Polymer Processing Institute, Newark, New Jersey.
(9) J. Stokr, B. Schneider, D. Doskocilova, J. Lovy, and P. Sedlacek, Polymer 23, 714–721 (1982)
(10) M. Richard-Lacroix and C. Pellerin, Macromolecules (2012). doi:10.1021/ma202749d.
Fran Adar

Fran Adar, is the Principal Raman Applications Scientist for Horiba Scientific in Edison, New Jersey. Direct correspondence to: SpectroscopyEdit@UBM.com.

AI-Powered SERS Spectroscopy Breakthrough Boosts Safety of Medicinal Food Products
April 16th 2025A new deep learning-enhanced spectroscopic platform—SERSome—developed by researchers in China and Finland, identifies medicinal and edible homologs (MEHs) with 98% accuracy. This innovation could revolutionize safety and quality control in the growing MEH market.
New Raman Spectroscopy Method Enhances Real-Time Monitoring Across Fermentation Processes
April 15th 2025Researchers at Delft University of Technology have developed a novel method using single compound spectra to enhance the transferability and accuracy of Raman spectroscopy models for real-time fermentation monitoring.
Nanometer-Scale Studies Using Tip Enhanced Raman Spectroscopy
February 8th 2013Volker Deckert, the winner of the 2013 Charles Mann Award, is advancing the use of tip enhanced Raman spectroscopy (TERS) to push the lateral resolution of vibrational spectroscopy well below the Abbe limit, to achieve single-molecule sensitivity. Because the tip can be moved with sub-nanometer precision, structural information with unmatched spatial resolution can be achieved without the need of specific labels.