Surface Polaritons in Zinc Phosphide
Spectroscopy
Dispersion of surface polaritons in zinc phosphide (Zn3P2) single crystals is presented in this article for the first time. Surface polaritons in Zn3P2 were excited using the attenuated total reflectance (ATR) method.
Dispersion of surface polaritons in zinc phosphide (Zn3P2) single crystals is presented in this article for the first time. Surface polaritons in Zn3P2 were excited using the attenuated total reflectance (ATR) method. Optical parameters of Zn3P2 were obtained from the dispersion analysis of the spectra of normal IR reflection and ATR. These parameters were used for calculation of the ATR spectra and the dispersion of surface polaritons in Zn3P2.
The AIIBV compounds attract the attention of researchers because of their electrical and optical properties, which make them promising materials for working elements in electronic, optical and thermal detectors, lasers, thermal radiation receivers, and solar batteries (1). Zinc phosphide (Zn3P2) is a promising material for infrared (IR) detector applications, solar cells, and constructing new optoelectronic devices. It belongs to AII3BV2 compounds and crystallizes in a tetragonal crystal structure described by P42/nmc (D154h) space symmetry group. The unit cell of Zn3P2 consists of 40 atoms (2).
The optical vibrations in Zn3P2 crystals have been investigated using reflectivity, absorption, and Raman spectra in the IR range, and the optical properties were reported (3). A number of studies investigated surface polaritons in such compounds as silicon carbide, aluminum oxide, and so forth. For Zn3P2, however, the characteristics of surface polaritons in the IR region have not been studied thoroughly yet.
Experimental
In our experiments we used a set of samples of single crystals of Zn3P2 cut into 4 × 4 × 1 mm plates. The samples of Zn3P2 were oriented to (001) crystallographic planes. The orientation of the crystallographic planes was controlled by X-ray diffraction.
Reflectance spectra of Zn3P2 single crystals were measured at 300 K in the 25–600 cm-1 range, using a Bruker IFS 66v/s spectrometer with an Hg lamp as the source of unpolarized radiation with a resolution of 0.5 cm-1; 256 scans per 20 s were collected in each experiment. A gold mirror (a 300-nm-thick layer of gold, deposited on glass) with a reflectance index of 0.99 in the far IR served as a reference for reflectance measurements. Reflectance spectra of reference and investigated samples were measured sequentially. The final spectrum is a result of division of the sample's spectrum by the spectrum of reference. The angle of incidence of radiation was less than 10°.
We obtained the attenuated total reflectance (ATR) spectra of surface polaritons for Zn3P2 in the 200–500 cm-1 frequency range. In our experiments we used p-polarized radiation and a LOMO KSDI-82 spectrometer equipped with an NPVO-1 ATR attachment. A CsI semicylinder served as an ATR element with the angle of the incidence of the radiation of 50°. The air gap between the investigated sample and the semicylinder varied from 3 µm to 20 µm.
Results and Discussion
Here we present results of our experiments dealing with the optical properties of Zn3P2 using IR reflectance spectroscopy and surface polariton spectroscopy in the reststrahlen region.
An analysis of variance for the spectra obtained enabled us to advance a mathematical model for reflectance spectra. In our calculations, we used the consistent data on the optical parameters of Zn3P2 single crystals that were obtained by comparing the experimental and calculated spectra.
The dielectric function of the crystal was obtained in the traditional following form (4):

where ε∞ is the high-frequency permittivity, Si is the i-th oscillator strength, and νTi and γTi (νp and γp) are the frequency and the damping coefficient of the i-th transverse optical phonon (plasmon). The summation is made for the multiphonon vibrational system of the Zn3P2 crystal lattice.
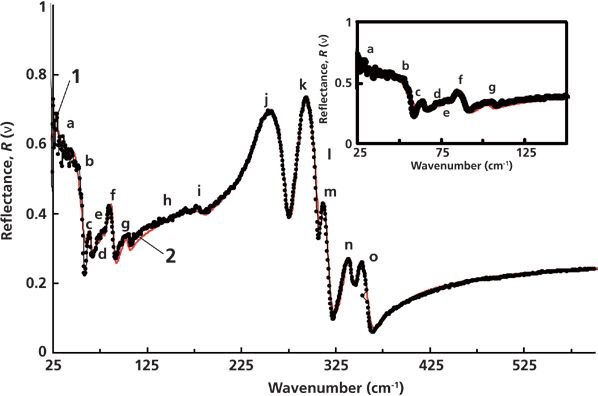
Figure 1: IR reflectance spectra of Zn3P2. 1 = experimental, 2 = calculated.
The experimental reflectance spectrum of Zn3P2 is presented in Figure 1 (curve 1) and shows 15 peaks in the studied spectral range. This spectrum is of the form that is similar to the data shown in reference 3, namely, two peaks at 257 cm-1 and 296 cm-1 with a "shoulder" at 312 cm-1, two small peaks at 340 cm-1 and 354 cm-1, and some small peaks below 125 cm-1. The reflectance coefficient at wavenumbers greater than 550 cm-1 is R(ν) ≤ 0.24. Unlike the study presented in reference 3, we examined the reflectance at wavenumbers as high as 600 cm-1, which leads to a better determination of ε∞. The reflectance spectrum was compared to the theoretical spectrum (curve 2) using an analysis of variance. Figure 1 demonstrates a good agreement between the theoretical and experimental results. This agreement enabled us to develop a mathematical model for the reflection spectra of Zn3P2. Dispersion of the dielectric permittivity of Zn3P2 single crystal obtained from the calculated reflectance spectrum is presented in Figure 2. In this figure, curve 1 corresponds to the dispersion of the real part of the dielectric permittivity and curve 2 corresponds to the imaginary part. Spectral ranges where ε1 has negative values (and where surface polaritons can be excited) are marked with a bold green line.
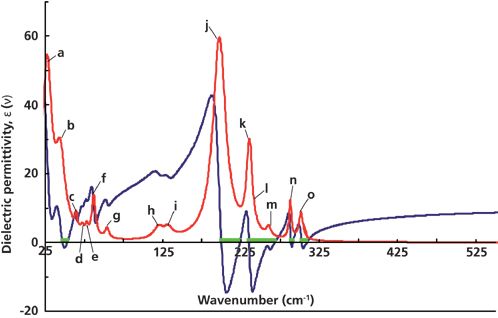
Figure 2: Dispersion of the dielectric function of Zn3P2 in the IR region. 1 = real, 2 = imaginary.
Here we present, for the first time, the results of our investigation of surface phonon polaritons in Zn3P2. ATR is one of the experimental techniques used for studying surface polaritons. Figure 3 shows an experimental ATR spectrum of Zn3P2 (curve 1) measured at α = 50° (angle of incidence for an ATR unit). Curve 2 corresponds to the simulated ATR spectrum. The ATR surface R(ν, α) shown in Figure 4 is a three-dimensional presentation of the system transmission that depends on the radiation frequency ν and angle α. It consists of eight ATR spectra: The first one is experimental (α = 50°), and the others are calculated (α = 52 ÷ 64°).
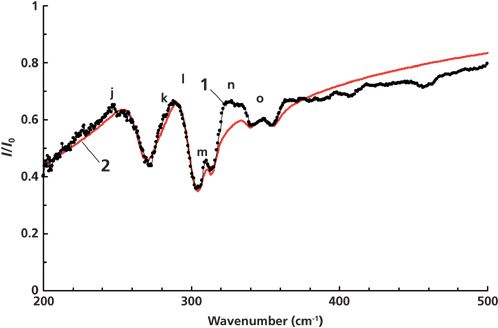
Figure 3: ATR spectra of Zn3P2, α = 50°. 1 = experimental, 2 = calculated.
If there is surface polariton damping and dissipation of the electromagnetic wave energy, then the surface R(ν, α) = I(ν, α)/I0(ν, α) has five "canyons" connected with a "pass." Here, I(ν, α) is the intensity of radiation passing through the ATR unit (semicylinder)–gap–sample system; I0(ν, α) is the intensity of radiation incident onto the ATR unit. The "canyon" depth depends on the system parameters: the gap dg between the semicylinder and sample, the radiation frequency ν, the complex permittivity ε(ν, k) of the sample, and the permittivities of the ATR unit and gap. The surface polariton dispersion curves νs(k) correspond to the "canyons" - that is, to the set of ATR spectra minima. (Here νs is the surface polariton frequency and k is the surface polariton wave vector.)
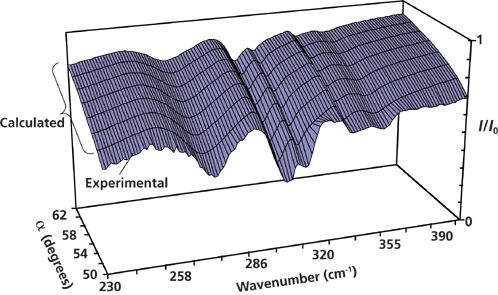
Figure 4: ATR surface analysis of Zn3P2.
The relation between the ATR spectrum minima and surface polariton dispersion curve is given by the following equation (4):

where ν is the frequency of the ATR spectrum minimum, c is the speed of light in a vacuum, and n is the refractive index of material of the ATR semicylinder (in this case, CsI with n = 1.72).
Figure 5 presents the calculated (full curves) and experimental (dots) surface polariton dispersion curves. The main feature of the dispersion curves in Zn3P2 is the presence of six branches. This result agrees with the developed mathematical model for Zn3P2 that takes into account contributions from phonons and plasmons to the permittivity. The consistent data obtained for the optical parameters (high-frequency permittivity, transverse optical phonon frequencies, and corresponding damping coefficients) of Zn3P2 single crystals are presented in Table I.
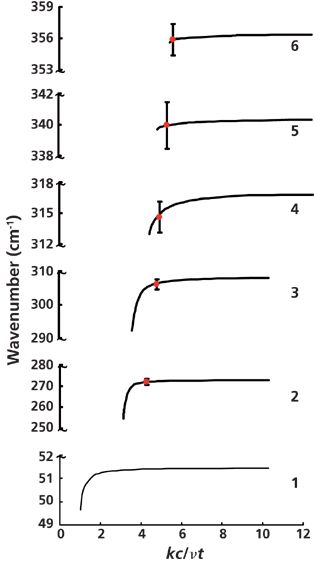
Figure 5: Dispersion of surface polaritons in Zn3P2. The red dot means experimental, and the long line means calculated.
The R(ν) entries in Table I were obtained from comparison between the experimental and calculated spectra. The ATR section lists the parameter values used when trying to simulate the calculated ATR spectra at α = 50°. One can see from Figure 3 that good agreement exists between the spectra. When comparing the data obtained from the R(ν) and ATR spectra, one can see that to get better agreement one should take essentially different frequencies of some oscillators, as well as the corresponding damping coefficients and strengths. In particular, the oscillator frequencies differ by 2–4 cm-1 and the damping coefficients and strengths differ by a factor of 1.5–2. This result stems from the effect of a near-surface layer on the properties of surface polaritons in Zn3P2.
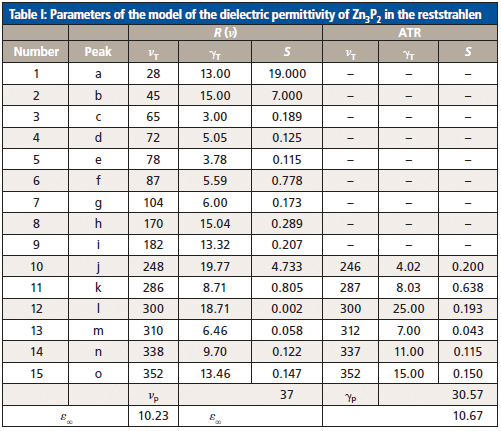
Table I: Parameters of the model of the dielectric permittivity of Zn3P2 in the reststrahlen
Conclusions
We investigated Zn3P2 using IR reflectance spectroscopy and surface polariton spectroscopy in the reststrahlen region at room temperature. The analysis of variance conducted for the spectra enabled us to obtain parameters of the mathematical model for reflection spectra of Zn3P2. In our calculations, we used consistent data for optical parameters (high-frequency permittivity, transverse optical phonon frequencies, and corresponding damping coefficients) of Zn3P2 single crystals that have been obtained from comparison of the measured and calculated spectra. These data were used when studying ATR spectra and dispersion curves for surface polaritons in Zn3P2. In future studies, we intend to perform quantitative comparison of the experimental and theoretical ATR surfaces to study the material's optical properties. This analysis will help to get more detailed information on the studied system.
References
(1) K. Kakishita, K. Aihara, and T. Suda, Sol. Energy Mater. Sol. Cells35, 333–340 (1994).
(2) J. Misiewicz et al., Microelectron. J.25, 5 (1994).
(3) J. Misiewicz, J. Phys.: Condens. Matter1, 9283–9299 (1989).
(4) M. Fox, Optical Properties of Solids (Oxford University Press, New York, New York, 2010).
K. Shportko, T. Barlas, and E. Venger are with the V.E. Lashkarev Institute for Semiconductor Physics of NAS of Ukraine in Kyiv, Ukraine. Direct correspondence to: konstantin@shportko.com

Geographical Traceability of Millet by Mid-Infrared Spectroscopy and Feature Extraction
February 13th 2025The study developed an effective mid-infrared spectroscopic identification model, combining principal component analysis (PCA) and support vector machine (SVM), to accurately determine the geographical origin of five types of millet with a recognition accuracy of up to 99.2% for the training set and 98.3% for the prediction set.
Authenticity Identification of Panax notoginseng by Terahertz Spectroscopy Combined with LS-SVM
In this article, it is explored whether THz-TDS combined with LS-SVM can be used to effectively identify the authenticity of Panax notoginseng, a traditional Chinese medicine.