The Hydrogen Bonding Mode of 5-Fluorouracil-Proline Co-Crystal (5F-P) Studied by Terahertz (THz) Spectroscopy and Density Functional Theory (DFT)
This work shows that the combination of THz-TDS and DFT can provide an effective method to investigate the connection mode of hydrogen bonds and thus aid in characterizing compounds such as this potential drug candidate.
The hydrogen bonding mode of 5-fluorouracil-proline co-crystal (5F-P) was investigated using terahertz time-domain spectroscopy (THz-TDS) and density functional theory (DFT). The THz spectrum of 5F-P is significantly different from the monomer of 5-fluorouracil (5- FU) and proline within the range of 0.25–2.6 THz. This result indicates that the two monomers react to form a new phase. Based on unit cell simulation, the theoretical spectrum of configuration 2 (N1–H1•••O4) is the most consistent with the experimental spectrum. Furthermore, configuration 2 carries the lowest amount of total energy and exhibits the most stable structure. Therefore, the hydrogen bonding mode of configuration 2 is closest to 5F-P. This work shows that the combination of THz-TDS and DFT can provide an effective method to investigate the hydrogen bonding mode of the new phase.
L-proline (L-Pro) has a unique structure among the 20 amino acids normally found in proteins because it is the only imino acid among them. The unique cyclic structure leads to the conformational rigidity and specific imino functionality compared to amino acids (1,2). The amino nitrogen binds with the side chain, with the α-carbon leading to a pyrrolidine ring. This structure restricts the conformations that proline can adopt within a peptide or protein, giving it a unique role in the secondary and tertiary structures of proline-containing proteins (3,4). Given this conformation, proline is often found in complex proteins. It plays a binding role in collagen, which has a high proline content. Proline-rich regions in proteins are also found in many kinase binding sites and are linked to many other cellular processes (5–8). Proline is an amphoteric substance with both carboxyl and amino groups. Its solubility in aqueous solutions is more soluble than other amino acids. Proline has also been shown to have strong water absorption in inelastic incoherent neutron scattering studies (9). Proline contains an imino (-NH-) group and a carboxyl (-COOH) group, which can form both intramolecular hydrogen bonds and intermolecular hydrogen bonds with other molecules (10).
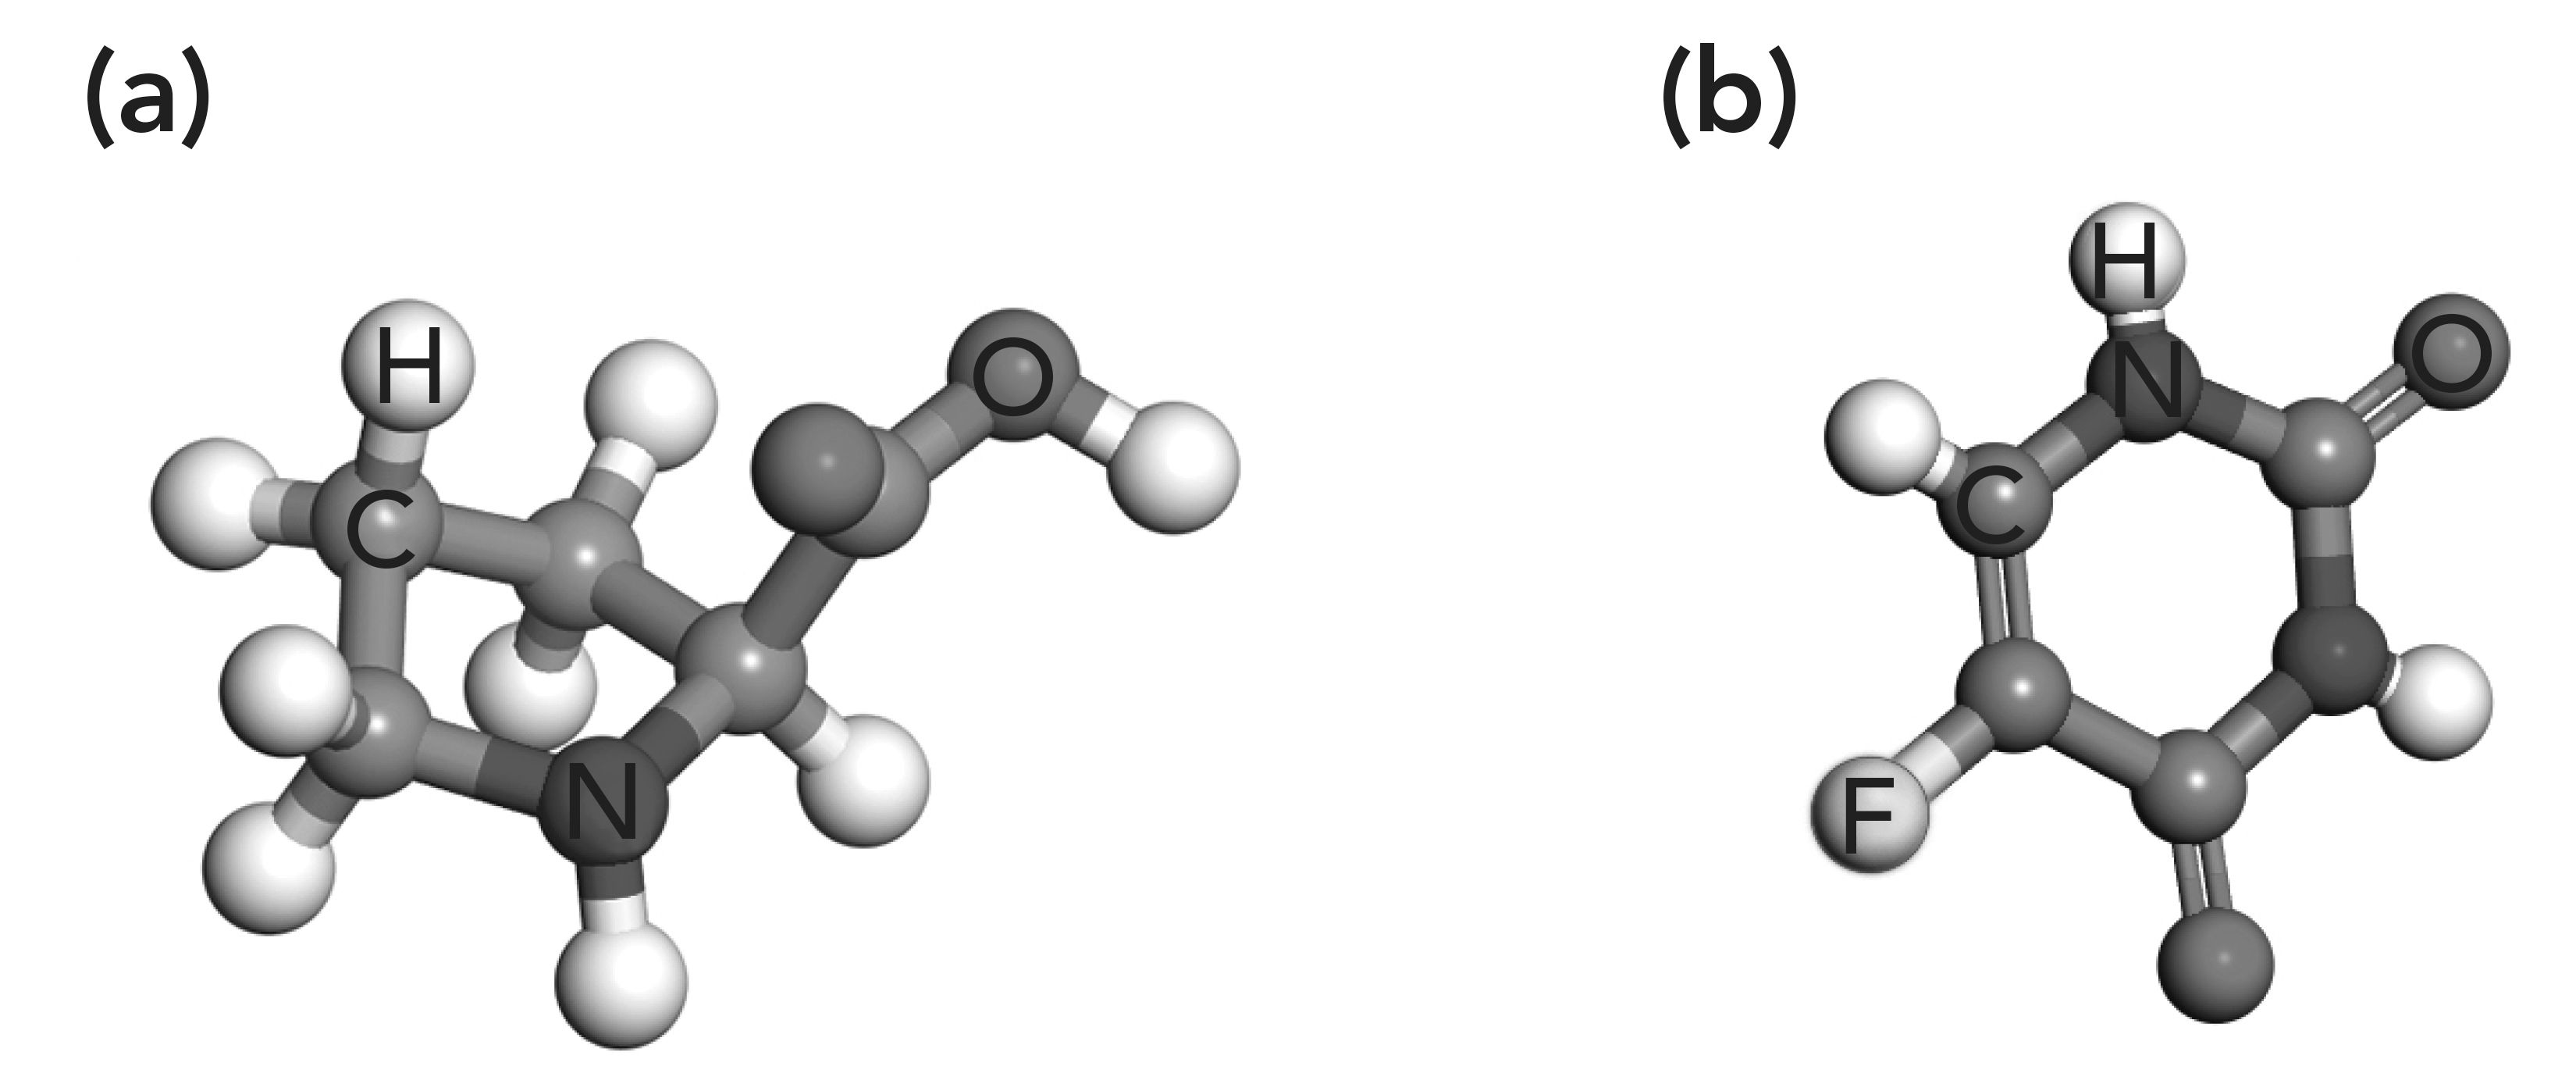
In 1957, Heidelberger and others (11) first discovered 5-fluorouracil (5-FU). They replaced the hydrogen atom at the fifth position of uracil with a fluorine atom of similar size. The obtained fluoride is not only similar in volume to the original compound but also the carbon–fluorine bond formed is very stable, which is not easy to decompose during metabolism and can interfere with normal metabolism at the molecular level. 5-FU is an antimetabolic tumor drug, and its active metabolite inhibits thymidine synthase (TS), which is the primary mechanism for its antitumor effect (12). However, its actual efficacy is affected to a certain extent because of the low solubility of 5-FU. Because proline is nontoxic and soluble in water, it is an ideal co-crystal former (CCF). It can effectively improve the solubility of 5-FU by co-crystallization of 5-FU and proline (5F-P). However, its toxicity and anticancer need further research in medicine. The molecular structure of proline and 5-FU is shown in Figure 1.
FIGURE 1: Molecular structure of (a) proline and (b) 5-FU.
The drug co-crystal refers to a crystal formed by combining active pharmaceutical ingredient (API) and CCF in a particular proportion under the action of hydrogen bonds or other non-covalent bonds (13–15). 5-FU, as an active pharmaceutical ingredient, combines with proline to form a co-crystal through hydrogen bonding. The hydrogen bond is usually expressed as A—H•••B. Although hydrogen bonding is a weak interaction, it plays a vital role in affecting biomolecules’ physical and chemical properties. In recent years, researchers have done a lot of research on noncovalent interactions among molecules, including experimental methods such as infrared, Raman, and nuclear magnetic resonance spectroscopy, as well as calculation methods such as molecular dynamics simulation (16–18).
As a novel technique, terahertz (THz) spectroscopy is regarded as an advanced approach that studies new aspects of molecular structure and distinguishes polymorphic pharmaceutical, which is especially useful when studying biomolecules, which contain rich hydrogen-bond interactions (19–22). THz spectroscopy could directly collect helpful information on low-frequency vibrations shown within specific molecular structures and intermolecular hydrogen bonding interactions. Meanwhile, computational methods, such as solid-state density functional theory (DFT), have shown potential as reliable approaches to studying these low-energy lattice vibrational motions (23–26). Thus, the combination of DFT and experimental data is a very effective method to study the molecular geometry and intermolecular interactions. Applications of terahertz time-domain spectroscopy (THz-TDS) on weak interaction and co-crystal have been reported in previous studies. Sean P. Delaney and others demonstrated that the co-crystal of flufenamic acid and nicotinamide has better overall binding energy by THz-TDS and solid density (27). Chihiro Funaki and others proved that the existence of three different kinds of weak C-H•••O=C interactions in poly (ε-caprolactone) by THz-TDS (28). Qi Zhou and others characterized the co-crystal of carbamazepine with nicotinamide, saccharin, and fumaric acid by THz-TDS and DFT (29).
In this study, we successfully obtained the co-crystal of proline and 5-FU by evaporating the solvent. As a new phase, 5F-P co-crystal has no detailed report on its hydrogen bonding mode, which is significant for studying the properties of substances. Therefore, we investigated the hydrogen bonding mode of 5F-P by using THz-TDS and DFT. Furthermore, we also verified the accuracy of the hydrogen bonding model of 5F-P through the stability of the system.
Materials and Methods
L-Pro (purity > 98%), 5-FU (purity > 98%) and polyethylene (PE, particles size 40–48 μm) were purchased from Sigma-Aldrich. All chemicals were used without further purification.
Proline and 5-FU were placed in a 100 mL beaker at a 1:1 molar ratio (690 mg:780 mg) and added 70 mL of a methanol:ethyl and an acetate:acetone mixed solvent in a volume ratio of 1:1:1 to the mixture. It was then heated and stirred in a constant temperature water bath for about 2 h at 60 °C. Finally, the obtained solution was filtered under reduced pressure to remove insoluble matters to get clear solution. It was slowly evaporated at normal temperature for about three days to collect the solid phase. The obtained solid phase was dried overnight to obtain 5F-P in a constant temperature environment at 25 °C.
Sample Preparation
Samples and PE were weighed into agate mortar at 1:5 (weight of sample/weight of PE = 40 mg/200 mg) and ground gently into fine particles with a pestle to thoroughly mix samples with PE. The samples were then compressed into a pellet (about 1.9 mm in thickness and 13 mm in diameter) with a hydraulic press using 10 tons pressure for 3 min.
Terahertz Time-Domain Spectroscopy
The THz-TDS used in the experiment was made by Daheng Optoelectronics. The center wavelength of the CIP-TDS spectrometer was 800 nm, and the repetition frequency was 84 MHz. The effective spectral band was 0.2–3 THz. The samples were placed into the THz system, purged with high-purity nitrogen and kept at the relative humidity <1%. The THz spectrum of each sample was measured at room temperature (20 °C), and PE was taken as a reference. Each spectrum was an average of three measurements. One measurement included 1024 scan numbers. The time-domain of the THz electric field was recorded for the reference and each sample. The fast Fourier-transform (FFT) operation obtained the time-domain spectrum, and the THz spectral absorption was obtained by dividing the sample frequency response by that of the reference.
Powder X-ray Diffraction (PXRD)
The PXRD was purchased from Thermo ARL, Switzerland, for this experiment. The X-ray source was a copper shoe, and the working voltage was 40 kV. The working current was 40 mA. The scanning range was 5 to 50°, and the scanning speed was 0.2°/step.
Quantum Chemical Calculation
The theoretical calculations in this study were all performed using the Cambridge Sequential Total Energy Package (CASTEP) (30). There was no virtual frequency in all simulation calculations, which indicates that the optimized structure achieved a stable structure corresponding to the lowest molecular energy. The exchange- related functional used generalized gradient approximation–Perdew-Burke-Ernzerhof (GGA–PBE) (31). The quality of the energy calculation was ultra-fine. The quality of the plane wave cut off energy was ultra-fine, and the energy cutoff was 830 eV. Norm conserving was selected as the pseudopotential. The quality of the k-point set was fine. The convergence thresholds for energy, maximum force, stress, and maximum displacements was 5.0 × 10⁻⁶ (eV/atom), 0.01 eV/Å, 0.02 GPa and 5.0 × 10⁻⁴ Å, respectively. The Grimme correction was also added to the calculation task to evaluate weak interactions, such as hydrogen bonds among molecules (32).
Results and Discussion
Powder X-ray Diffraction (PXRD) of Proline, 5-FU and 5F-P
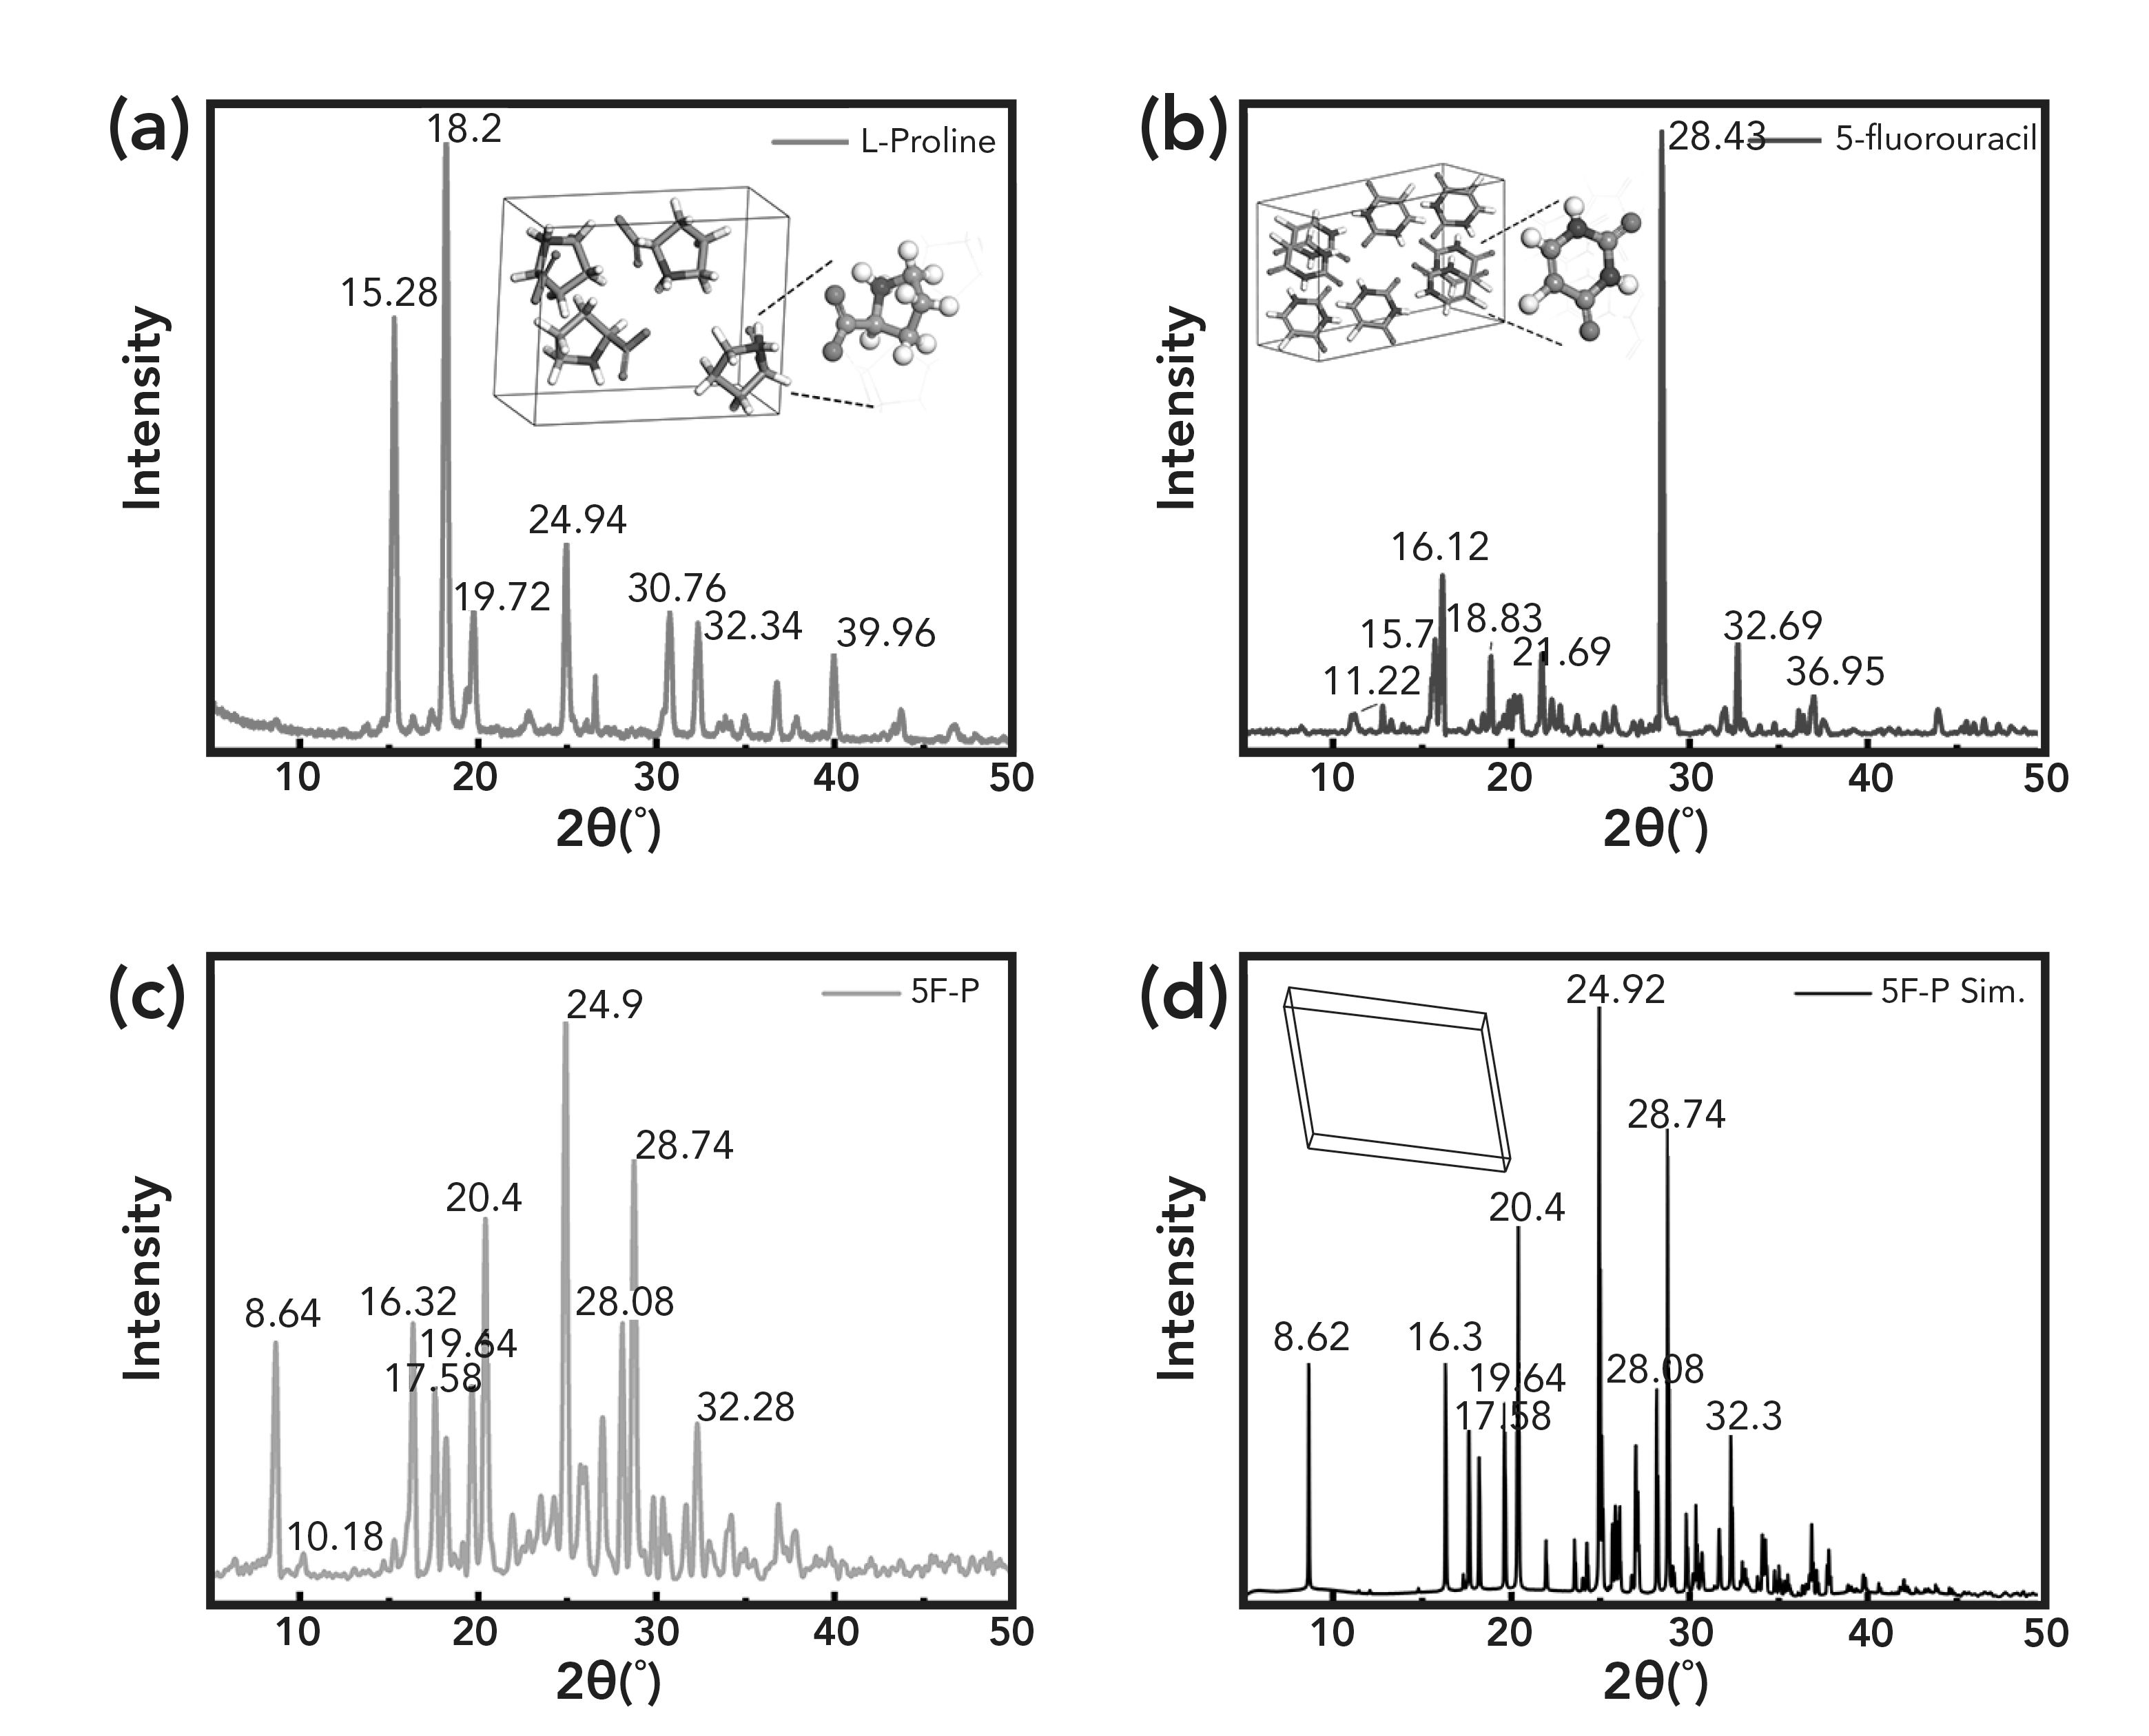
Figures 2a, 2b, and 2c shows the PXRD patterns of proline, 5-FU and 5F-P. Figure 2d is the simulated PXRD based on the unit cell of 5F-P. The diffraction peaks of proline are located at 15.28°, 18.2°, 19.72°, 24.94°, 30.76°, 32.34°, and 39.96°, respectively. The diffraction peaks of 5-FU are located at 11.22°, 15.7°, 16.12°, 18.83°, 21.69°, 28.43°, 32.69°, and 36.95°. The results are consistent with previous reports (33,34). The PXRD of 5F-P is significantly different from the two monomers. The comparison of PXRD with the Materials Data Inc. (MDI) Jade 6.5 PDF standard card showed that the proline is orthorhombic with space group P212121, a = 11.626 Å, b = 9.024 Å, c = 5.246 Å, α = β = γ = 90° (PDF #21-1805), but the 5-FU is triclinic with space group P-1, a = 9.22Å, b=12.66Å, c=12.67Å, α=89.7°, β = 43.9°, γ = 98.6° (PDF #39-1860). Since 5F-P is a new phase, the crystal structure does not appear in the Cambridge Crystallographic Data Center (CCDC). We used the Reflex module to index the co-crystal based on the PXRD diffraction peak. The result after further refinement is that the 5F-P is triclinic, the space group is P-1 with a = 11.13 Å, b = 8.12 Å, c = 6.21 Å, α = 88.65°, β = 104.89°, γ = 107.43°. As shown in Figure 2d, the simulation PXRD pattern based on indexed data is consistent with the experimental pattern of 5F-P. Therefore, these results show that the simulated unit cell of 5F-P is reasonable.
FIGURE 2: Powder X-ray diffraction (PXRD) pattern of (a) proline, (b) 5-FU, (c) 5F-P and (d) the simulated PXRD pattern of 5F-P.
THz Absorption Spectra of Proline, 5-FU, and 5F-P
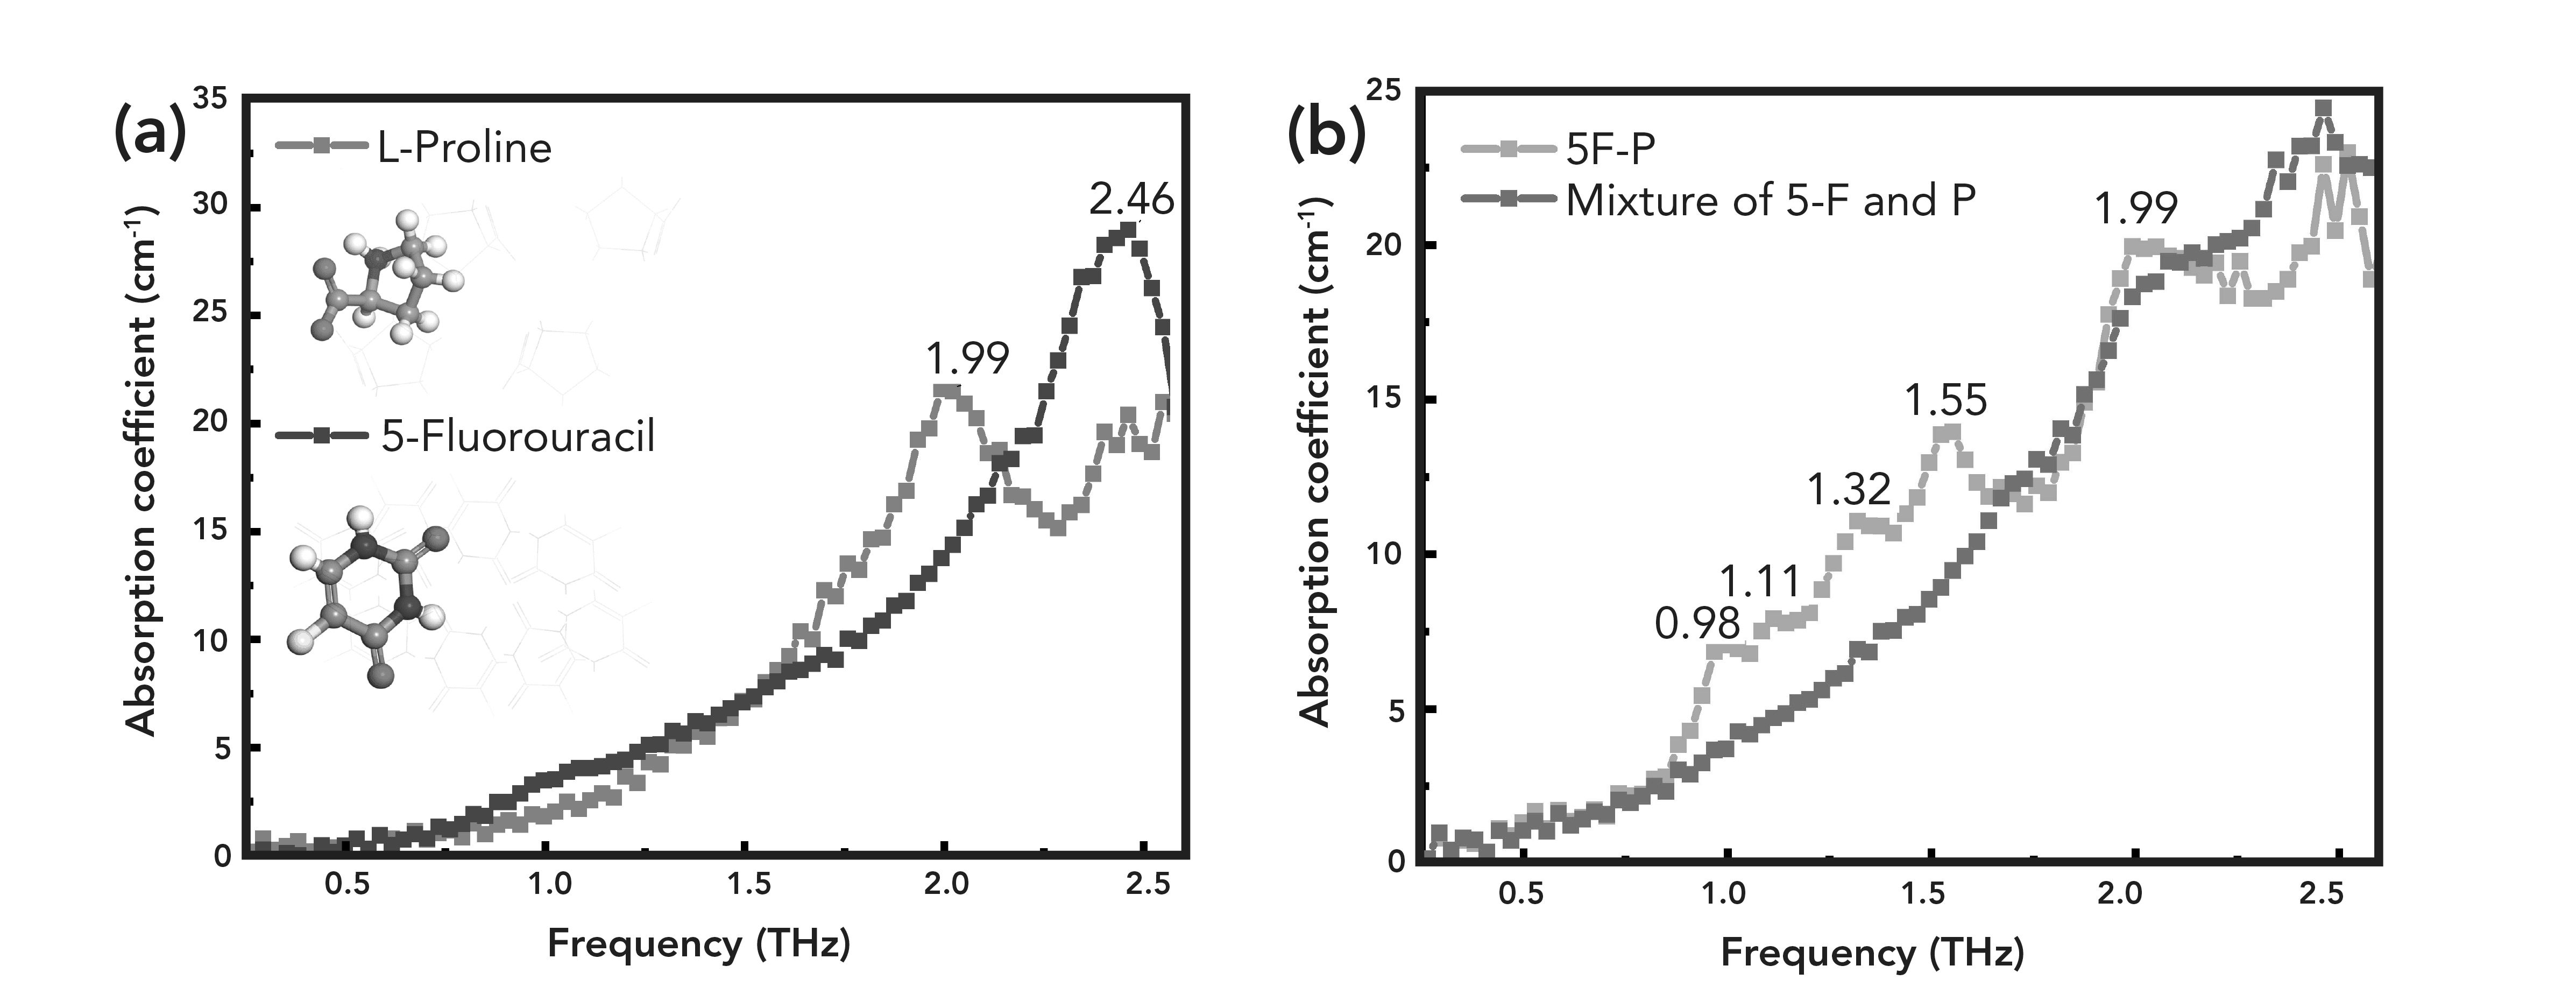
The THz experimental spectrum of monomers, co-crystal and mixture (mixed at 1: 1 molar ratio) are shown in Figure 3. The THz spectrum of proline exhibits a noticeable absorption peak at 1.99 THz, while 5-FU has a strong absorption at 2.46 THz, as shown in Figure 3a. There are few absorption peaks of proline and 5-FU. From Figure 3b, it can be seen that the THz absorption spectra of 5F-P display four visible absorption peaks, which are 0.98, 1.32, 1.55, and 1.99 THz, respectively. Furthermore, there is a weak absorption peak observed at 1.11 THz, which gives rise to a shoulder peak with the absorption peak at 0.98 THz. The THz spectrum of the mixture shows a weak absorption band at 1.99 THz. Besides, there is a suspicious absorption peak at 2.46 THz. It can be demonstrated that the absorption peak of the mixture is a simple superposition of two monomers. The THz absorption spectra of 5F-P is significantly different from the monomers and their mixture. Therefore, both the THz spectrum and PXRD show that the new solid phase is a co-crystal of the two reactants rather than a simple polymorphic transition of the single crystal. The crystal structure of the co-crystal has changed to some extent. Furthermore, a series of new absorption peaks appeared after the co-crystallization, which is attributed to the hydrogen bonding between the two molecules. Because the THz absorption peak of 5F-P is much more than two monomers, 5F-P produces more vibration modes. The formation of hydrogen bonds changes the arrangement of electrons, while the THz band is highly sensitive to hydrogen bonding interactions and collective vibrations of molecular lattices (35,36), thus resulting in corresponding changes in vibration intensity and frequency. The new absorption vibration peaks indicate that new hydrogen bonding interactions are produced in the co-crystal. Apart from that, the THz spectrum also can intuitively reflect the occurrence of intermolecular vibration.
FIGURE 3: The THz absorption spectra of (a) Pro, 5-FU. (b) The THz absorption spectra of co-crystal and mixture.
Natural Bond Orbital (NBO) Calculation of Charge Distribution
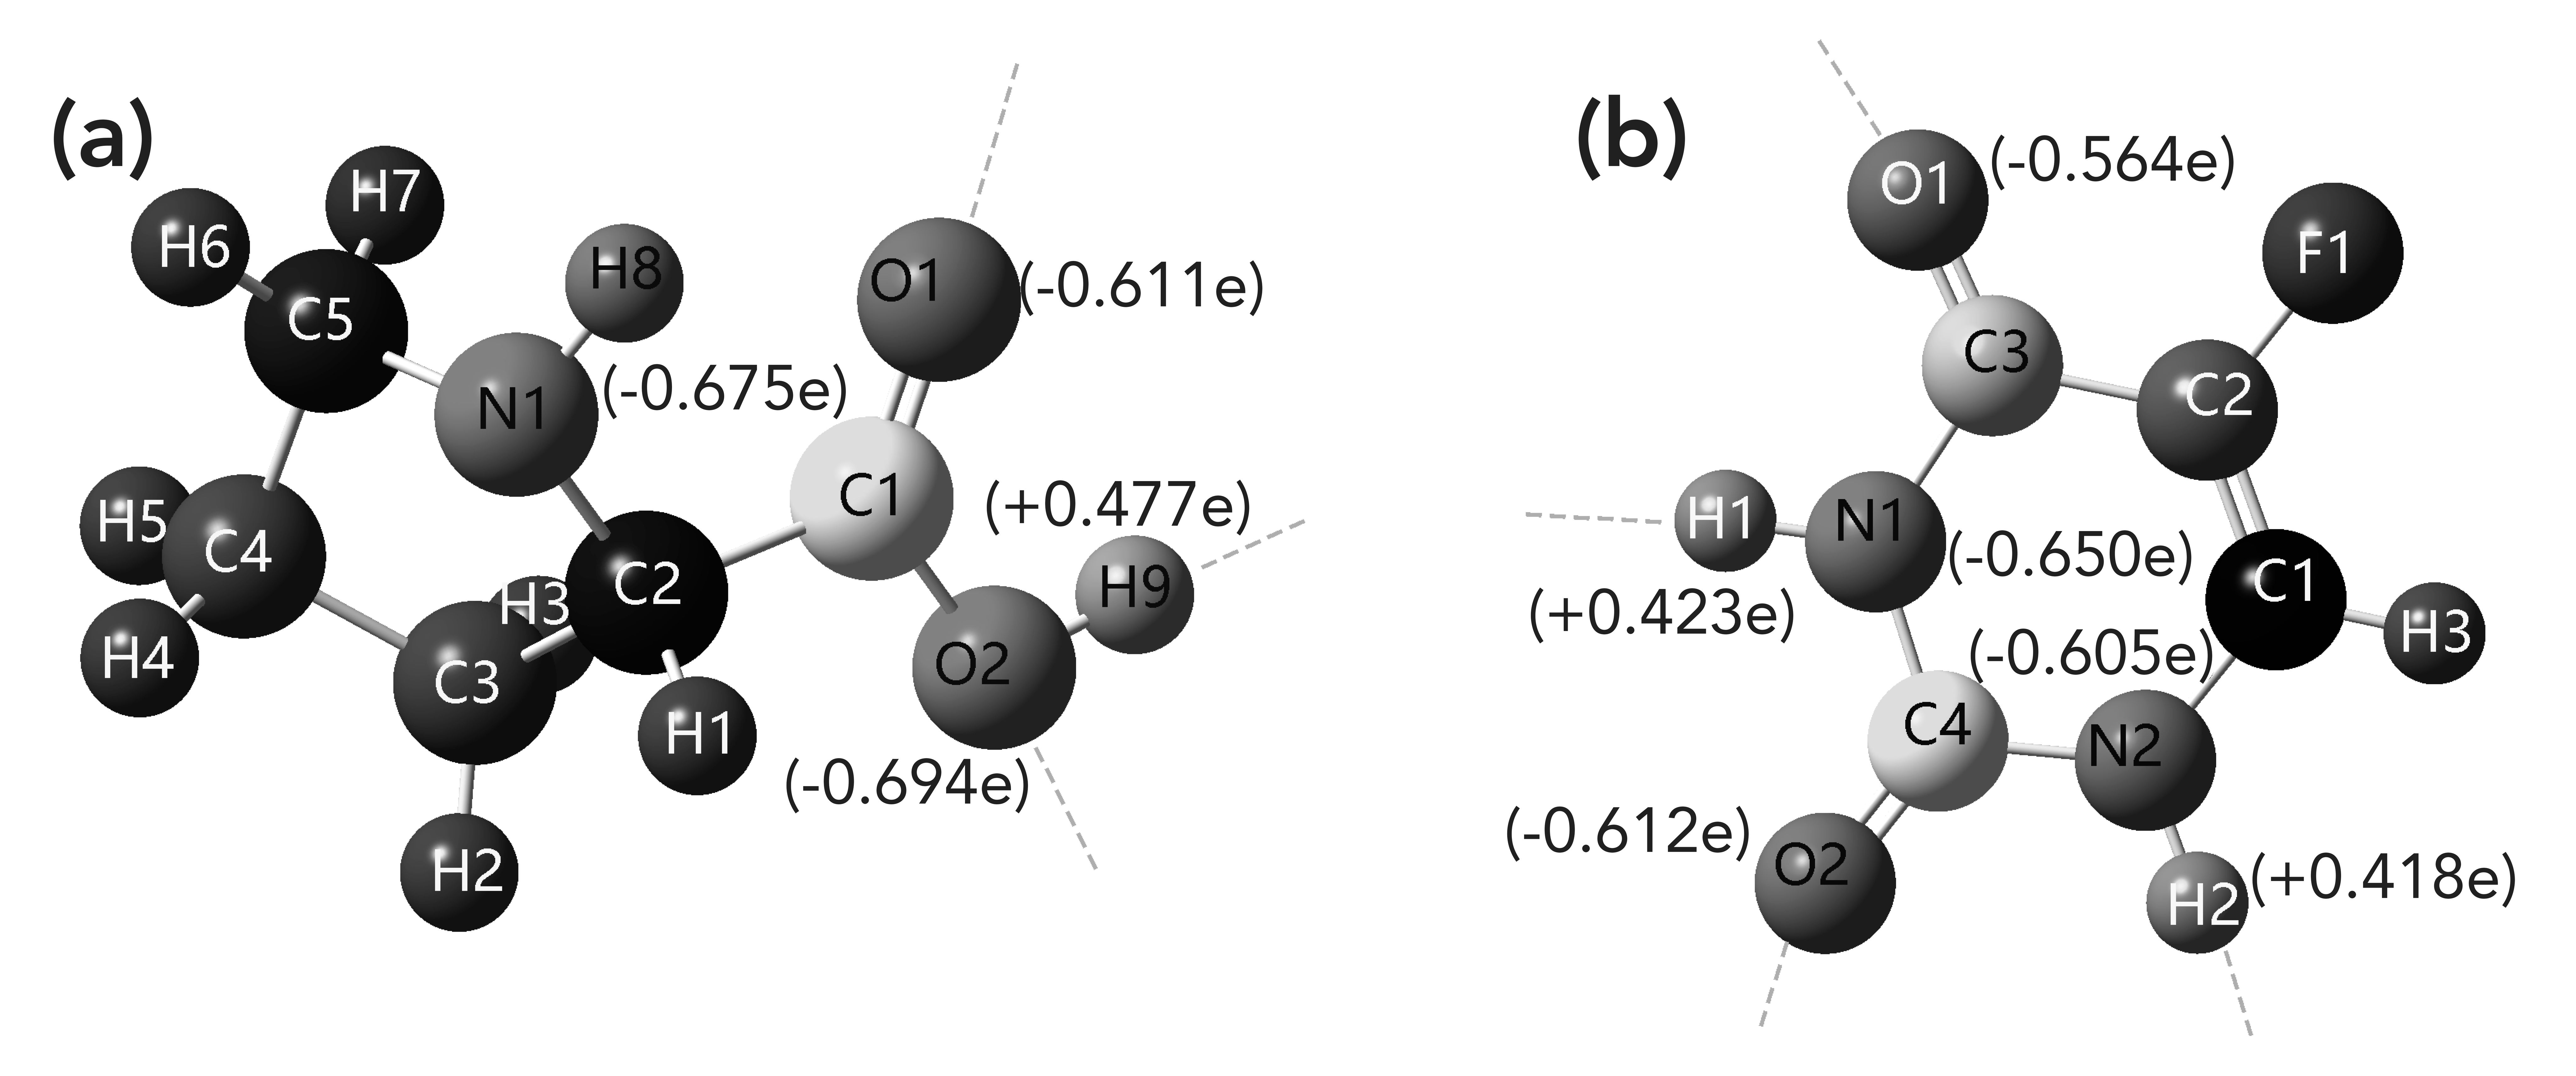
First of all, we have investigated potential intermolecular hydrogen bonding sites of 5F-P by the NBO calculation. NBO analysis is an effective tool for studying charge transfer, electronic transitions, and conjugate interactions. NBO atomic charge distribution was calculated at the B3LYP/6-311++G (d,p) level. Figure 4 shows the charge distribution of the stronger electronegative atoms in the proline (a) and 5-FU (b). There are two stronger polarity and negatively charged oxygen atoms O1 (-0.611e) and O2 (-0.694e) observed on the carboxyl group of proline. In addition, there is a stronger electronegative nitrogen atom N1 (-0.675e) spotted on the amino group. Also, there are strongly electronegative atoms on 5-FU, including two carbonyl oxygen atoms O1 (-0.564e), O2 (-0.612e) and two nitrogen atoms N1 (-0.650e), N2 (-0.605e). According to previous reports, both amino and carboxyl groups are more active groups. The highly electronegative atoms present on proline and 5-FU cause an uneven charge distribution. Therefore, there is the possibility of hydrogen bond formation between proline and 5-FU. In addition, proline is an effective co-crystal former. All these indicate that proline can easily form hydrogen bonds with 5-FU.
FIGURE 4: The atomic charge distribution of (a) Pro and (b) 5-FU. (The blue dashed line is hydrogen bonding). The various atoms are identified in the figure.
Theoretical Configuration of 5F-P
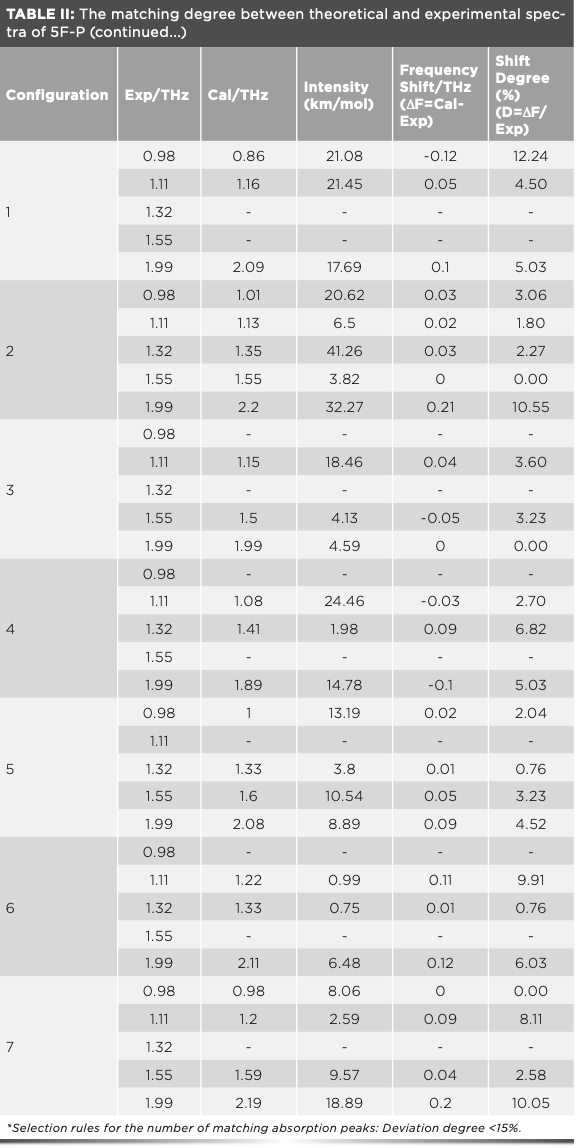
Table I shows the intermolecular hydrogen bond network of proline and 5-FU through previous reports (37,38). It can be seen that the imino and carboxyl groups on proline form intermolecular hydrogen bonds. The carbonyl oxygen atoms and imino groups on 5-FU participate in forming the intermolecular hydrogen bond network. This result is consistent with the NBO analysis in section 4.3. Therefore, the theoretical configuration is based on the formation of hydrogen bonds between strongly electronegative groups. In this study, 11 reasonable hydrogen bonding modes were obtained. The theoretical configuration of 5F-P was constructed based on these modes. We further optimized the unit cell of 11 theoretical configurations, two of which failed to achieve convergence. Therefore, we have obtained nine stable theoretical configurations of 5F-P and their hydrogen bond modes are shown in Figure 5. The hydrogen bonding modes of configurations 1–9 are N2–H2•••O4 (C1), N1–H1•••O4 (C2), N2–H2•••O3 (C3), N1–H1•••O3 (C4), N3–H12•••O2 (C5), N3–H12•••O1 (C6), N1–H1•••O3/ N3–H11•••O1 (C7), N1–H1•••O3/N3– H11•••O2 (C8), and N2–H2•••O3/N3– H11•••O2 (C9).
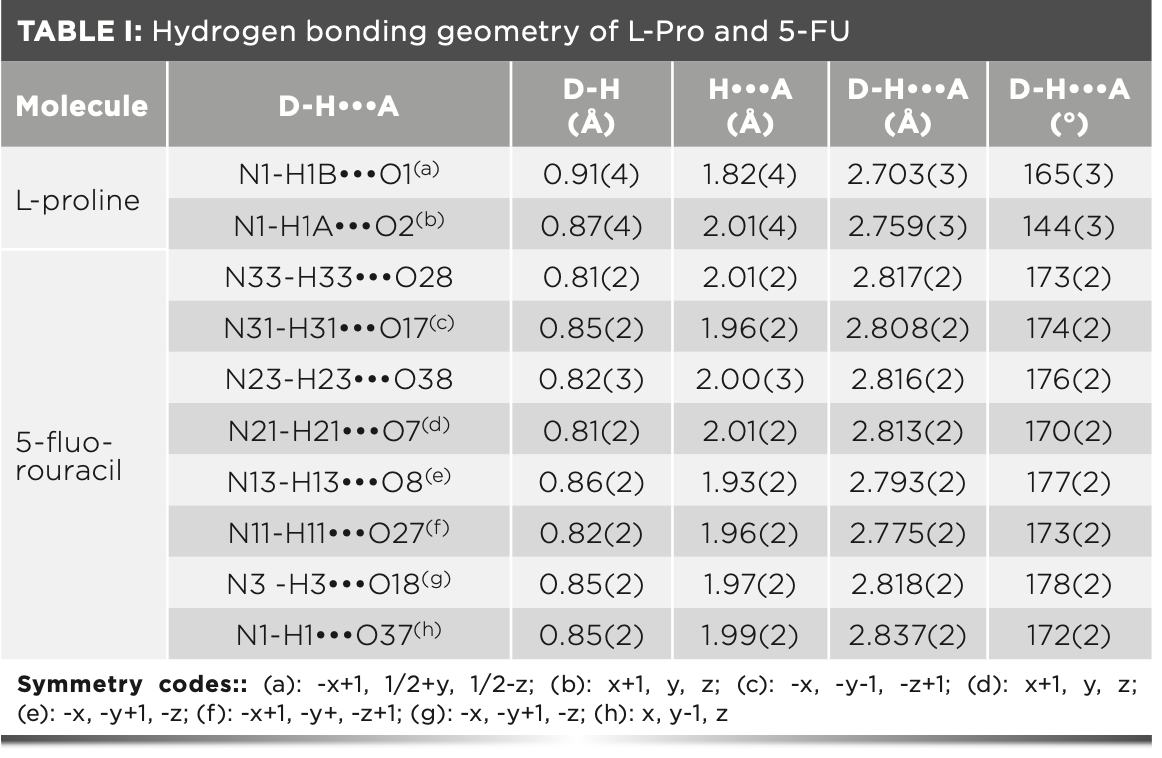
FIGURE 5: The hydrogen bonding mode of theoretical configuration (a) 1, (b) 2, (c) 3, (d) 4, (e) 5, (f) 6, (g) 7, (h) 8, (i) 9. The color code for atoms is given in the figure.
THz Theoretical Spectrum of 5F-P
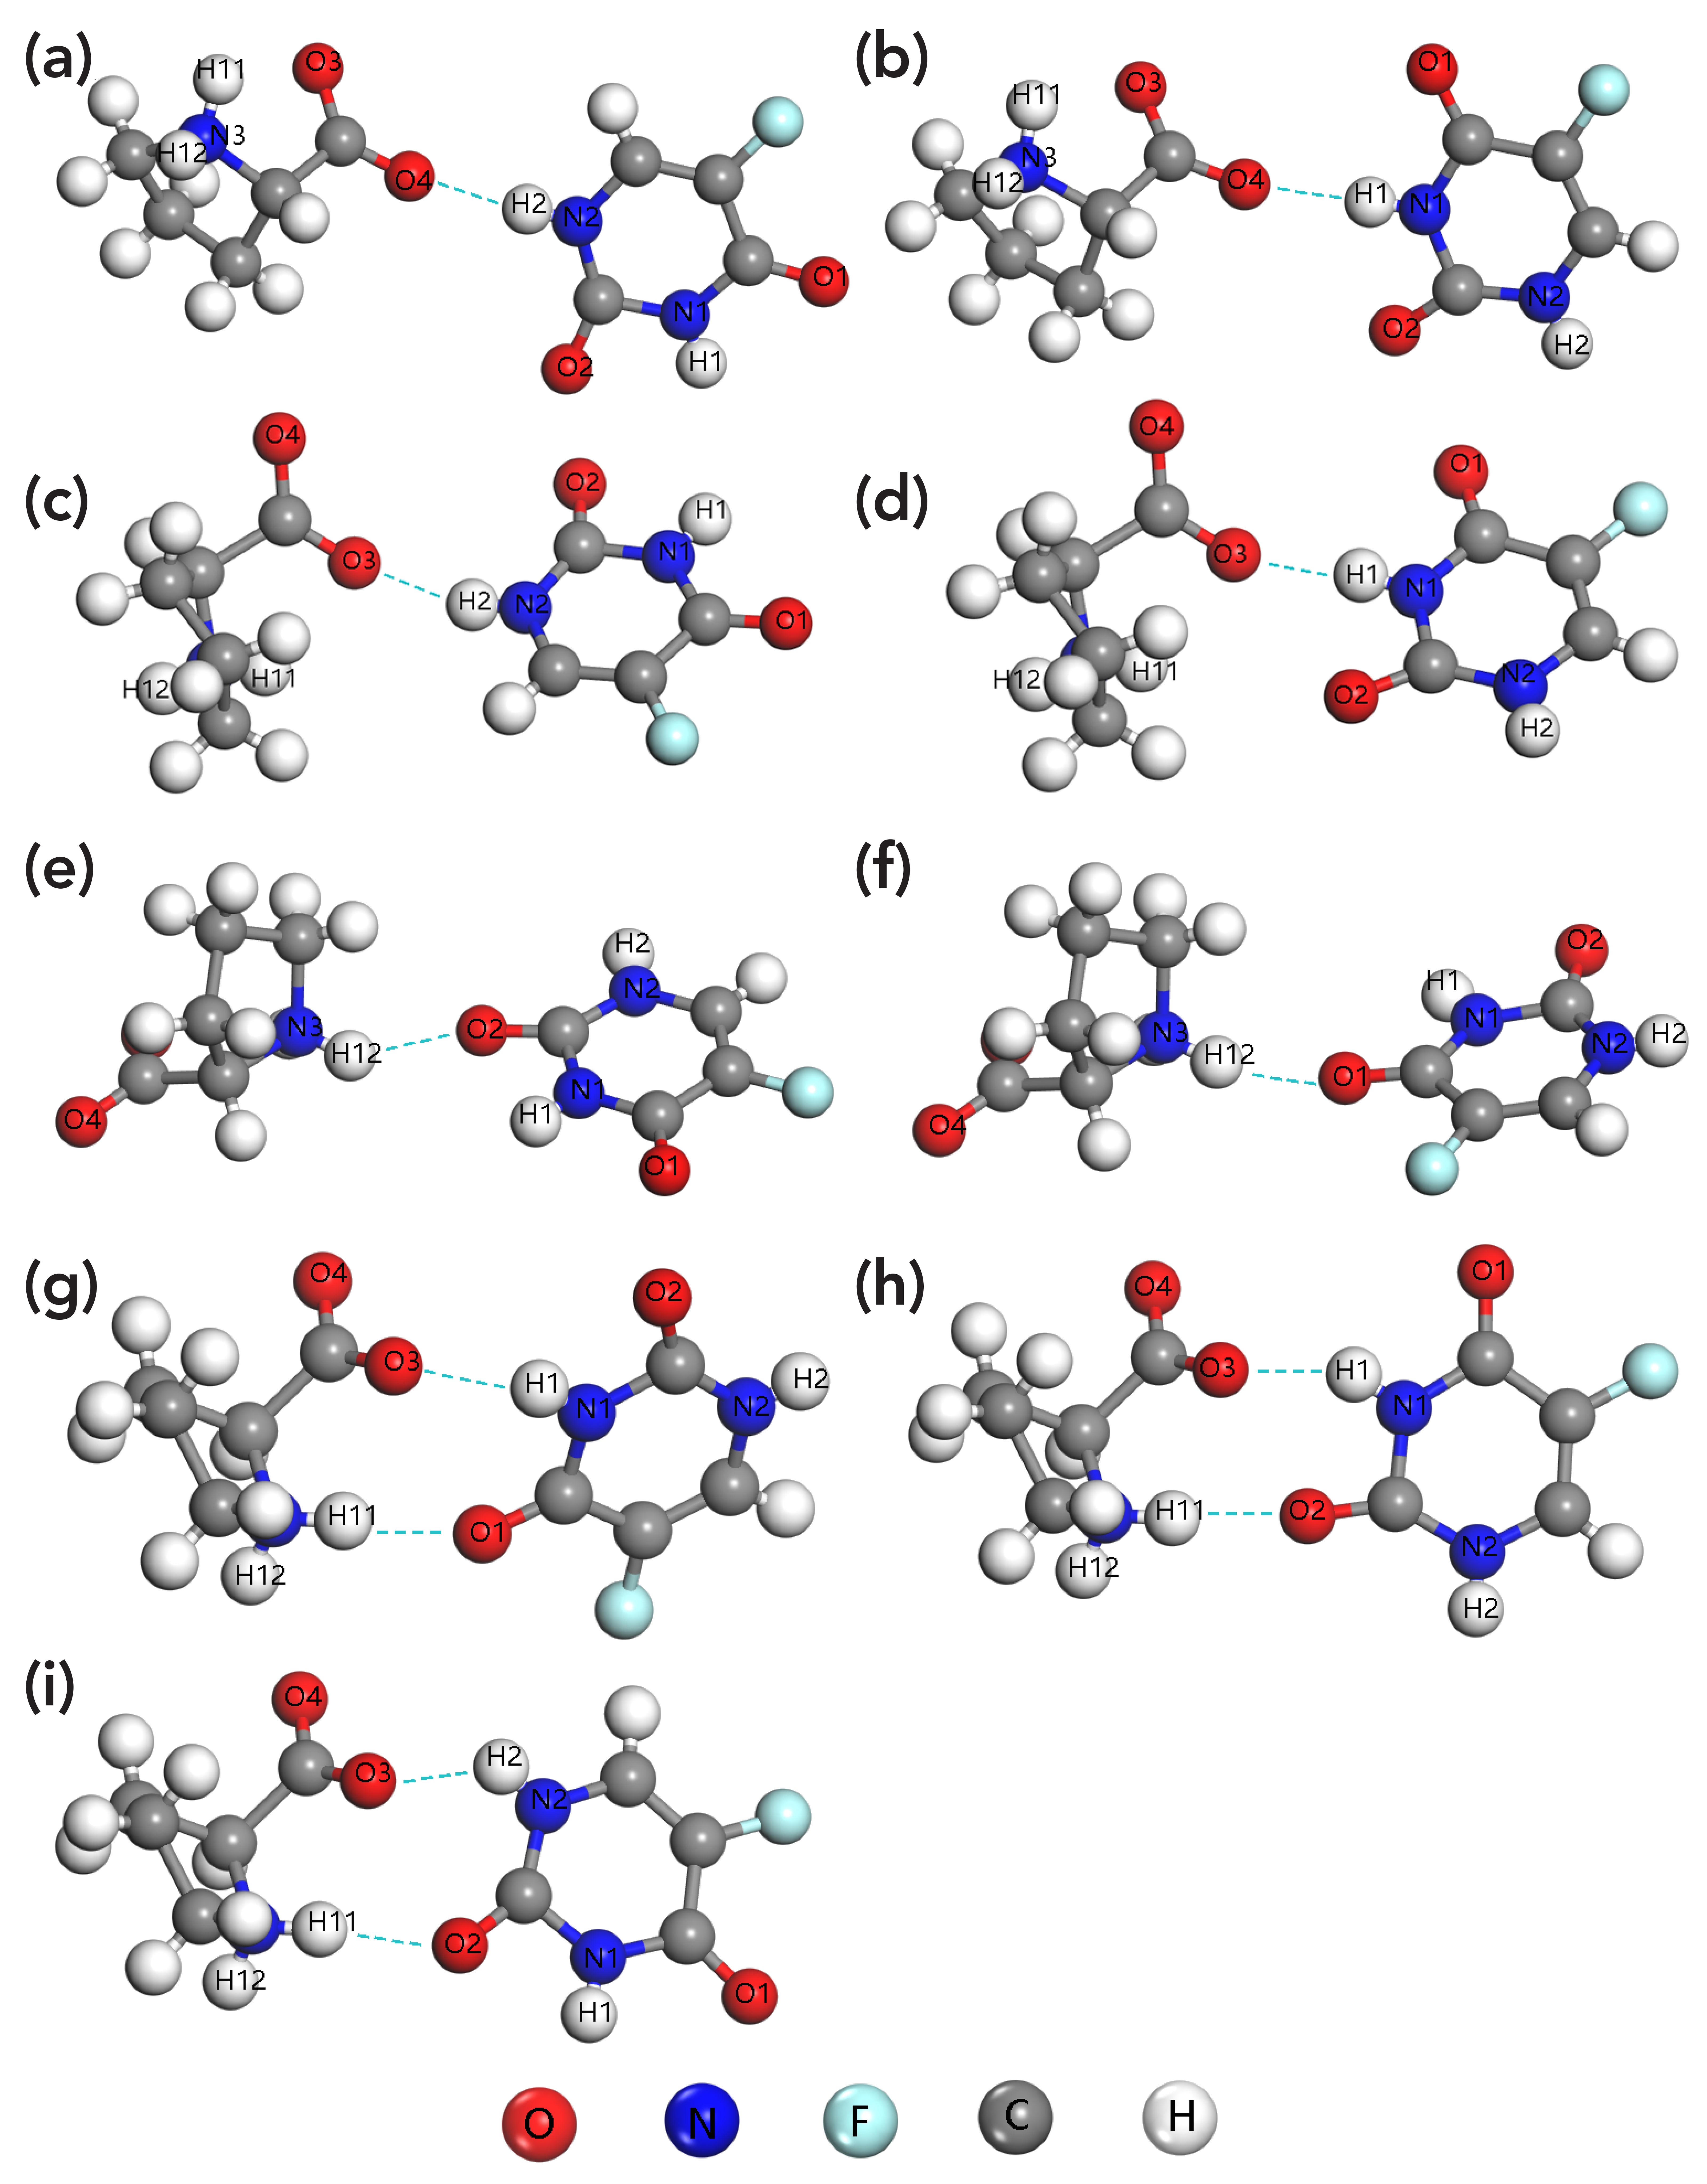
We have calculated the theoretical spectra based on nine different unit cells, as shown in Figure 6. There are four obvious absorption peaks in the theoretical spectrum of C1, which are 0.86, 1.16, 2.09, and 2.21 THz, respectively. There are six absorption peaks in the spectrum of C2, of which four absorption peaks are ap- parent, and two characteristic absorption peaks are weak. C3 has five obvious characteristic absorption peaks, located at 0.58, 1.15, 1.5, 1.99, and 2.35 THz. Compared with the other eight configurations, the theoretical absorption peak of C4 is the most, and there are seven absorption peaks. The absorption peaks of C5 are located at 0.55, 1, 1.33, 1.6, and 2.08 THz. There are four weak ab- sorption peaks in the theoretical spectrum of C6, which include one relatively strong absorption peak located at 2.28 THz. The number of theoretical absorption peaks of C7, C8, and C9 is 6, 5, and 5. There are significant differences in the theoretical spectra of different hydrogen bonding modes. This is because different hydrogen bond modes lead to different strengths of hydrogen bonds in the unit cell. The hydrogen bond itself is a noncovalent interaction. The stronger the noncovalent interaction, the more intense the intermolecular motion-induced (39).
FIGURE 6: The THz theoretical spectra of (a) to (i) as C1 to C9, respectively.
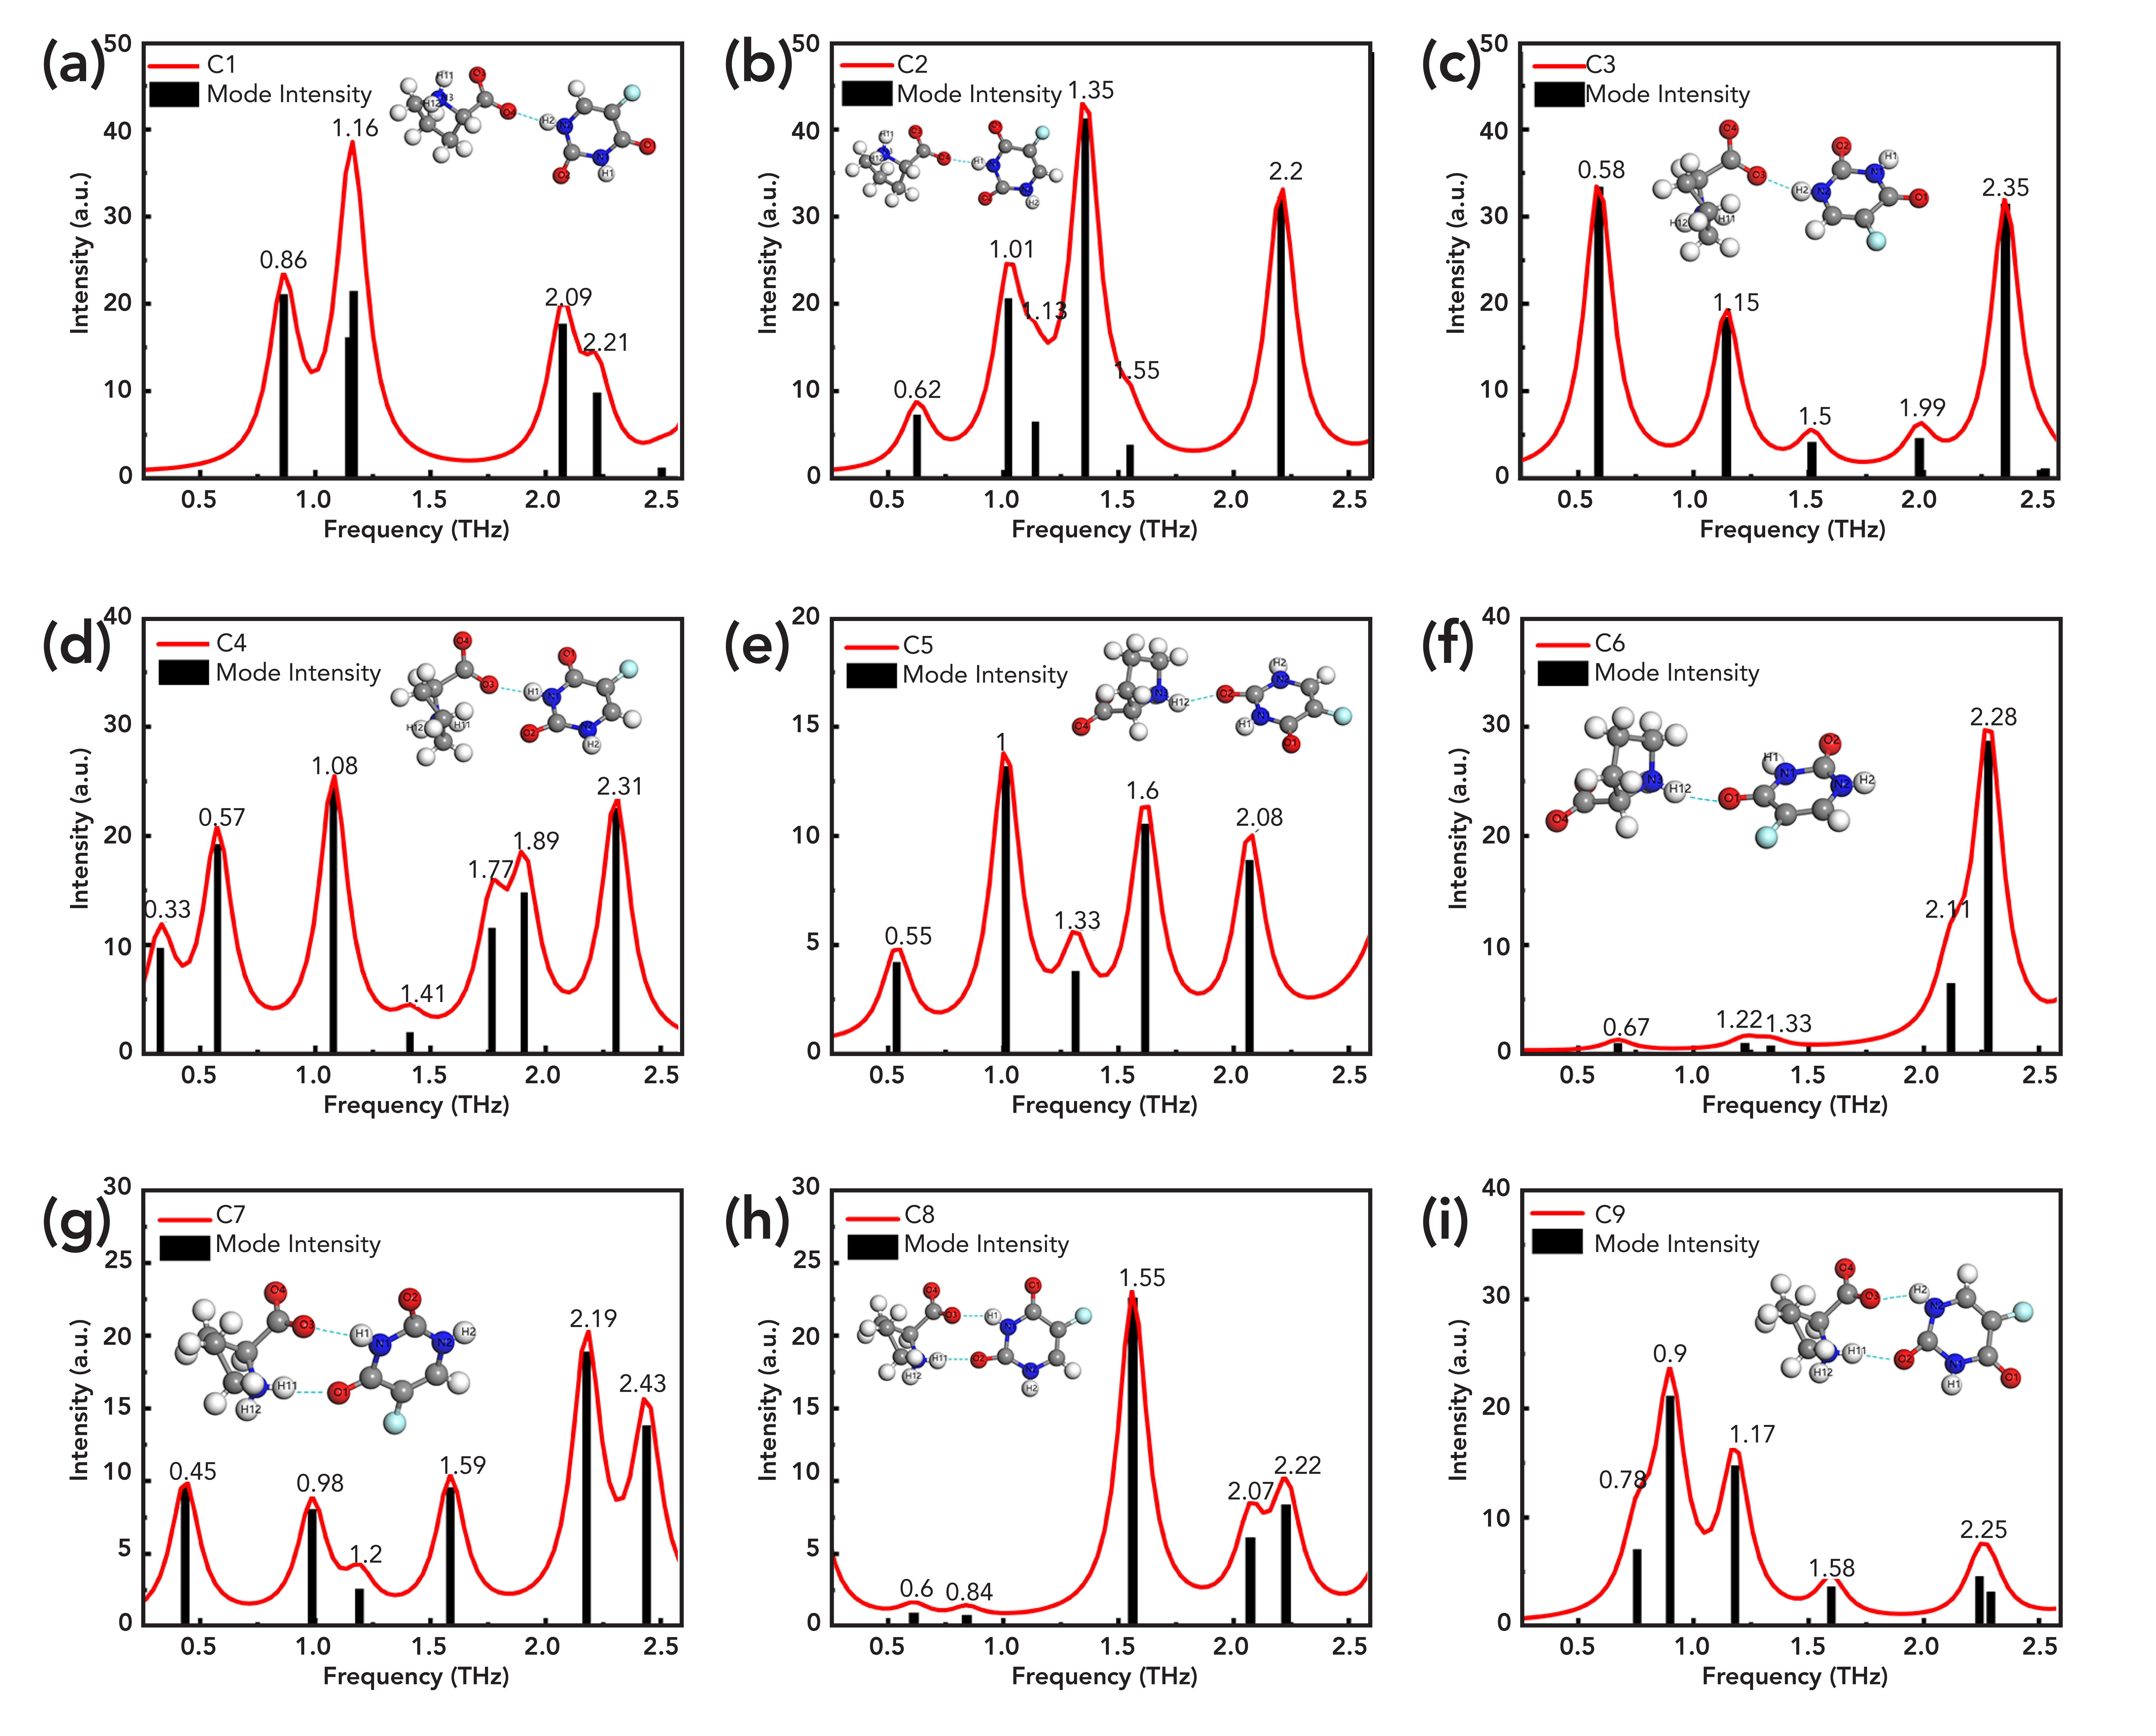
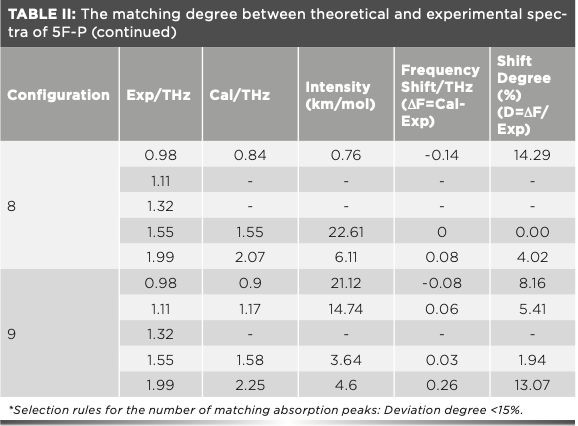
Moreover, the matching degree between theoretical and experimental spectra calculated by different hydrogen bonding modes are significantly different. As shown in Table II, the corresponding absorption peak numbers of the nine theoretical spectra are 3, 5, 3, 3, 4, 3, 4, 3, and 4, respectively. Based on the number of matching absorption peaks and the shifting degree of absorption peaks, it can be concluded that the hydrogen bonding modes of C2, C5, C7, and C9 are closer to the actual situation. It is worth noting that the N1–H1•••O4 hydrogen bond mode in C2 is theoretically the most consistent with the hydrogen bond of 5F-P.
Total Energy and Stability of 5F-P
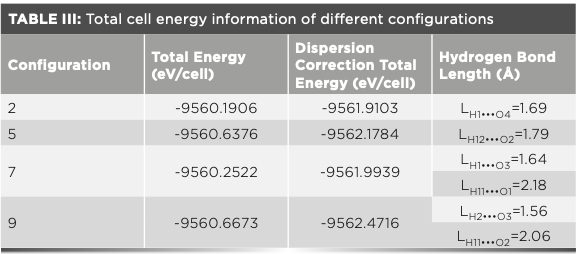
The four systems of C2, C5, C7, and C9 have atoms. The covalent bonds in the unit cell are also the same. The difference among them lies in the mode of hydrogen bonding. Because the hydrogen bond is only a non-covalent interaction and not a chemical bond, its strength cannot affect the overall stability. Besides, a complete system always tends to the lowest energy because the lower the total energy of a substance, the weaker its ability to react. This substance can continue to exist in the most stable state. Therefore, the more stable a substance is, the lower the total energy it carries (40). In this study, the total energy of the four better configurations (C2, C5, C7, and C9) was calculated by PBE+Grimme to compare their stability and further verify the accuracy of the conclusion in section 4.5. Table III shows that the total energy is 2 < 7 < 5 < 9 before correction, and the total energy after dispersion correction is the same as 2 < 7 < 5 < 9. Therefore, the system with C2 as the unit cell is the most stable. The intermolecular hydrogen bonding mode of 5F-P is most inclined to C2. This result is consistent with the results of THz spectroscopy.
Vibration Assignment of 5F-P
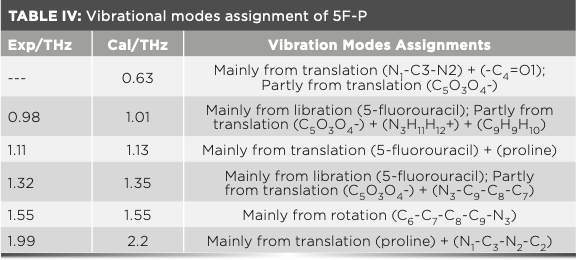
The comparison of the theoretical and experimental spectrum of 5F-P, as shown in Figure 7. The absorption peaks of 0.98, 1.11, 1.32, 1.55, and 1.99 THz in the experimental spectrum correspond to 1.01, 1.13, 1.35, 1.55, and 2.2 THz of the theoretical spectrum. It shows that the theoretical spectrum calculated by C2 simulates all the experimental absorption peaks of 5F-P. However, the theoretical absorption peak at 0.63 THz does not appear in the experimental spectrum. The reason is that the effect of water molecules cannot be eliminated entirely from the actual process and the low signal-to-noise ratio (S/N) of the equipment. As shown by the black arrow, the absorption peak at too low or too high frequency is annihilated by noise, making it difficult to detect accurately. Except for the absorption peak at 1.55 THz, other theoretical absorption peaks are blue-shifted to varying degrees relative to the experimental absorption peak. The reasons can be primarily attributed to the difference between the experimental (293 K) and the simulation temperature (0 K) (41,42). The change in temperature affects the size of the unit cell (43). The peak position and peak width of the theoretical spectrum will change accordingly. Because of the thermal expansion effect, the intermolecular distance increases with the temperature increasing, as does the bond length. The thermal expansion of the crystal lattice weakens the strength of the intermolecular interactions, resulting in the red-shift of the absorption peak (44,45). On the contrary, the absorption peak is blue-shifted. Therefore, the temperature difference affects unit cell simulation. It makes the frequency position of each absorption peak fluctuate to a certain extent, which is directly manifested as the theoretical absorption peak of C2 moving to a higher frequency. Some vibration modes exhibit an obvious red-shift with the increase of temperature, while others are less affected by temperature (46). The theoretical absorption peak at 1.55 THz does not have a blue-shift. This may be because the absorption peak originates from intramolecular and intermolecular vibrations in the THz band. The weak interactions have little effect on the vibration mode at this frequency. Therefore, the change in temperature cannot significantly affect the position of this absorption peak. In addition, another reason is the difference between actual and theoretical crystal structure. The simulation is based on the perfect crystal structure. However, it is difficult to reach the ideal degree in the experiment (47–49). The temperature effect and sample difference make the crystal parameters of experiment and theory not match exactly. It is manifested directly in the difference between experimental and theoretical spectra.
FIGURE 7: The THz experimental spectra of (green) 5F-P, and (red) the theoretical spectra of C2.
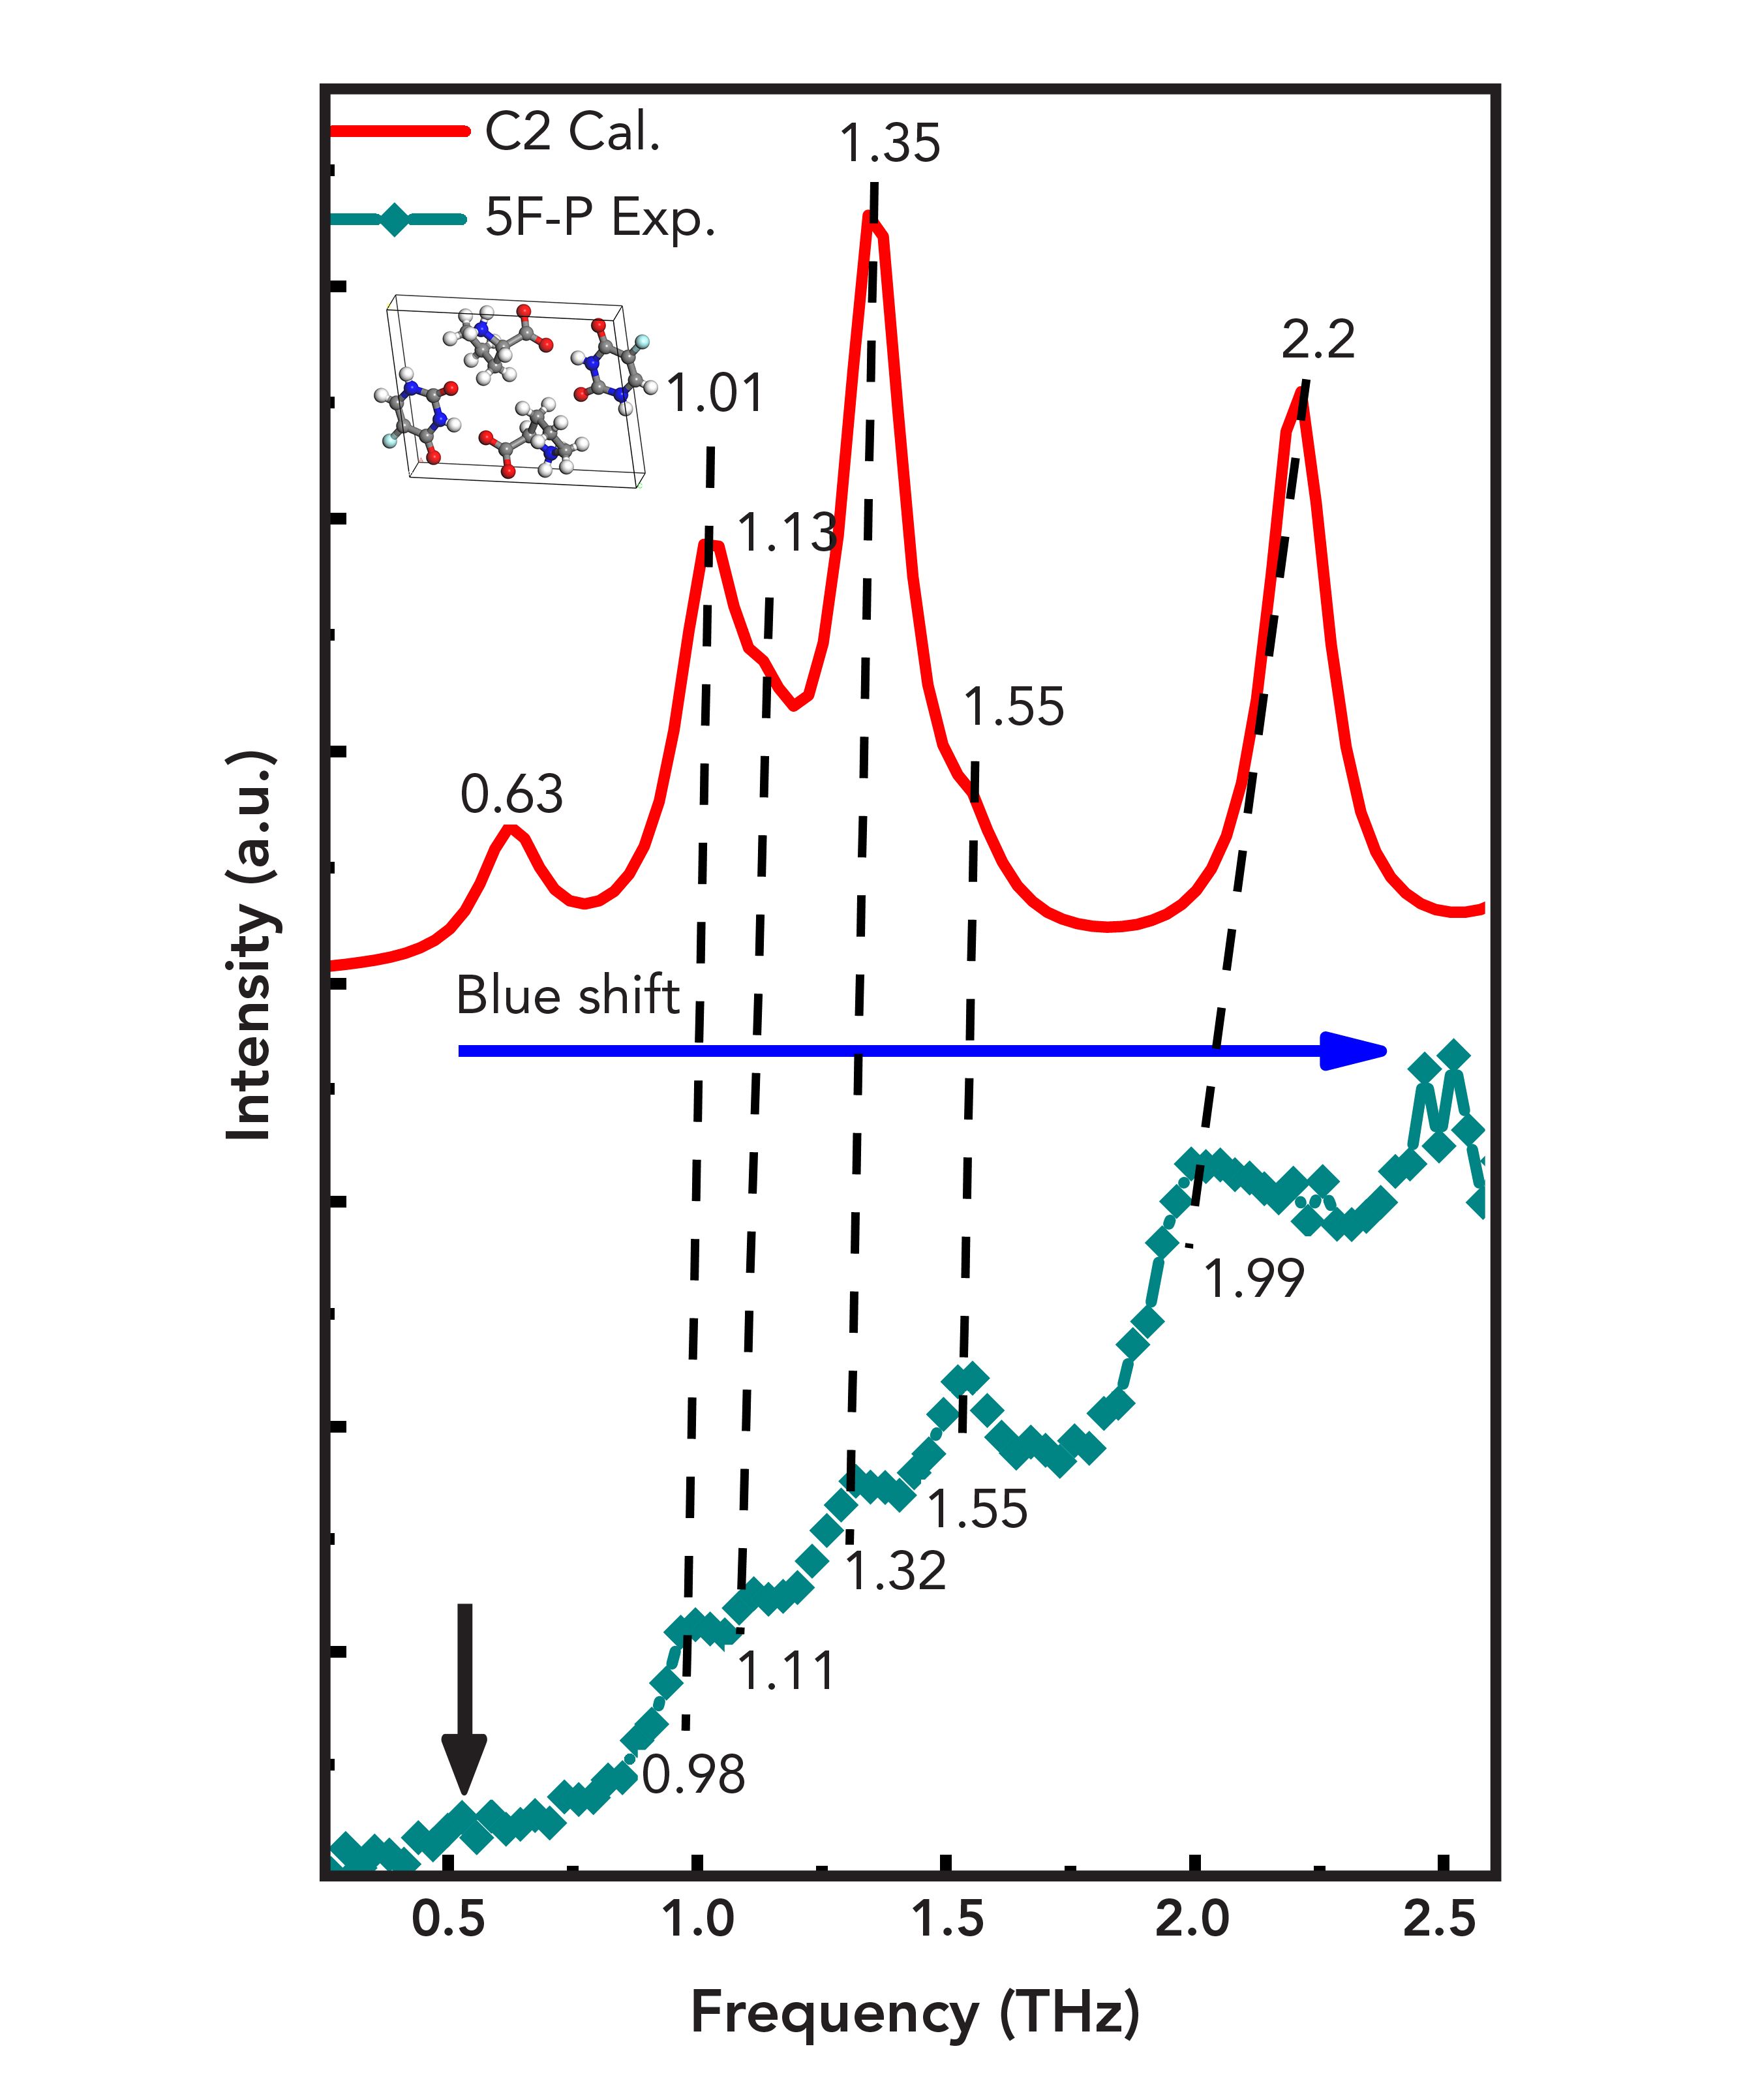
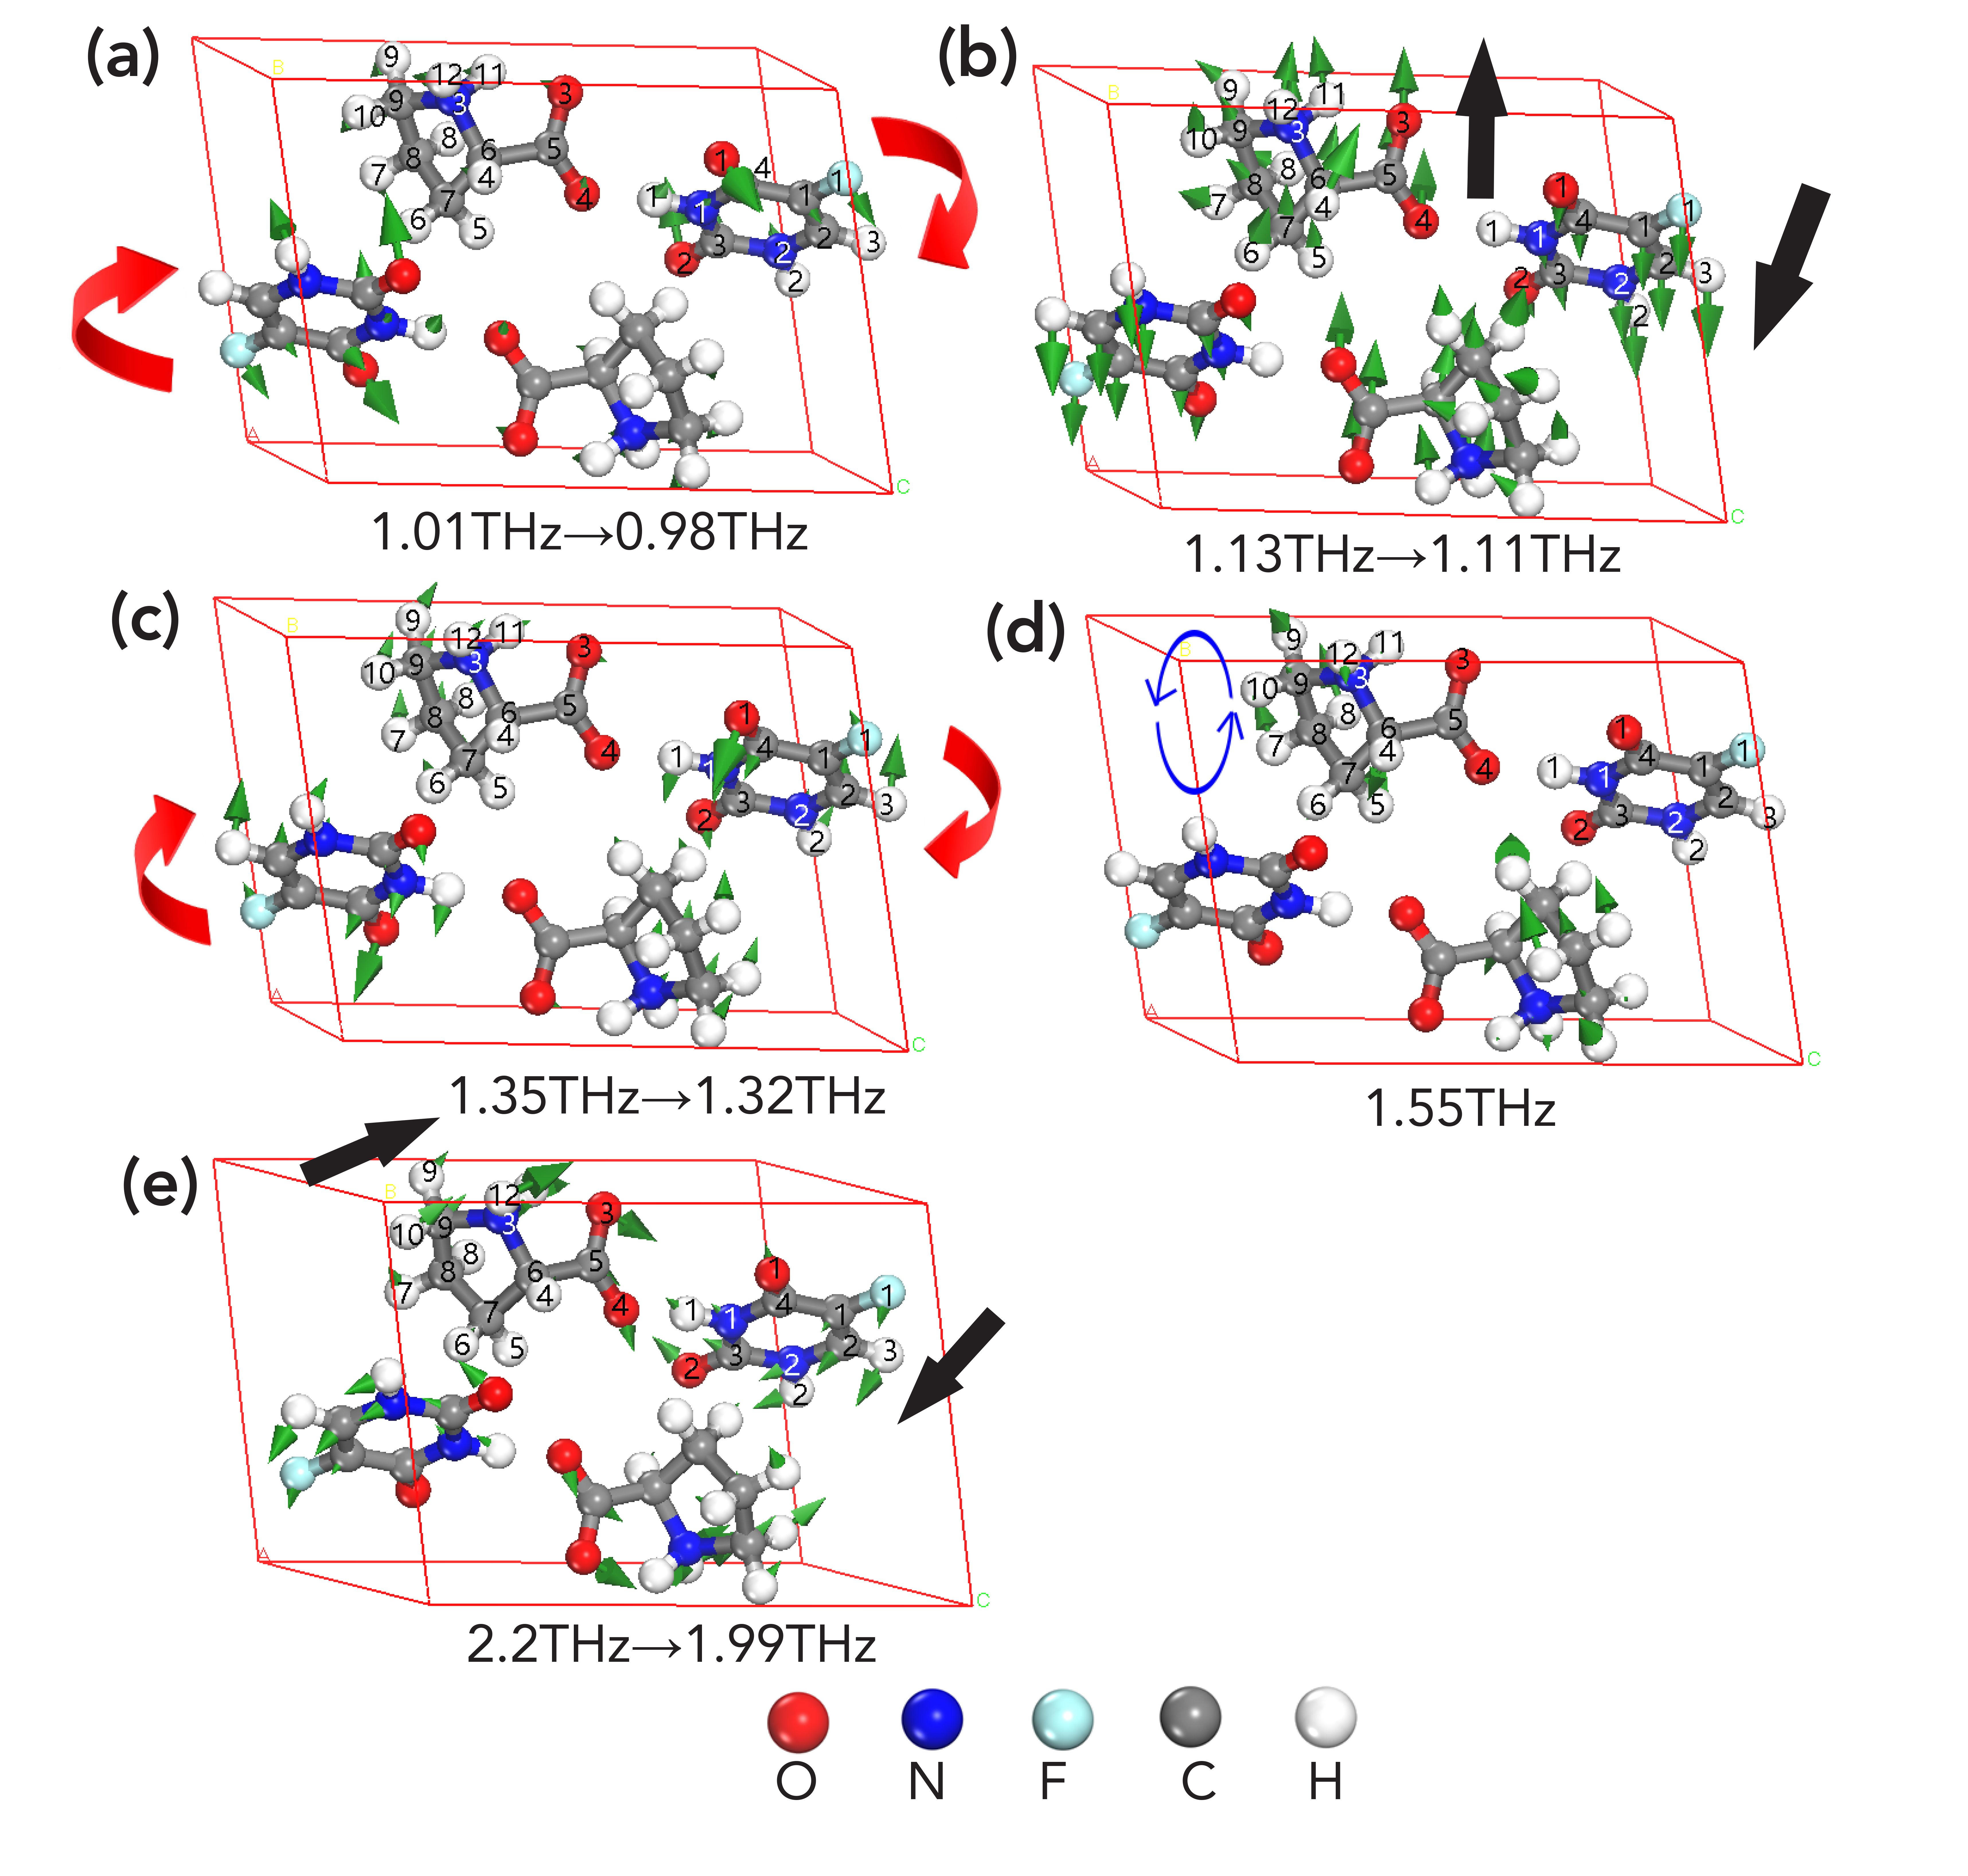
Figure 8 shows the vibration modes of the theoretical absorption peaks in the unit cell, corresponding to 0.98, 1.11, 1.32, 1.55, and 1.99 THz of the experimental absorption peaks, respectively. The vibration of C2 at 1.01 THz is mainly caused by the librational vibration of 5-FU along the b-axis. The vibration at 1.13 THz is attributed to the strong reverse translational vibration of Pro and 5-FU. The vibration at 1.35 THz is similar to 1.01 THz, mainly caused by the librational vibration of 5-FU along the b-axis, but the one-sided translational vibration of the five-membered ring on proline at 1.35 THz is more obvious. The absorption peak at 1.55 THz, assigned in rotational vibration of the five-membered ring on proline. In addition, it can be seen that the hydrogen bond vibration of N1–H1•••O4 between proline and 5-FU is close to zero. This result proves that the theoretical absorption peak at 1.55 THz does not blue-shift because the weak interaction has little effect at this position. The vibration at 2.2 THz is caused by the translational vibration of proline and unilateral 5-FU in the same direction.
FIGURE 8: The vibration mode of C2 at (a) 1.01, (b) 1.13, (c) 1.35, (d) 1.55, and (e) 2.2. THz (Black arrows represent translational vibration, red arrows represent librational vibration and blue arrows represent rotational vibration). The color code for atoms is given in the figure.
Conclusion
In this work, an investigation was conducted into the hydrogen bonding modes of 5F-P by combining THz-TDS and DFT. We found that the THz spectrum of 5F-P in the range from 0.25 to 2.6 THz is significantly different from the two monomers. Based on NBO analysis and hydrogen bond network structure, we constructed nine stable theoretical configurations of 5F-P. The THz theoretical spectra of differ- ent hydrogen bond modes are obtained by unit cell simulation, and the theoretical spectra of configuration 2 is the most consistent with the experimental spectra. The total energy of configuration 2 is the lowest and the structure is the most stable, which was determined by calculating the total energy of the system. Therefore, it can be seen that the proline and 5-FU in the 5F-P are connected by N1–H1•••O4 hydrogen bonding based on THz spectroscopy and system stability. These results demonstrate that THz-TDS can well characterize the formation of new phases. The combination of THz-TDS and DFT can effectively study the connection mode of hydrogen bonds.
Author Contributions
The manuscript was written through contributions of all authors. All authors have given approval to the final version of the manuscript. These authors contributed equally.
Notes
The authors declare no competing financial interest.
References
(1) E. Czinki and A.G. Csaszar, Chem. 9(4), 1008–1019 (2003).
(2) T. Balakrishnan, S. Sathiskumar, K. Ramamurthi, and S. Thamotharan, Mater. Chem. Phys. 186, 115–123 (2017).
(3) B. Ishimoto, K. Tonan, and S.-i. Ikawa, Spectrochim. Acta. A 56(1), 201–209 (2000).
(4) S.E. McLain, A.K. Soper, A.E. Terry, and A. Watts, J. Phys. Chem. B. 111(17), 4568–4580 (2007).
(5) R. Rai, S. Aravinda, K. Kanagarajadurai, S. Raghothama, N. Shamala, and P. Balaram, J. Am. Chem. Soc. 128(24), 7916–7928 (2006).
(6) S. Bronco, C. Cappelli, and S. Monti, J. Phys. Chem. B 108(28), 10101–10112 (2004).
(7) J.C. Ferreon and V. J. Hilser, Biochemistry-US 43(24), 7787–7797 (2004).
(8) B.J. Stapley and T.P. Creamer, Protein. Sci. 8(3), 587–595 (1999).
(9) E. Fermi, Rend. Accad. Naz. Lincei. 6(602–607), 5 (1927).
(10) A.V. Belyakov, M.A. Gureev, A.V. Garabadzhiu, V.A. Losev, and A.N. Rykov, Struct. Chem. 26(5–6), 1489–1500 (2015).
(11) C. Heidelberger, N. Chaudhuri, P. Danne- berg, D. Mooren, L. Griesbach, R. Duschinsky, R. Schnitzer, E. Pleven, and J. Scheiner, Nature 179(4561), 663–666 (1957).
(12) H. Baba, K. Teramoto, T. Kawamura, A. Mori, M. Imamura, and S. Arii, Cancer. Chemoth. Pharm. 52(6), 469–476 (2003).
(13) N. Shan and M. J. Zaworotko, Drug Discov Today 13(9–10), 440–446 (2008).
(14) F. Lara-Ochoa and G. Espinosa-PÉRez, Supramol. Chem. 19(8), 553–557 (2007).
(15) P. Vishweshwar, J.A. McMahon, J.A. Bis, and M.J. Zaworotko, J. Pharm. Sci. 95(3), 499–516 (2006).
(16) G. Chałasiński and M.M. Szczȩśniak, Chem. Rev. 100(11), 4227–4252 (2000).
(17) C.A. Franca, S.B. Etcheverry, R. Pis Diez, and P.A.M. Williams, J. Raman Spectrosc. 40(9), 1296–1300 (2009).
(18) J.L. Finney, J.M. Goodfellow, P.L. Howell, and F. Vovelle, J. Biomol. Struct. Dyn. 3(3), 599–622 (1985).
(19) Z.-P. Zheng, W.-H. Fan, H. Yan, J. Liu, W.-Z. Yang, and S.-L. Zhu, J. Mo. Spectrosc. 281, 13–17 (2012).
(20) A. Heinz, C.J. Strachan, K.C. Gordon, and T. Rades, J. Pharm. Pharmacol. 61(8), 971–988 (2009).
(21) M. Walther, P. Plochocka, B. Fischer, H. Helm, and P. Uhd Jepsen, Biopolymers 67(4–5), 310–313 (2002).
(22) M. Ge, H. Zhao, W. Wang, Z. Zhang, X. Yu, and W. Li, J. Biol. Phys. 32(5), 403–412 (2006).
(23) Y. Du, Y. Wang, J. Xue, J. Liu, J. Qin, and Z. Hong, Spectrochim. Acta. A. Mol. Biomol. Spectrosc. 224, 117436 (2020).
(24) D.G. Allis, J.A. Zeitler, P.F. Taday, and T.M. Korter, Chem. Phys. Lett. 463(1–3), 84–89 (2008).
(25) P.M. Hakey, D.G. Allis, M.R. Hudson, W. Ouellette, and T.M. Korter, Chemphyschem. 10(14), 2434–2444 (2009).
(26) M.D. King and T.M. Korter, J. Phys. Chem. A 114(26), 7127–7138 (2010).
(27) S.P. Delaney and T.M. Korter, J. Phys. Chem. A 119(13), 3269–3276 (2015).
(28) C. Funaki, S. Yamamoto, H. Hoshina, Y. Ozaki, and H. Sato, Polymer 137, 245–254 (2018).
(29) Q. Zhou, Y. Shen, Y. Li, L. Xu, Y. Cai, and X. Deng, Spectrochim. Acta. A. Mol. Biomol. Spectrosc. 236, 118346 (2020).
(30) M.D. Segall, P.J.D. Lindan, M.I.J. Probert, C.J. Pickard, P.J. Hasnip, S.J. Clark, and M.C. Payne, J. Physics: Condensed Matt. 14(11), 2717–2744 (2002).
(31) J.P. Perdew, K. Burke, and M. Ernzerhof, Phys. Rev. Lett. 77, 3865 (1996); Erratum Phys. Rev. Lett. 78, 1396 (1997).
(32) M.D. King, W. Ouellette, and T. M. Korter, J. Phys. Chem. A 115(34), 9467–9478 (2011).
(33) V. Sasisekharan, Acta. Crystallographica 12(11), 941–942 (1959).
(34) C. Moisescu-Goia, M. Muresan-Pop, and V. Simon, J. Mol. Struct. 1150, 37–43 (2017).
(35) A.C. Jorgensen, C.J. Strachan, K.H. Pol- lanen, V. Koradia, F. Tian, and J. Rantanen, J. Pharm. Sci. 98(11), 3903–3932 (2009).
(36) M.D. King, W.D. Buchanan, and T.M. Korter, Phys. Chem. 13(10), 4250–4259 (2011).
(37) J.J. Koenig, J.M. Neudorfl, A. Hansen, and M. Breugst, Acta. Crystallogr. E. Crystallogr. Commun. 74(8), 1067–1070 (2018).
(38) A.T. Hulme, S.L. Price, and D.A. Tocher, J. Am. Chem. Soc. 127(4), 1116–1117 (2005).
(39) L. Xu, Y. Li, Q. Zhou, and X. Deng, Spectrochim. Acta. A. Mol. Biomol. Spectrosc. 224, 117468 (2020).
(40) B. Xiao, J. Feng, C.T. Zhou, J.D. Xing, X.J. Xie, and Y.H. Chen, Chem. Phys. Lett. 459(1–6), 129–132 (2008).
(41) M.D. King, W.D. Buchanan, and T.M. Korter, J. Pharm. Sci. 100(3), 1116–1129 (2011).
(42) M.T. Ruggiero, J.A. Zeitler, and A. Erba, Chem. Commun. (Camb). 53(26), 3781–3784 (2017).
(43) A.D. Squires, A.J. Zaczek, R.A. Lewis, and T.M. Korter, Phys. Chem. Chem. Phys. 22(35), 19672–19679 (2020).
(44) N. Laman, S.S. Harsha, D. Grischkowsky, and J.S. Melinger, Biophys. J. 94(3), 1010–1020 (2008).
(45) L.M. Lepodise, J. Horvat, and R.A. Lewis, J. Phys. Chem. A 119(2), 263–270 (2015).
(46) Y. Shen, P. Upadhya, E. Linfield, and A.G. Davies, Appl. Phys. Lett. 82(14), 2350–2352 (2003).
(47) S. Zong, G. Ren, S. Li, B. Zhang, J. Zhang, W. Qi, J. Han, and H. Zhao, J. Mol. Struct. 1157, 486–491 (2018).
(48) G. Ren, S. Zong, Z. Zhu, C. Cheng, L. Chen, L. Zhou, J. Zhang, L. Liu, J. Han, and H. Zhao, Spectrochim. Acta. A. Mol. Biomol. Spectrosc. 225, 117476 (2020).
(49) B. Zhang, S. Li, C. Wang, T. Zou, T. Pan, J. Zhang, Z. Xu, G. Ren, and H. Zhao, Spectrochim. Acta. A. Mol. Biomol. Spectrosc. 190, 40–46 (2018).
Zhenqi Zhu, Yujing Bian, Xun Zhang, and Bin Yang are with the College of Textile Science and Engineering at Zhejiang Sci-Tech University in Hangzhou City, People’s Republic of China. Direct correspondence to: yangbin5959@zstu.edu.cn.

Geographical Traceability of Millet by Mid-Infrared Spectroscopy and Feature Extraction
February 13th 2025The study developed an effective mid-infrared spectroscopic identification model, combining principal component analysis (PCA) and support vector machine (SVM), to accurately determine the geographical origin of five types of millet with a recognition accuracy of up to 99.2% for the training set and 98.3% for the prediction set.