Raman Spectroscopy as a Tool for the Quantitative Estimation of Chromium Aluminum Oxide Content in Chromite
Raman measurements of chromite minerals demonstrated that chromium content could be accurately determined, supporting a possible application of portable Raman devices on Earth or in space for mineral analysis of asteroids and planets.
Raman spectroscopy has been applied to study a range of chromites (Fe2+, Mg)(Cr, Al, Fe3+)2O4 with variable chromium to aluminum to iron contents to ascertain conclusions about possible correlations between the chromium concentration and the position of the main Raman peaks within this mineral. Our intention was to examine chromite grains from different paragenesis, which vary significantly in their chromium content, to observe changes in the Raman spectra of this mineral. It was found that a negative correlation exists between the chromium number, calculated from the electron microprobe data, and the Raman peak number. Chromite grains with high chromium numbers show a low Raman peak, whereas samples with low chromium number show a higher Raman peak. Therefore, it is possible to infer a relationship between the mineral composition and Raman bands for this type of spinel. The measurements have clearly shown that it is possible to draw precise conclusions about the chromium content of the mineral based on the Raman peak alone. This finding supports a possible application of portable Raman devices on Earth or in space for asteroids and planets.
Raman spectroscopy has gained increasing importance in almost all areas of earth and material sciences. This is particularly true in studies of mineralogy, petrology, and volcanology. Raman spectroscopy has also gained increased importance in studying the geology of ore deposits and extraterrestrial materials, where both qualitative and quantitative estimates of the mineral content are essential. Moreover, it is emerging as a powerful and critical tool for analyzing the structural, chemical, and physical properties of crystalline solids, liquids, and glassy materials in a very effective and mostly nondestructive way (1–4). In earth science research, Raman spectroscopy provides simple and inexpensive utility in the characterization of structural modifications, elemental concentrations, or polytypism, and polymorphism in some of the major rock-forming minerals (3, 5, 6). For example, Raman peak shifts can be used to correlate spectral and chemical features, either in the laboratory or in the field (with portable Raman devices). In fact, given its versatile character, it is conceivable that one could construct miniaturized Raman systems that could readily be installed in planetary “rovers,” thereby facilitating quantitative surface analyses of other terrestrial planets or small bodies (4,7). However, to convert the Raman results into quantitative information, it is sometimes necessary to compare those results with compositional analysis achieved using other methods of mineral analysis (such as electron probe microanalysis [EPMA] or X-ray diffraction analysis [XRD]).
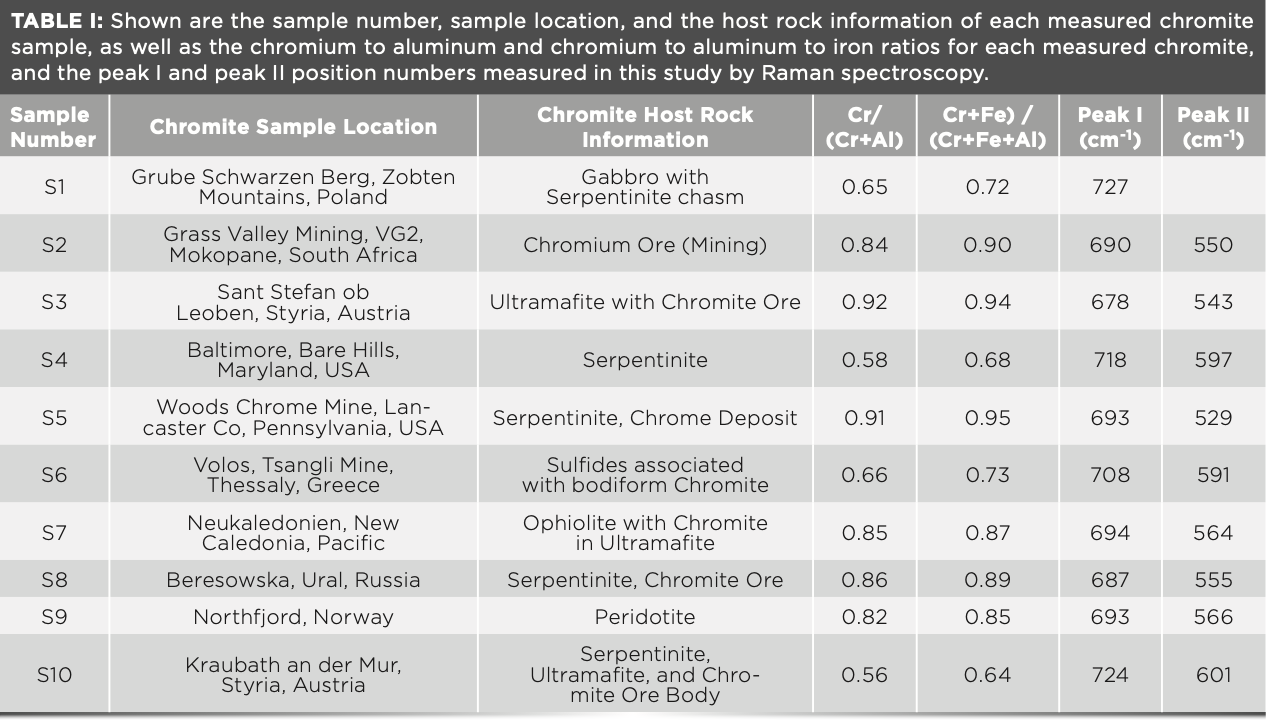
In this study, 10 highly chemically variable chromite grains (S1–S10) obtained from ophiolites, serpentinites, and a range of ore bodies here on Earth (Table I) were analyzed by micro-Raman spectroscopy to explore the relationships between Raman peak shifts and mineral chemistry, as determined by EPMA.
The chromium, aluminum, and iron content of the chromite was defined and correlated in various ways. For the calculation of the investigated chromites, we used the general formula for this mineral, (Fe2+, Mg)(Cr, Al, Fe3+)2O4, and calculated the chromite number (#Cr), as:
#Cr = Cr/(Cr + Al) [1]
Chemical and Spectral Features of Chromites
The most important host rocks for chromites are ultramafic mantle rocks, such as the obducted peridotite and serpentinite bodies found within ophiolite complexes (8–10). Chromite may also be found in ultramafic igneous rock sequences, in ore complexes, or in metamorphic terrains. Because of its comparatively high hardness, density, and stability, this mineral can also be found in the heavy mineral fraction of sedimentary rock within basinal sequences.
Chromite belongs to the spinel group of minerals (11), where magnesium frequently substitutes for iron (2+) and chromium substitutes for aluminum or iron (3+) in the crystal lattice. The peak shift in chromite is a function of relative proportions in chromium and aluminum (iron). Chromite has a spinel-type structure AB2O4 belonging to the Fd3m space group, where two formula units (Fe2+ ,Mg2+)IV and (Cr3+, Fe3+, Al3+)VI comprise its primitive unit cell (12, 14, 15). Normal spinel and chromite have a cubic-closed packing structure, where oxygen anions, along with trivalent metal cations (chromium, aluminium, and ferric iron), occupy half of the octahedral interspaces, and other divalent cations (ferrous iron and magnesium) occupy one-eighth of the tetrahedral interspaces (12).
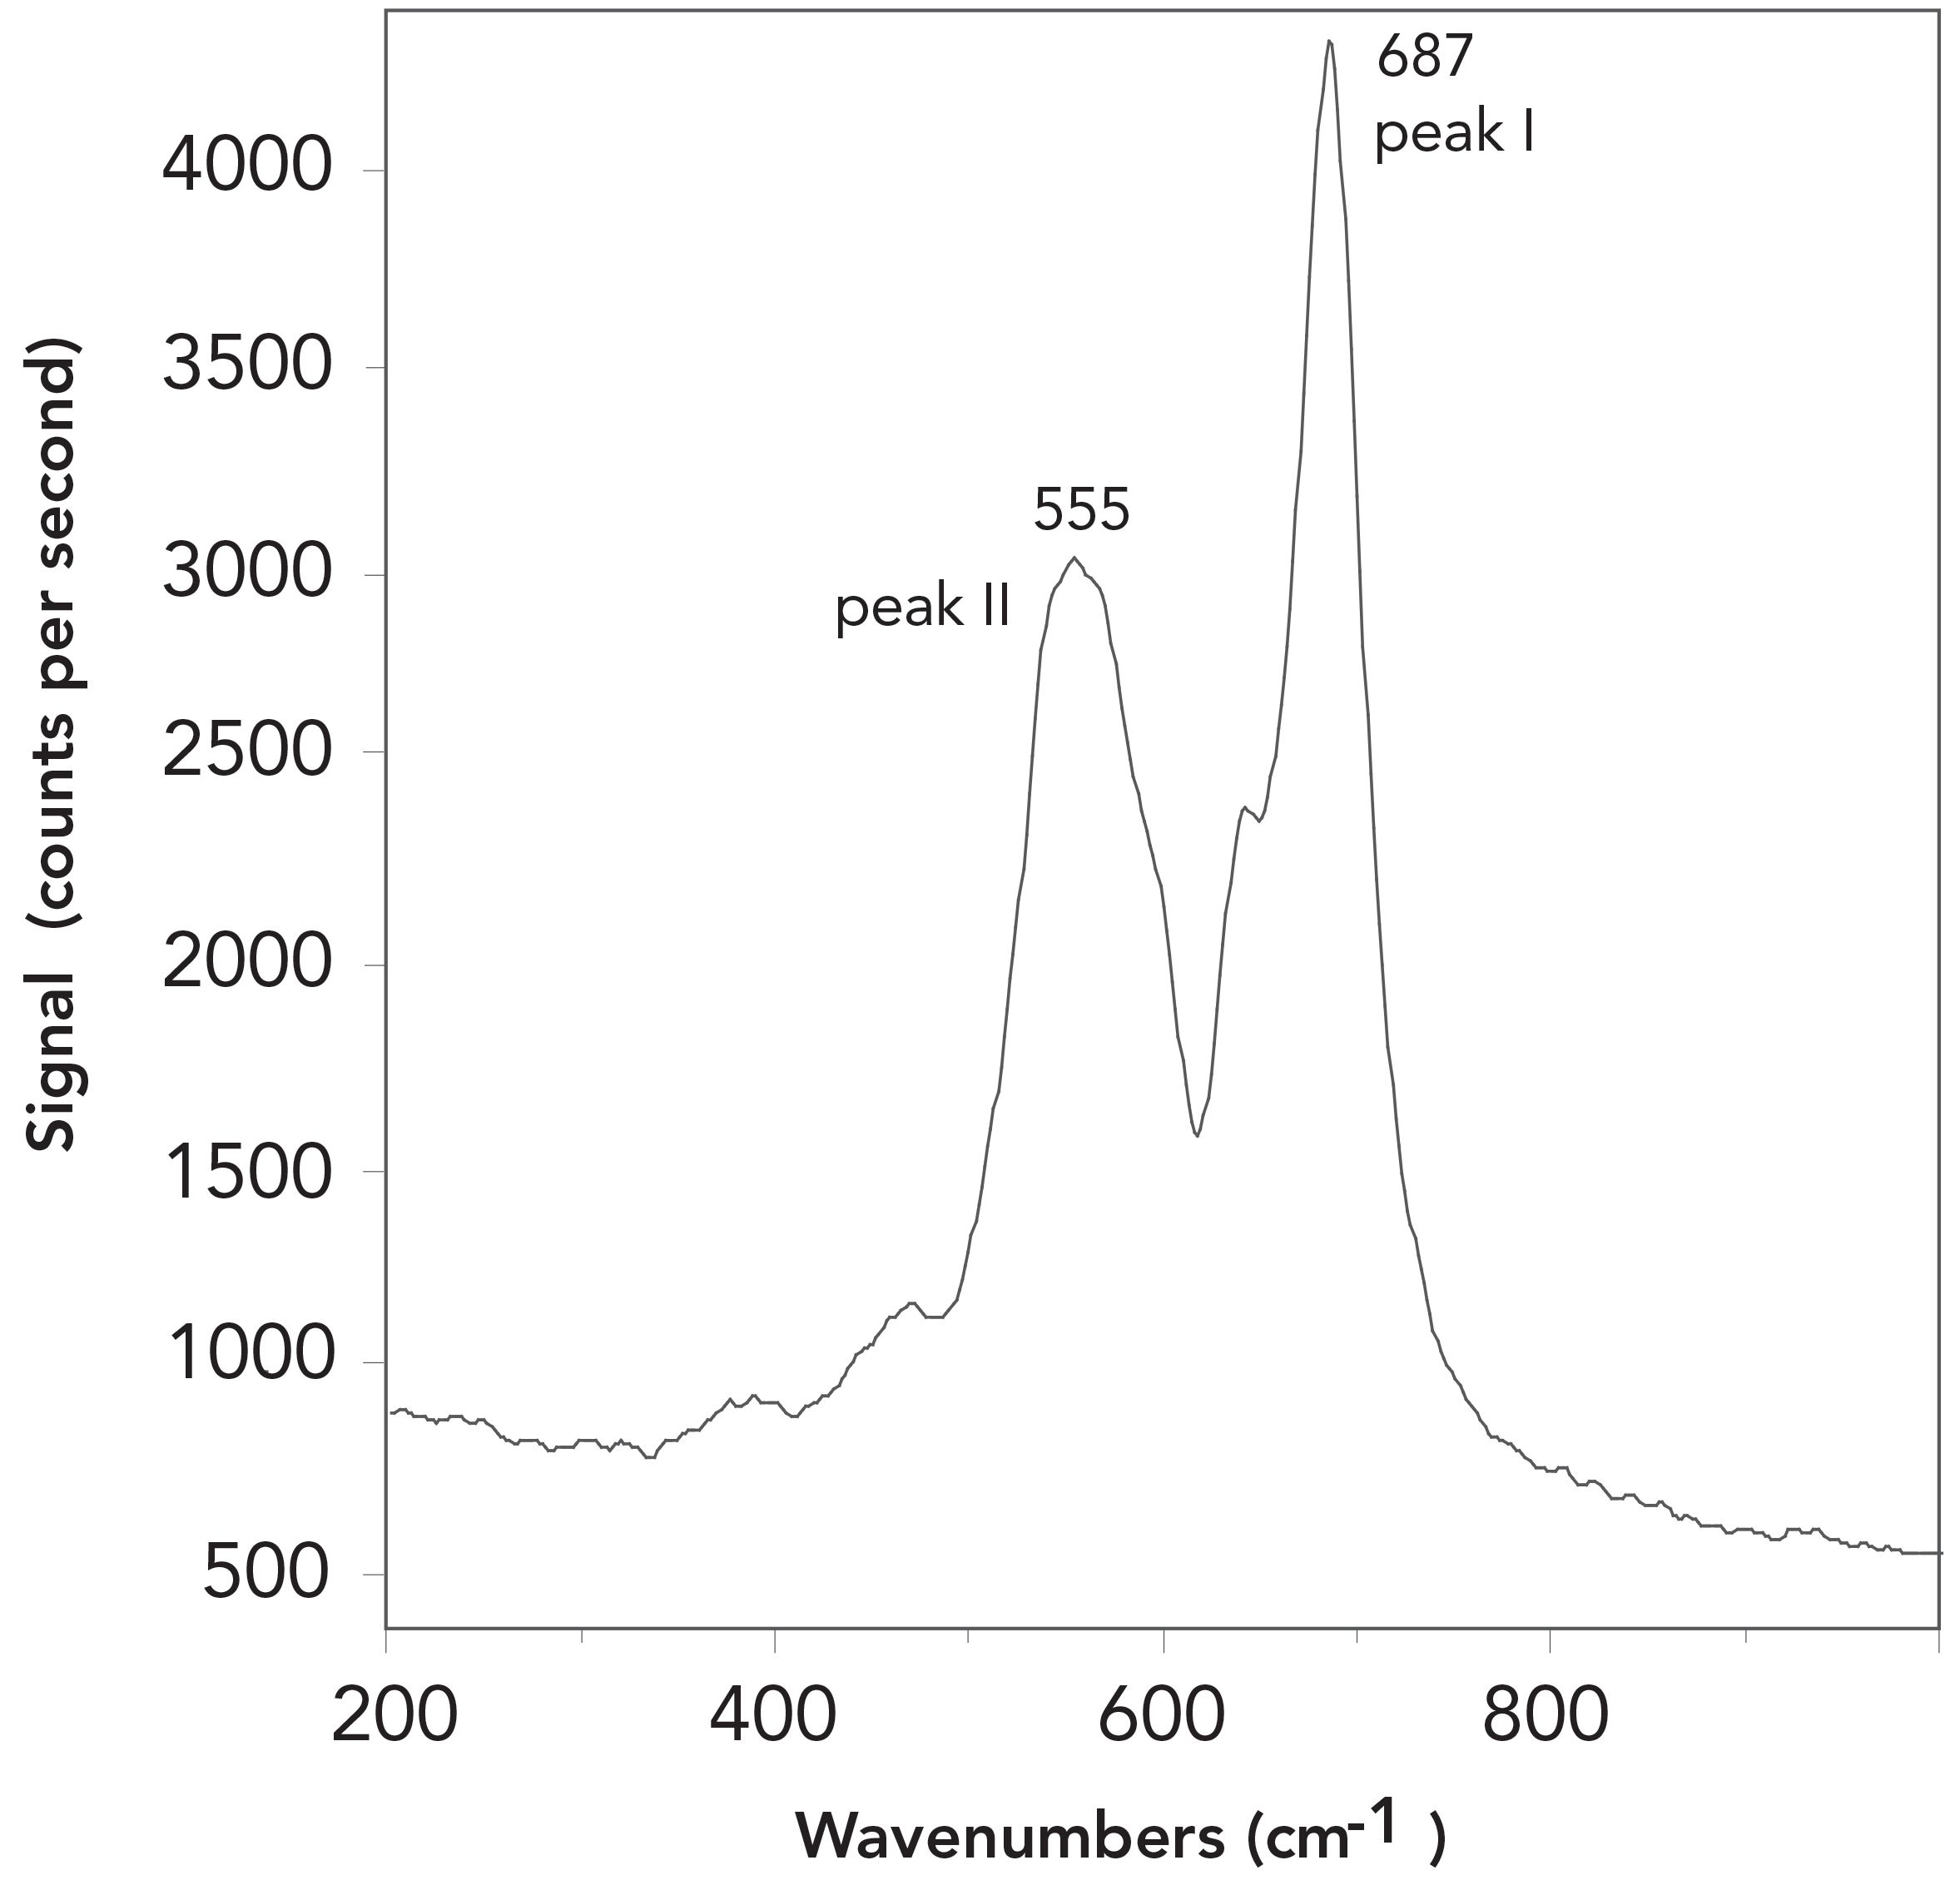
Figure 1 shows a typical Raman double peak for chromite. Two clear principal peaks can be observed at 555 cm-1 and 687 cm-1 (with a margin of error of less than ±1 cm-1), and represent the main distinguishing feature in the identifying chromite by Raman spectroscopy. The typical Raman spectral pattern, as determined for end-member chromite, consists of a major broad peak near 685 cm-1 with a weak shoulder, and a secondary peak near 650 cm-1. It has been shown that the strongest peak (in this work ascribed as peak I) may vary between 678 cm-1 and 727 cm-1 (Table I), with its assignment to the A1g mode (14). This feature presumably is generated by the bonds in the (Cr3+, Al3+, Fe3+) 6-compound octahedron. Figure 2 shows how the weaker peak (herein peak II( may also vary its position from 529 to 601 cm-1. Peak II could be assigned to F2g mode (13).
FIGURE 1: A typical Raman spectrum for chromite. It is obvious that chromite has two clear principal peaks, which are labelled as peak I (with a peak number of 687 cm-1) and peak II (with a peak number of 555 cm-1). Both peaks have an error of less than ±1 cm-1. Peak I displays a small peak at the left shoulder to which less attention is focused; it was shown not to be important for our results.
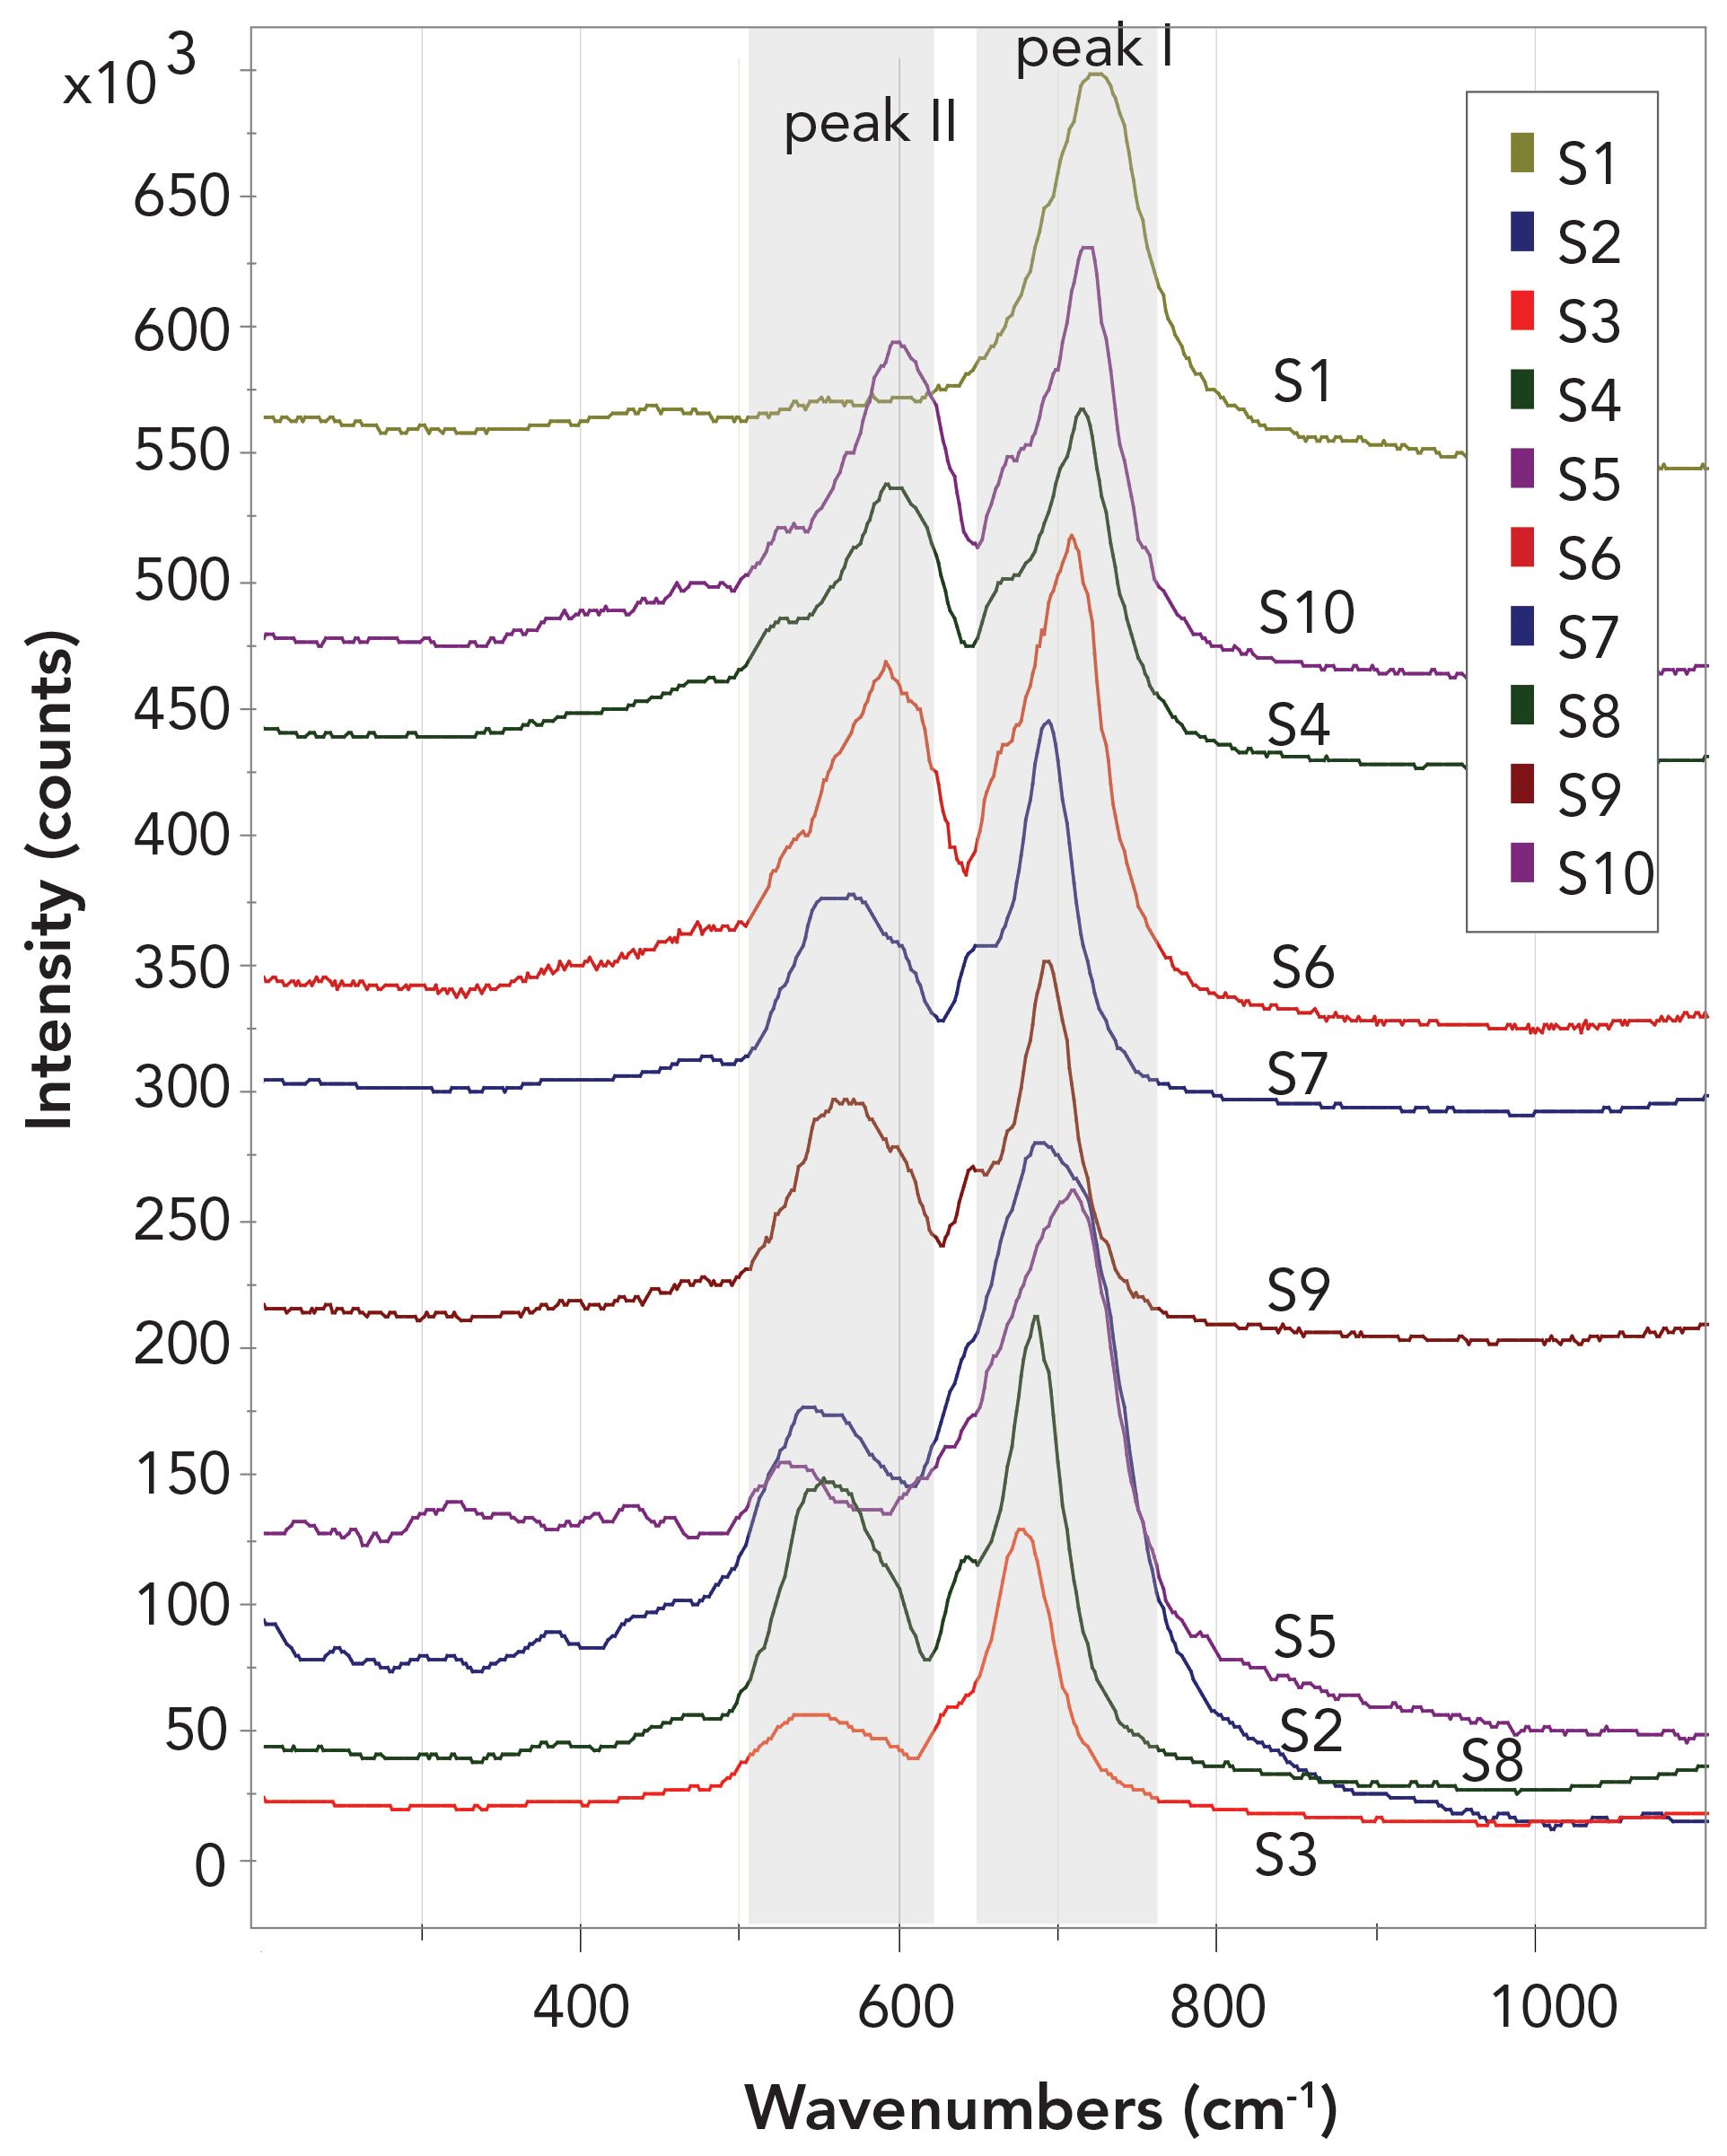
This study focused on the positions of peak I and peak II for chromite minerals and, where relevant, identified the displacement of these peaks relative to endmember chromite. It became clear that the shift of these two peaks reflects the chemical composition of the respective chromite mineral (Figure 2). The position of the small shoulder, which partly occurs on peak I, at lower wavenumbers than the peak maximum was not included in this analysis.
FIGURE 2: Shows one Raman chromite measurement each of the 10 different samples (S1 to S10) measured. It can be clearly seen that both peak I and peak II shift. This shift of the main peaks is dependent on the Cr to Al to Fe ratio. The range of scatter values varies from 529 to 601 cm-1 for peak II, and from 678 to 727 for peak I. The measurements reveal a significant shift that is coupled to a change in mineral chemistry, that is the composition of the various chromite samples.
Methods and Materials
Electron Microprobe
For EPMA measurements, we utilized a Cameca SX 100 electron probe that was equipped with five wavelength-dispersive spectrometers and an advanced micro-beam automation for the EPMA analyses. The probe was also equipped with a back-scattered electron (BSE) detector.
For the analyses, an accelerating voltage of 15 kV was applied with a beam current of 20 nA and a nominal beam diameter of 1 μm. A range of natural minerals and synthetic samples were used as standards for crystal calibration and peak assignments: Wollastonite was the standard for calcium and silicon, synthetic nickel oxide for nickel, periclase for magnesium, sphalerite for zinc, corundum for aluminum, hematite for iron, escolaite and chromite for chromium, ilmenite for manganese and titanium, albite for sodium, and orthoclase for potassium. Matrix correction followed the procedures outlined in the literature (15,16). The reproducibility of standard analysis was <1% for each element routinely analyzed. The measurements were performed on polished grain mounts of chromite embedded in epoxy; samples were coated with a thin carbon layer.
Raman Spectroscopy
Raman spectroscopic investigations were carried out using a XploRa One micro-Raman instrument (Horiba Jobin Yvon) operating with the software LabSpec5. The spectrometer was equipped with edge filters, a Peltier cooled CCD detector, and three different lasers, working at 532 nm (green), 638 nm (red), and 785 nm (near-IR), respectively. To characterize the chromite crystals, a green 2ω – Nd:YAG laser (532 nm) was used in an attenuated mode (50% laser power), belonging to 5.5 + 0.1 mW on the sample surface. Focusing was completed through a 100 x LWD (long working distance) objective, resulting in a 0.9 μm laser spot-size on the sample surface. The wavelength calibration of the green laser was performed by manual calibration with a pure silicon wafer chip. The main peak intensity was centered interval 520 cm-1 ±1 cm-1. The wavenumber reproducibility was checked several times throughout the analytical runs, providing for a deviation of <0.2 cm-1. Monthly deviation for this set up was in the range of 1 cm-1 before calibration. The hole and slit openings were set to 300 and 100 μm, respectively. A 1800-T grating was used to obtain better spectral resolution. Short counting times (2 x 8 s) were chosen to minimize the heating or oxidation effects of the chromite specimens. The precision for determining the Raman peak positions by this method is estimated to be ±1 to ±1.5 cm-1.
Within a single Raman spectroscopic measurement, the composition of a mineral is not measured directly but can be extracted by Raman peak position shifts (3,14,17). The major Raman peak position of a particular mineral of interest is subjected to systematic and measurable peak shifts in the order of 2–15 cm-1. Such peak shifts can subsequently be used to calculate the cationic ratios through comparison of the minerals chemical composition, typically determined by EPMA. The errors of the Raman system are very low, usually on the order of ±.5 cm-1. Because the Raman system errors are low, it is feasible to use Raman spectra to identify and characterize the peak shift, and to correlate this with mineral chemistry and composition. Thus, we may use this method to help establish a correlation between oxide concentration and Raman peak position (Table I and Figure 3) in minerals such as chromite. Thanks to this tool, future Raman spectroscopic measurements will allow for the rapid determination of chromite chemistry.
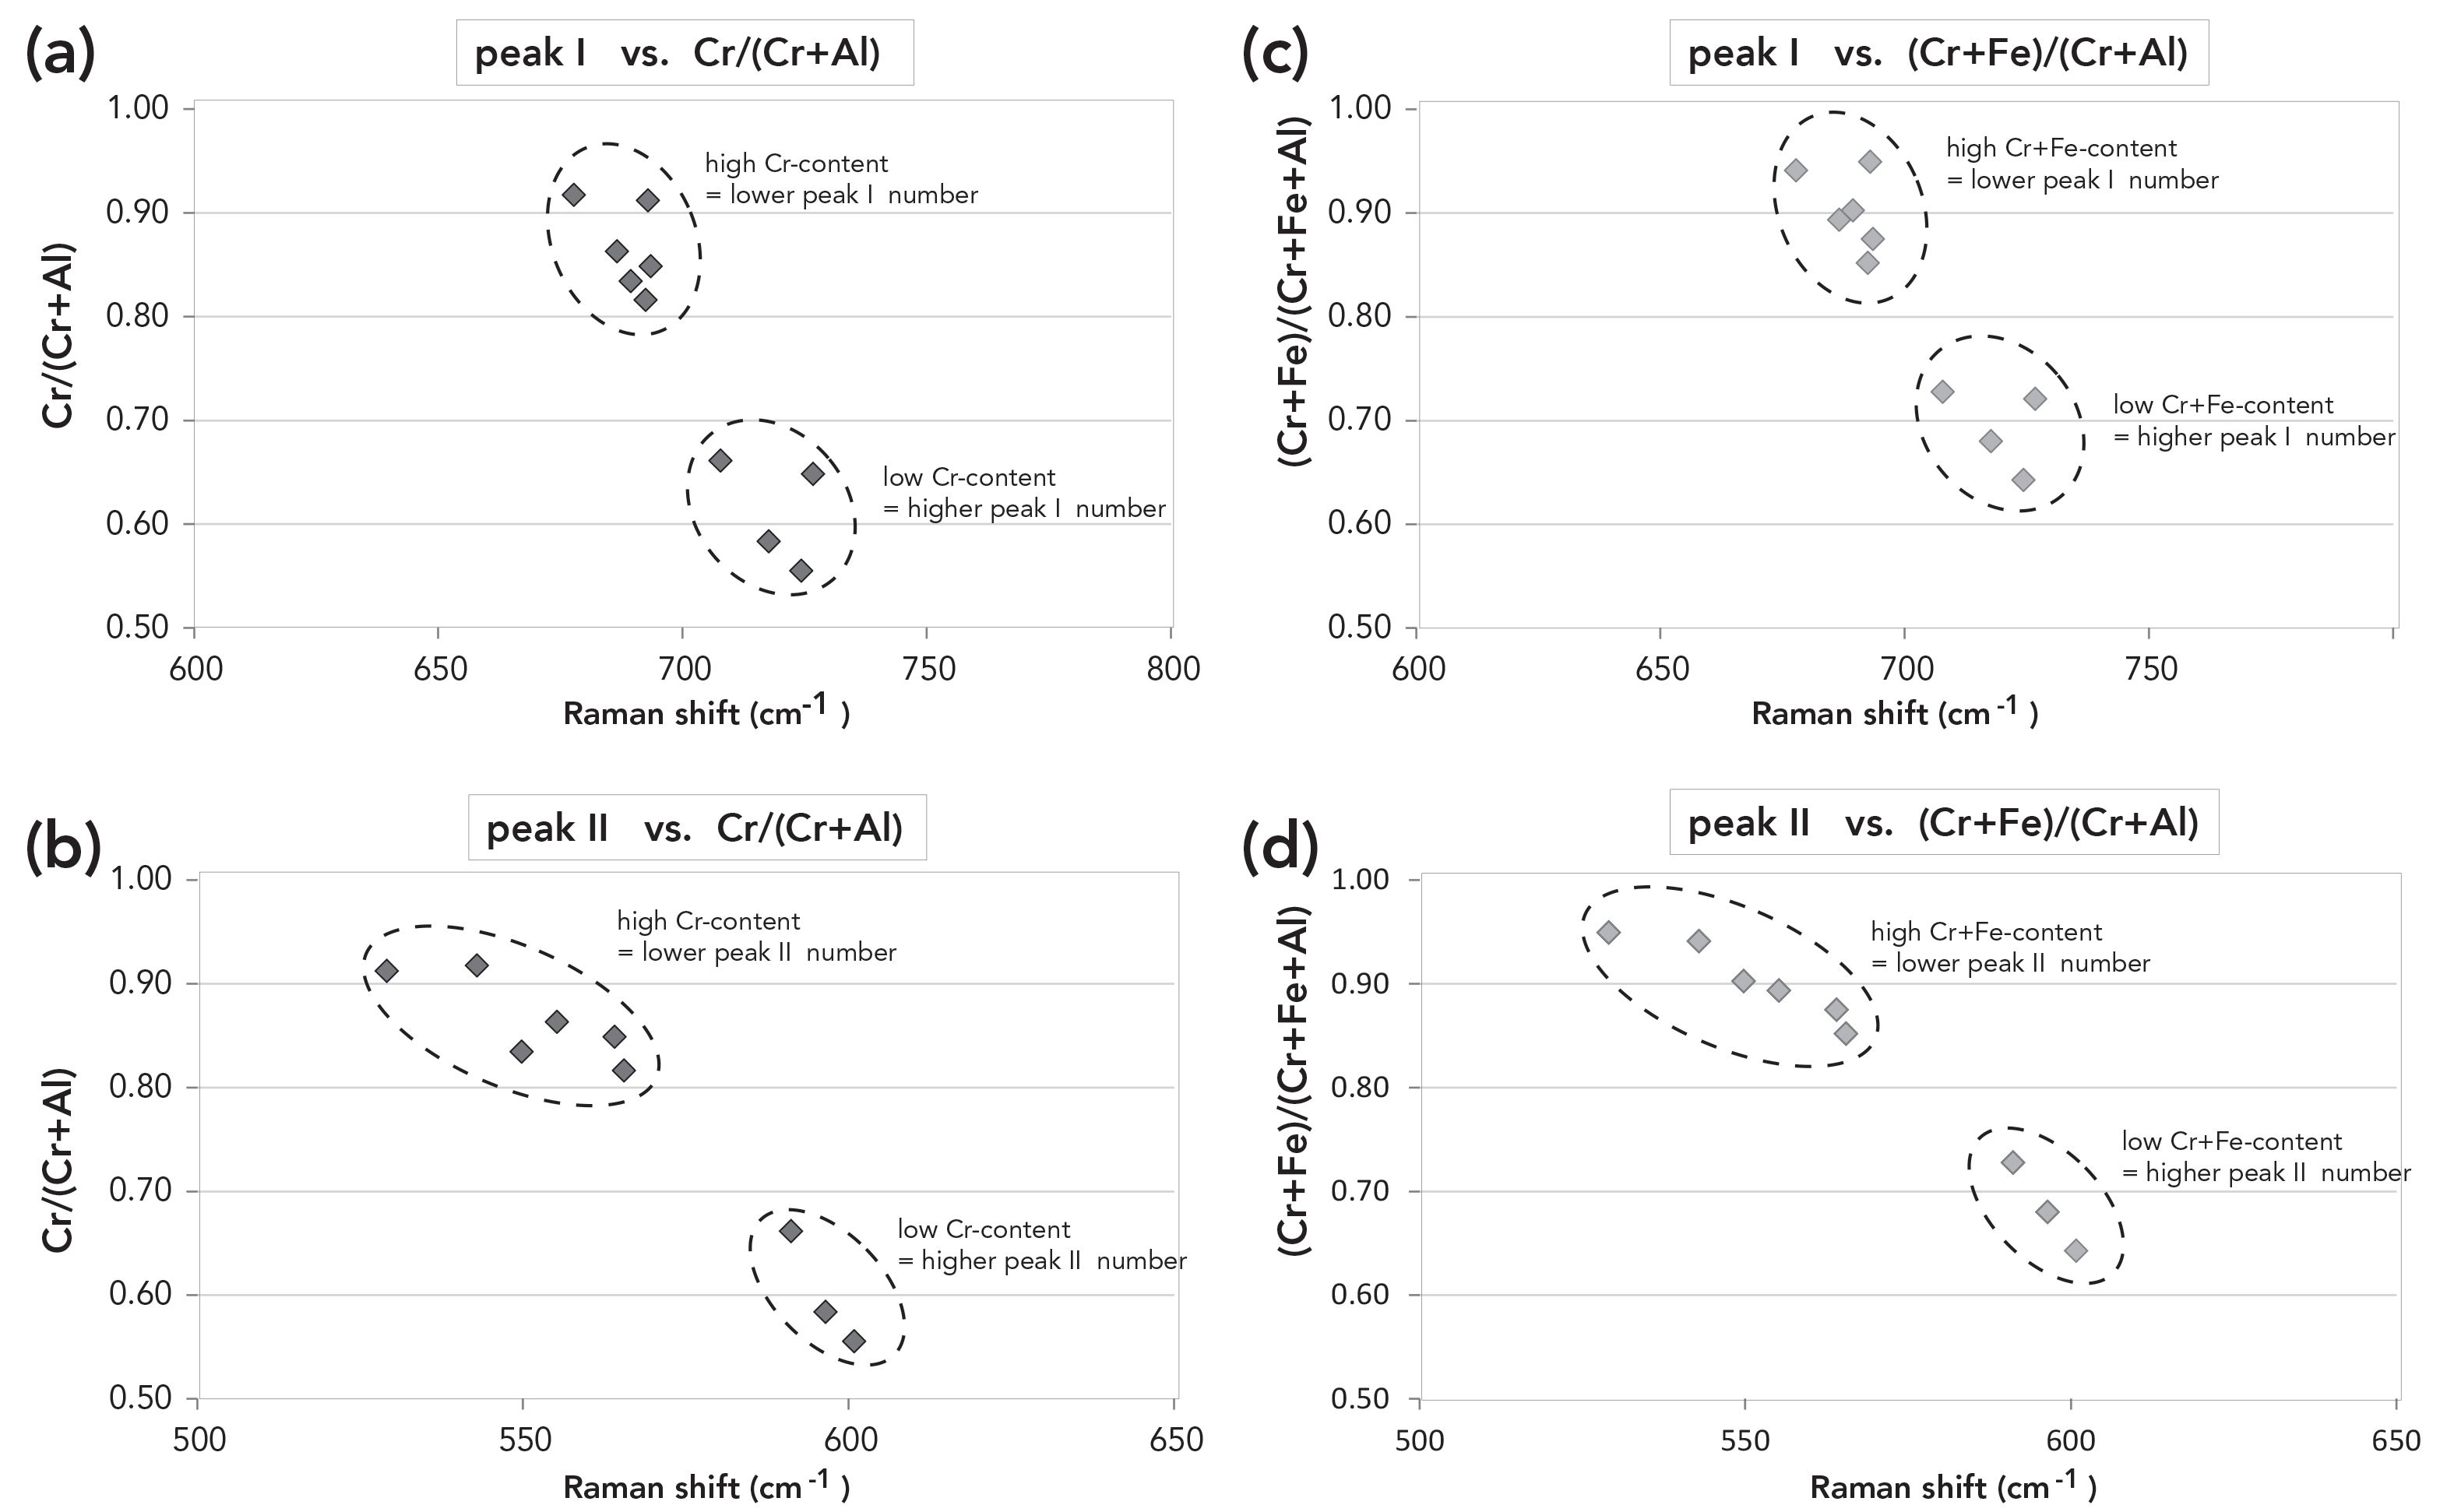
FIGURE 3: Correlation of Raman peak and chromium content of the sample. Figures (a) and (b) show that all chromite mineral samples display a clear negative trend between their chromium aluminum content and the two Raman peak numbers (peak I and peak II). The same negative correlation is obvious for the chromium, aluminum, and iron contents versus the Raman peak number (peak I and peak II), as shown in Figures (c) and (d). It is possible to demonstrate a clear correlation between the chromium content of each mineral and the peak shift of the Raman measurement. The observation is true for both mineral formula calculations, with and without iron.
Sample Material
Ten single chromite grains (100 to 800 μm in size), representative of a range of different chromite paragenesis from various localities (Table I), were separated from their host rocks and embedded in 2.5 cm round epoxy resin holders for EPMA and Raman spectroscopy analytical work.
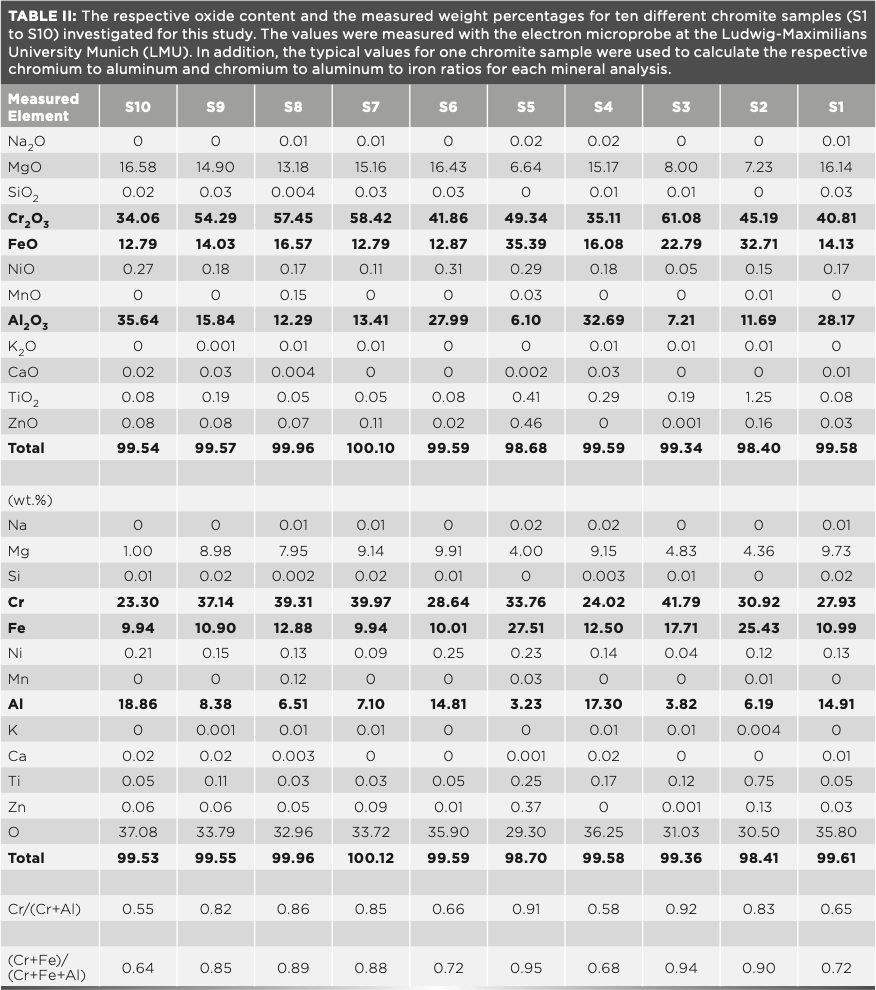
EPMA measurements for each chromite grain were determined on single points and across X–Y traverses, to assess the presence or absence of mineral chemical zoning. No evidence of prominent zoning was observed during the microprobe measurements. Table I shows a sample description and locality, the chromite content, as well as the peak I and peak II wavenumbers. Table II displays mean chemistry for each sample as measured on an oxide and weight percent basis with EPMA (16).
Corresponding Raman measurements were made on the same chromite mineral grains. Care was taken to measure each grain with the same approach (single point measurements and grain traverses) to be able to completely map the composition of the grains and to compare these with the results obtained with the EPMA measurements. Within each of the chromite grains, we did not observe any significant variation in the Raman peak positions, within a deviation error of ±1.5 cm-1 for this method. Furthermore, there was no peak deviation observed between the analysis of the grain core and rim. This result is in agreement with the EPMA measurements. In contrast, we were able to detect a significant change in the peak position (peak I and peak II) of different chromite grains from different localities. Table I lists the two principal Raman peak assignments for each grain. Thereby, each peak number represents the average of at least eight measurements per grain. In our discussion, there was an aim to concentrate on the significance of the stronger peak (peak I).
Results
Raman spectra for each investigated chromite sample are presented in a single plot of Raman shifts versus peak intensity (see Figure 2). The position of peak II ranged from 529 cm-1 to 601 cm-1, and the peak I position ranged from 678 cm-1 to 727 cm-1. Such a large variation in Raman peak shifts suggested a strong coupling between the Raman effect and the mineral chemistry and composition of the various chromites.
Figures 3a and 3b demonstrate a clear negative correlation between the chromium number [Cr/(Cr+Al)] for each sample and the Raman peak shift for both peaks I and II (Table I).
This observation is true when iron is and is not included in the determination of the chromium content (Figure 3) as follows:
(Cr + Fe)/(Cr + Al + Fe) {2}
It is possible to observe the Raman shift in both peak numbers, as they reflect the variable chemical composition of each chromite sample. By extension, these measurements show that it is possible to differentiate and quantify the chromium and aluminum content of a single spinel group mineral (as was the case for chromite) through collection and interpretation of the two main peaks for this mineral group using Raman spectroscopy. Nevertheless, users are encouraged to measure the composition of at least one chromite grain using EMPA to establish a baseline for the application of these Raman shifts.
Such new findings represent an important advancement for the application of Raman spectroscopy, both to the study of spinel mineral species and their compositional variability as well as potentially in the interpretation of other mineral phases using this method. From our observations, it would be sufficient to take only the strongest Raman shift (peak I), because the data relating to mineral compositional variability for peak II yielded similar information. Our measurement campaign has clearly revealed an observable negative correlation between the chromium content and the Raman peak I shift as this relates to the A1g mode in chromite (Figure 3). The minor peak II could be assigned to F2g mode respectively (13).
If the chromium number is low (0.555 to 0.661 cm-1), then peak I will be high (707 to 727 cm-1), as seen in Figure 3. The reverse is true: If the chromium number is high (0.863 to 0.917 cm-1), then the Raman shift peak I will be low (678 to 693 cm-1), as seen in Figure 3. This observation also holds true for the chromium–iron number.
Discussion and Conclusions
Raman spectroscopy has proven to be a quick and powerful method to examine and identify minerals and other materials. Its utility to the study of minerals, especially in planetary sciences, will increase in the near future, particularly if we develop better portable Raman devices.
The investigation of chromite samples from different localities allowed us to infer the chromium content of these phases just through the determination of the Raman shift for peak I. Moreover, it has been possible to demonstrate a negative correlation between the chromium content and the major Raman peak number (peak I) of each sample. By compiling a more comprehensive range of chromite samples demonstrating a full spectrum of mineral compositional variability, it would be possible to calibrate the chromium content of each mineral because of the Raman peak number. Subsequently, it would be enough to measure only the Raman shift (peak I) within a chromite grain of unknown composition to determine the chromium content of this special grain. Therefore, one could potentially replace EPMA analysis of this mineral by Raman spectroscopy, at least in less chemically complex mineral systems. For this reason, Raman spectroscopy has the potential to become an outstanding tool for fieldwork in the future, especially in the remote study of planetary and near-Earth object exploration. The Mineralogical State Collection Munich already houses a large amount of new Raman spectroscopy data on minerals within its collection (numbering ~600 so far), that may provide a comprehensive reference database for those future Raman determinations, be these terrestrial or from the exploration of space. Our goal is to help in the creation of a key database coupled with our own Mineralogical State Collection Raman database (MSC-RD) that could be requested and freely accessed by other scientists.
References
(1) D. Giordano, D. González-García, J.K. Russell, S. Raneri, D. Bersani, L. Fornasini D. di Genova, S. Ferrando, M. Kaliwoda, P. Paolo Lottici, M. Smith, and D.B.A. Dingwell, J. Raman Spectros. 51(9), 1–17 (2019). https://doi.org/10.1002/jrs.5675
(2) S. Rossano and B. Mysen, EMU Notes Mineralog. 12(1), 319–364 (2012). https.//doi: 10.1180/EMU-notes.12.9
(3) K.E. Kuebler, B.L. Jolliff, A. Wang, and L.A. Haskin, Geochim. Cosmochim. Acta 70(24), 6201–6222 (2006).
(4) A. Wang, B.L. Jolliff, and L.A. Haskin, J. of Geophys. Res. 100(10), 21189–21199 (1995).
(5) A. Wang, B.L. Jolliff, and L.A. Haskin, J. of Geophys. Res. 104, 8509–8519 (1999a).
(6) D. Lenaz and V. Lughi, Minerals 40(6), 491–498 (2013).
(7) S.K. Sharma, P.G. Lucey, M. Ghosh, H.W. Hubble, and K.A. Horton, Spectrochim. Acta. 59(10), 2391–2407 (2003).
(8) I. Uysal, F. Zaccarini, M.B. Sadiklar, M. Tarkian, O.A.R. Thalhammer, and G. Garuti, Geologica Acta. 7(3), 351–362 (2009).
(9) I. Uysal, Y. Ersoy, K. Orhan, Y. Dilek, M.B. Sadiklar, C.J. Ottley, M. Tiepolo, and T. Meisel, Lithos 132–133, 50–69 (2012).
(10) S. Saka, I. Uysal, R.M. Akmaz, M. Kaliwoda, and R. Hochleitner, Lithos 202–203, 300–316 (2014).
(11) HIM, Hudson Institute of Mineralogy, “Chromite-Magnesiochromite Series: Mineral information, data and localities”, Mindat.org. (2019)
(12) C. Biagioni and M. Pasero, Am. Mineral. 99(7), 1254–1264 (2014).
(13) B.J. Reddy and R.L. Frost, Spectrochim. Acta Biomol. Spectros. 61(8), 1721–1728 (2005).
(14) A. Wang, K. Kuebler, B. Jolliff, and L.A. Haskin, J. of Raman Spec. 35, 504–514 (2004).
(15) J.M. Malézieux, J. Barbillat, B. Cervelle, J.P. Coutures, M. Couzi, and B. Piriou, Tschermaks min. pet. Mit., 32(2), 171 (1983).
(16) P.J. Pouchou and F. Pichoir, Rech. Aerospat. 3, 13–38 (1984).
(17) D.L.A. de Faria, S.V. Silva, and M.T. de Oliveira, J. of Raman Spec. 28, 873–878 (1997).
Melanie Kaliwoda and Rupert Hochleitner are with Mineralogical State Collection Munich (SNSB) in Munich, Germany. Daniele Giordano is with the Department of Earth Science at the University of Turin in Turin, Italy, the Institute of Geosciences and Geosources (IGG), the National Research Center in Pisa, Italy, and the National Institute of Geophysics and Volcanology Section of Pisa in Pisa, Italy. Miriam E. Krüger is with Centre for Building Materials at the Technical University of Munich in Munich, Germany. Ibrahim Uysal is with the Department of Geological Engineering at Karadeniz Technical University in Trabzon, Turkey. Melih R. Akmaz is with the Department of Geological Engineering at Bülent Ecevit University in Zonguldak, Turkey. Viktor Hoffmann is with the Department of Geosciences at the University of Tübingen in Tübingen, Germany. Wolfgang W. Schmahl is with Department of Geo- and Environmental Sciences at Ludwig Maximilians University in Munich, Germany. Direct correspondence to: Kaliwoda@snsb.de ●
AI-Powered SERS Spectroscopy Breakthrough Boosts Safety of Medicinal Food Products
April 16th 2025A new deep learning-enhanced spectroscopic platform—SERSome—developed by researchers in China and Finland, identifies medicinal and edible homologs (MEHs) with 98% accuracy. This innovation could revolutionize safety and quality control in the growing MEH market.
New Raman Spectroscopy Method Enhances Real-Time Monitoring Across Fermentation Processes
April 15th 2025Researchers at Delft University of Technology have developed a novel method using single compound spectra to enhance the transferability and accuracy of Raman spectroscopy models for real-time fermentation monitoring.
Nanometer-Scale Studies Using Tip Enhanced Raman Spectroscopy
February 8th 2013Volker Deckert, the winner of the 2013 Charles Mann Award, is advancing the use of tip enhanced Raman spectroscopy (TERS) to push the lateral resolution of vibrational spectroscopy well below the Abbe limit, to achieve single-molecule sensitivity. Because the tip can be moved with sub-nanometer precision, structural information with unmatched spatial resolution can be achieved without the need of specific labels.