Trace-Level Detection of Explosives Using Sputtered SERS Substrates
Special Issues
This study explores the use of a novel SERS substrate that can enhance the Raman signals of explosives that are present in picogram quantities in neat solutions using a visible laser wavelength and a compact Raman instrument.
The detection of explosive residues is of crucial interest for security applications such as airport security screenings and terrorist threat assessments. Surface-enhanced Raman spectroscopy (SERS) is a powerful technique that offers high sensitivity and specificity, fast response time, and low limits of detection for various explosives, such as TNT, RDX, and PETN. These explosives can be detected down to picogram levels using a newly developed SERS substrate that consists of a sputtered gold–silver alloy film on a roughened glass surface. This enhancement is achieved with a benchtop integrated Raman instrument using a visible laser excitation at 638 nm, a 20-mW power level, and an acquisition time of only 10 s. Because of the spectral resolution of the Raman technique, the recorded signals allow for both identification of the explosive and quantification of the amount on the substrate. Principal component analysis (PCA) of the Raman spectra successfully showed distinctions among the different explosives. Future experiments will also test the specificity and sensitivity of these SERS substrates for chemical warfare agents, such as sarin or mustard gas.
Safety applications including terrorist threats, improvised explosive devices (IEDs), and landmines emphasize the increasing need for quickly and accurately identifying bulk explosives and their residues. The method of explosives identification must allow for fast acquisition times, produce highly sensitive and reliable results, and at the same time be easy to use and portable for field measurements. Several types of methods have previously been used to detect explosives, including ion mobility and mass spectrometry (MS) (1). Both of these techniques offer a stable and sensitive platform; however, they are limited because of their cost and size as well as the requirement for electrospray ionization with MS (1). Significant research efforts have focused on Raman spectroscopy as a viable tool for explosives detection because it enables a unique spectral signature for the analyte of interest, there is no interference from water, it requires only minor sample preparation, and the instrumentation can be miniaturized for field portability (1,2). However, trace-level (sub-part-per-million) detection of explosives with normal Raman spectroscopy is difficult because of the low Raman scattering cross sections inherent to these compounds (3).
Surface-enhanced Raman spectroscopy (SERS) is a powerful variant of normal Raman spectroscopy that enables trace-level detection of chemicals in solid, liquid, and gaseous samples (2–5). Increased Raman scattering occurs when molecules are adsorbed to metal surfaces and experience an enhanced electric field (5). The two mechanisms that are primarily responsible for the enhancement are an electromagnetic mechanism where there is an amplification of the electric field near the metal surface, and a chemical mechanism where a charge-transfer state is created between the metal and adsorbed molecules (4). The enhanced electric field generated near the metal surface (usually gold or silver) occurs when incident light induces a collective oscillation of electrons in the metal. This phenomenon is known as the surface plasmon resonance and is exhibited by rough metal surfaces and metallic nanoparticles. But SERS introduces a whole new set of challenges, where substrates need to be highly reproducible and achieve large enhancements.
Trace-level detection of explosives using SERS has been previously investigated. Botti and colleagues (6) tested trinitrotoluene (TNT), pentaerythritol tetranitrate (PETN), and trimethylenetrinitramine (RDX) and potassium nitrate (KNO3) with a commercial SERS substrate known as Klarite (D3 Technologies Ltd.), which is based on a lithographically prepared, ordered structure of inverted pyramids coated with a thin layer of gold. They were able to detect these explosives down to tens of picograms and also were able to demonstrate the reproducibility of the results based on the highly ordered substrate pattern. A slightly different approach was carried out by Fierro-Mercado and colleagues (7) where they were able to detect TNT at 94 pg using inkjet-printed gold nanoparticles on filter paper. Another technique using gold nanoparticles was performed by Dasary and colleagues (8) in which the nanoparticles were functionalized with cysteine molecules to preferentially bind to TNT molecules to enhance the SERS signal. A Meisenheimer complex is formed when TNT interacts with the cysteine-bound nanoparticles, and they aggregate with other cysteine-bound nanoparticles to enable detection of TNT at a concentration of 2 pM.
In this study, a novel SERS substrate is presented that is based on sputter deposition of a gold–silver alloy onto a roughened glass surface. These unique substrates enhance the Raman signals of explosives that are present in picogram quantities in neat solutions using a visible laser wavelength (638 nm) and a compact Raman instrument. The gold–silver film allows for adsorption of the explosives and their precursors, and it is sensitive enough to identify species such as PETN and RDX that are often difficult to detect with SERS because of their low Raman scattering cross sections (3). This new technology coupled with portable Raman instrumentation has the ability to detect trace levels of chemicals that play a core role in today’s defense and security efforts. Principal component analysis (PCA) of the data was carried out to support the validity of the current technique. Our results indicate that the SERS technique coupled with a sensitive substrate, compact Raman platform, and chemometrics provides a useful solution for trace-level explosives diagnostics.
Experimental
A 2-in. diameter silver sputtering target was purchased from ACI Alloys, Inc. Ammonium nitrate (NH4NO3), urea, potassium permanganate (KMnO4), sodium chlorate (NaClO3), ethylene glycol dinitrate (EGDN), HMX, gold foil, and roughened borosilicate glass slides were purchased from Sigma-Aldrich. Dilute solutions of TNT, RDX, and PETN were provided by the Defense Science and Technology Laboratory (DSTL) of the United Kingdom. The glass slides were diced to ~4 x 4 mm squares and cleaned before metal deposition by sonicating in separate baths of acetone and isopropyl alcohol. Thin films were then deposited on the precut and precleaned glass slides using a CRC sputter coater with a 300-W DC power supply using pressures ≥ 6 mTorr. A thin film of chromium (~5 nm) was first deposited, followed by a 200-nm film of gold–silver alloy.
All solutions of the explosives or explosive precursors listed above were prepared with concentrations of 100 and 1000 µg/mL. Solutions of PETN, RDX, and TNT were prepared in acetone; NH4NO3, urea, KMnO4, and NaClO3 were prepared in water; HMX and EGDN were prepared in acetonitrile. In a typical measurement, 10 µL of the prepared chemical solution was added to a single gold–silver substrate and allowed to dry in air completely.
The substrates were interrogated with an integrated Raman system (IDRaman reader, Ocean Optics, Inc.) with 638-nm laser excitation. The laser power was typically 19-mW with a 10-s integration time and data were acquired using OceanView software (Ocean Optics, Inc.). The spot size of the focused laser was approximately 25 µm. A typical Raman measurement involved collecting the spectrum of the blank substrate first and subtracting the background peaks to obtain a flat baseline. Then, the spectrum was collected again after the analyte of interest was added, keeping the optics stable. This background subtraction method ensures that only Raman peaks from the analyte of interest appear in the spectrum. The amount of material detected was calculated based on the spot size of the laser, the area of the substrate, and the concentration of the analyte added. For example, 10 µL of 100 ppm analyte deposited on a 16-mm2 substrate using a 25-µm laser spot corresponds to ~30 pg of analyte detected in the laser beam area.
Select SERS spectra were subjected to PCA after visual outliers were manually removed from the dataset. Manual baseline correction was also applied. The Unscrambler X v10.4 (Camo) was implemented to perform PCA on the spectra after a five-point moving average had been applied to smooth the data. A total of 47 spectra were pretreated and ultimately subjected to PCA using the singular value decomposition (SVD) method to visualize natural groupings within the data (9).
Results and Discussion
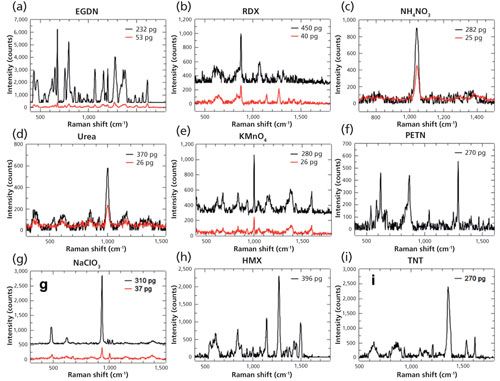
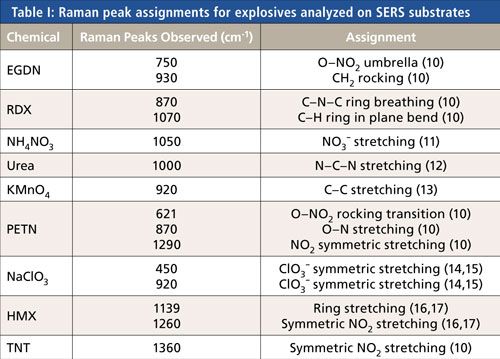
A representative scanning electron microscope (SEM) image of the substrate is shown in Figure 1, which reveals the micro-roughened features of the metallic alloy surface. The SERS spectra of the explosives and explosive precursors analyzed in this study are displayed in Figure 2, and the results are summarized in Table I. The SERS technique coupled with the gold–silver alloy films enables detection of each of these analytes at mass quantities in the hundreds of picograms range. Some of the analytes (EGDN, NH4NO3, RDX, urea, KMnO4, and NaClO3) experienced even greater sensitivities and were detected down to several tens of picograms (~20–50 pg). The difference in the limit of detection for these analytes is most likely because of the differing Raman cross sections inherent to these molecules at 638 nm and their differing adsorption properties to the gold–silver alloy film.
Figure 1: Representative SEM image of gold–silver alloy film. The scale bar is 20 µm.
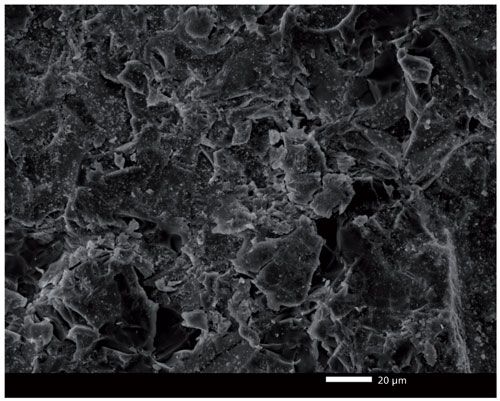
Figure 2: SERS spectra of several explosive chemicals (a) EGDN, (b) RDX, (c) NH4NO3, (d) urea, (e) KMnO4, (f) PETN, (g) NaClO3, (h) HMX, and (i) TNT at different concentrations on the gold-silver SERS substrate using 638-nm excitation, 22-mW laser power, and a 10-s integration time.
Principal Component Analysis
Using the select SERS spectra, an average spectrum was derived for each of the 10 samples subjected to PCA. A graphical overlay of these averages that demonstrate the unique Raman shifts given by each explosive sample can be seen in Figure 3a. PCA was performed on the set of 47 select SERS spectra and results showed that PC1 (principal component), PC2, and PC3 explained 47.5%, 24.8%, and 9.66% of variability in the original dataset, respectively. The first five PCs explained 91.0% of the cumulative variance. Clusters of scores generated by PCA calculations via SVD can be visualized in Figure 3b. Here, a three-dimensional (3D) scatterplot shows the resultant PCA score groupings in relation to each explosive sample group. Some samples cluster close together while others exhibit a wider variability in 3D space. A group of five samples, including KClO3, KMnO4, NaClO3, RDX, and urea, can be seen as overlapping clusters in Figure 3b, while scores from samples of EGDN, HMX, NH4NO3, PETN, and TNT are clearly separated from one another. It is likely that the samples with overlapping scores exhibit similar spectral characteristics that cause them to form clusters very close to each other.
Figure 3: (a) Overlay of 47 select SERS spectra representing EGDN, HMX, KClO3, KMnO4, NaClO3, NH4NO3, PETN, RDX, TNT, and urea. (b) 3D scatterplot of scores generated from PCA of 47 select SERS spectra. (c) Overlay of average spectra represented by overlapping clusters of scores.
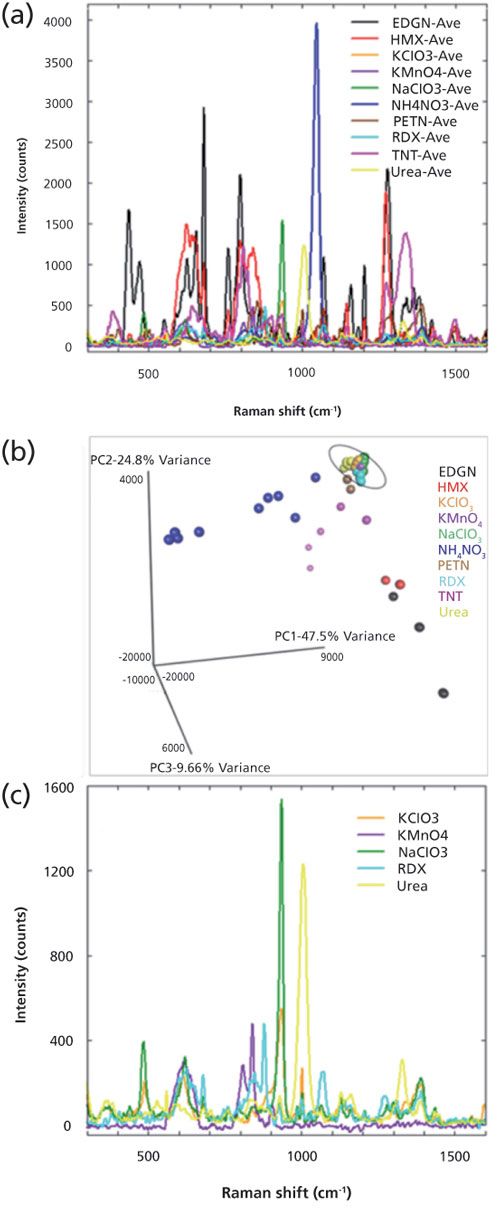
Figure 3c displays the graphical overlay of the average spectra from those samples whose PCA scores are overlapping onto one another. NaClO3 exhibits a distinct Raman peak at ~930 cm-1 and urea exhibits a similarly shaped Raman peak at ~1005 cm-1. Although these two peaks are shifted approximately 75 wavenumbers away from one another, they are similar in shape and general area on the x-axis. These are some of the characteristics that would cause the scores from PCA to cluster close to each other. KMnO4, PETN, and RDX exhibit similar broad Raman shifts between ~600 cm-1 and 700 cm-1 and between ~800 cm-1 and 900 cm-1; these similarities likely contribute to overlapping score clusters.
In general, PCA results show that some of the explosive samples are distinguished from others by visualizing score clusters in 3D space. The scores attributed to those five samples that cluster near each other do so because of similarities in the spectral profile. It is possible that using other types of classification techniques on SERS spectra collected from sputtered SERS substrates will be able to better characterize and identify explosive samples with a high rate of accuracy and precision. Works published by Botti and colleagues (10) and Hwang and colleagues (18) also support the use of PCA for the identification of explosives using SERS spectra. Botti and colleagues (10) analyzed explosive solutions (RDX, TNT, PETN, and EGDN) at a 100 ppm concentration and generated distinct score clusters in two-dimensional (2D) PCA space. Hwang and colleagues (18) report an average classification rate of 99.3% of the 14 explosive compounds used in their study; the authors note that PETN, AN, and HNIW were misclassified as HMX, AND, and RDX in 2% of cases.
Conclusions
Surface-enhanced Raman spectra were reported for explosives and explosive precursors present at picogram levels using a gold–silver alloy film as the SERS substrate. The detection method involved drop-casting the solution containing the explosive onto the substrate and measuring with a benchtop integrated Raman system with 638-nm laser excitation. PCA results show that separation among explosive samples clustered in 3D space will support efforts to characterize and positively predict the identity of unknown explosives encountered in the field. Future experiments will include varying the ratio of gold to silver in the film, and exploring how different roughened features of the film contribute to the SERS response. The results are significant for safety applications requiring rapid identification of explosives.
Acknowledgments
We would like to thank Dr. Laurent Chabanne and the Chemistry Imaging Facility at the University of Bristol in the UK for collecting SEM images of the SERS substrates. We would also like to thank Dr. Neil Shand from DSTL for providing solutions of TNT, RDX, and PETN.
References
- E. Finot, T. Brulé, P. Rai, A. Griffart, A. Bouhélier, and T. Thundat, Proc. SPIE.8725, 872528 (2013).
- G. McNay, D. Eustace, W.E. Smith, K. Faulds, and D. Graham, Appl. Spectrosc. 65, 825–837 (2011).
- A.W. Fountain III, S.D. Christesen, R.P. Moon, J.A. Guicheteau, and E.D. Emmons, Appl. Spectrosc. 68, 795–811 (2014).
- P.H.B. Aoki, L.N. Furini, P. Alessio, A.E. Aliaga, and C.J.L. Constantino, Rev. Anal. Chem.32, 55–76 (2013).
- B. Sharma, M. Fernanda Cardinal, S.L. Kleinman, N.G. Greeneltch, R.R. Frontiera, M.G. Blaber, G.C. Schatz, and R.P. Van Duyne, MRS Bulletin38, 615–624 (2013).
- S. Botti, L. Cantarini, S. Almaviva, A. Puiu, and A. Rufoloni, Chem. Phys. Lett. 592, 277–281 (2014).
- P.M. Fierro-Mercado and S.P. Hernández-Rivera, Int. J. Spectrosc. 716527, 1–7 (2012).
- S.S.R. Dasary, A.K. Singh, D. Senapati, H. Yu, and P.C. Ray, J. Am. Chem. Soc. 131, 13806–13812 (2009).
- K. Varmuza and P. Filzmoser, in Introduction to Multivariate Statistical Analysis in Chemometrics (CRC Press Taylor & Francis Group, Boca Raton, Florida, 2009).
- S. Botti, S. Almaviva, L. Cantarini, A. Palucci, A. Puiu, and A. Rufoloni, J. Raman Spectrosc.44, 463–468 (2013).
- M.E. Farrell, E.L. Holthoff, and P.M. Pellegrino, Appl. Spectrosc. 68, 287–296 (2014).
- Y. Sun, Master of Science thesis, University of Iowa, 2013.
- T.J. Johnson, Y-F. Su, K.H. Jarman, B.M. Kunkel, J.C. Birnbaum, A.G. Joly, E.G. Stephan, R.G. Tonkyn, R.G. Ewing, and G.C. Dunham, Inter. J. Spectrosc. 291056, 1–11 (2012).
- J.L. Hollenberg and D.A. Dows, Spectrochim. Acta16, 1155–1164 (1960).
- B. Zachhuber, G. Ramer, A. Hobro, E.T.H. Chrysostom, and B. Lendl, Anal. Bioanal. Chem. 400, 2439–2447 (2011).
- D.D. Tuschel, A.V. Mikhonin, B.E. Lemoff, and S.A. Asher, Appl. Spectrosc. 64, 425–432 (2010).
- S.K. Sharma, A.K. Misra, and B. Sharma, Spectrochim. Acta Mol. Biomol. Spectrosc. 61, 2404–2412 (2005).
- J. Hwang, N. Choi, A. Park, J-Q. Park, J.H. Chung, S. Baek, S.G. Cho, S-J. Baek, and J. Choo, J. Mol. Struct. 1039, 130–136 (2013).
Anne-Marie Dowgiallo and Derek Guenther are with Ocean Optics, Inc., in Dunedin, Florida. Alejandra Branham is Ocean Optics, Inc., in Winter Park, Florida. Direct correspondence to: anne-marie.dowgiallo@oceanoptics.com

AI-Powered SERS Spectroscopy Breakthrough Boosts Safety of Medicinal Food Products
April 16th 2025A new deep learning-enhanced spectroscopic platform—SERSome—developed by researchers in China and Finland, identifies medicinal and edible homologs (MEHs) with 98% accuracy. This innovation could revolutionize safety and quality control in the growing MEH market.
New Raman Spectroscopy Method Enhances Real-Time Monitoring Across Fermentation Processes
April 15th 2025Researchers at Delft University of Technology have developed a novel method using single compound spectra to enhance the transferability and accuracy of Raman spectroscopy models for real-time fermentation monitoring.
Nanometer-Scale Studies Using Tip Enhanced Raman Spectroscopy
February 8th 2013Volker Deckert, the winner of the 2013 Charles Mann Award, is advancing the use of tip enhanced Raman spectroscopy (TERS) to push the lateral resolution of vibrational spectroscopy well below the Abbe limit, to achieve single-molecule sensitivity. Because the tip can be moved with sub-nanometer precision, structural information with unmatched spatial resolution can be achieved without the need of specific labels.