Trends in X-ray Techniques
Spectroscopy
Several leading scientists describe their recent work to advance X-ray analysis techniques.
Nutrient Management Planning with Portable X-ray Fluorescence (pXRF)
Yadav Sapkota, B. Lee Drake, Louis M. McDonald, Thomas C. Griggs, and Thomas J. Basden
Water quality around the world is impaired by nutrients. Excess phosphorus (P) and nitrogen (N) in surface water is one cause of eutrophication and toxic algal blooms. Much of this P and N comes from agricultural operations, especially when animals are concentrated in one location, including concentrated animal feeding operations (CAFO), as defined by the United States Department of Agriculture (USDA). A nutrient management plan (NMP) is a whole-farm planning tool to identify and manage nutrient inputs and outputs, and within-farm transfers-essentially a nutrient mass balance.
An NMP that accounts for P inputs, outputs, and transfers within a farm can help to minimize P losses to the environment, and improve farm profitability. The traditional approach to data collection for an NMP is to collect soil, plant (forage, grain, and supplements), and manure samples for analysis in a commercial analytical laboratory. In addition to being slow (up to three weeks to receive data) and expensive, this process makes it difficult to account for the spatial and temporal changes in P concentrations. Here, we report our initial efforts to develop portable X-ray fluorescence (pXRF) methods to determine P in heterogeneous forage samples and manure to facilitate the nutrient management planning process.
We assumed that the limiting factor for pXRF determination of P in forage would be its heterogeneous sample composition. Forage, either grazed or made into hay, is a mixture of plant species (grasses, legumes, and other weeds), plant parts, and dimensions (stems, leaves, and seeds), all of which could influence pXRF results. We assumed the limiting factor for pXRF determination of P in manure would be sample water content, because it is well known that water attenuates X-rays.
Materials and Methods
We collected hay samples (n = 42) from local farms. Samples were oven dried (60 °C for 3 d), and ground into three particle sizes (≤0.5 mm, 0.25 to 0.5 mm, and 1 to 2 mm). Prepared samples were scanned by pXRF (Tracer III-SD; SN T3S2102; Bruker Elemental, Kennewick, Washington), equipped with a 4W rhodium tube and a Peltier-cooled, 10 mm2 silicon drift detector, using a vacuum (<10 torr) without a filter. Per the calibration method, samples of each size fraction were placed in cups over 0.4 µm prolene X-ray film and scanned for 180 s using the portable XRF instrument (Tracer III-SD; SN T3S2102; Bruker Elemental, Kennewick, Washington) in benchtop mode, equipped with a 4W rhodium tube, and a Peltier-cooled, 10 mm2 silicon drift detector, with a voltage of 15 KeV and anode current of 26 uA without a filter. A subset (n = 29) was also scanned for 60 and 120 s. The resulting pXFR counts were compared to traditional wet-chemical digestions with inductively coupled plasma optical emission spectrometry (ICP-OES) determinations. Specifically, subsamples were further ground to pass a 2 mm screen, acid-digested in triplicate by microwave (MARS Xpress, CEM Inc., Matthews, North Carolina) and the elemental concentration was determined using ICP-OES (Optima DV 2100, Perkin Elmer, Norwalk, Connecticut) with a NIST Certified Reference Material (CRM) 1573a-tomato leaf. The pXRF counts for P were compared to ICP-OES determinations using regression models. Oven dried beef, dairy, and poultry manure samples (n = 40) were ground and adjusted to the additional four moisture ranges (w/w moisture): 10–20%, 20–30%, 40–50%, and 60–70%. Samples were scanned by pXRF for 180 s using a vacuum (<10 torr) and without a filter as described above. Wet chemical determinations were also performed as described above, and pXRF counts for P were compared to ICP-OES determinations using regression models.
Additionally, we used the entire spectrum to develop calibration models using random forest regression instead of using photon counts (intensity) of individual elements to predict P concentrations (Figure 2), and to predict and correct for sample moisture concentration (Figure 3). The entire XRF spectrum not only contains information on the energy level and photon counts, but also the record of the detector channel counts. The use of multivariate regression techniques, like random forest regression, uses the individual channel counts as independent variables to predict elemental concentration (2). Random forest regression is an ensemble computational method that creates pseudorandomized subsets of the data (decision trees), which can be used to assign weights to variables (3). By applying this to the detector channel counts, it is possible to identify variables that influence a given dependent variable with reduced covariance effects (4). The approach used here employs the randomForest package in R (4.6–14) using regression trees (5,6). Random forests have been used in infrared spectrometry using the same framework (7). The approach outlined here uses individual channel counts as variables, rather than specific elemental lines (2). It identifies the X-ray energies associated with any independent variable. The silicon-drift detector of pXRF used for this research has 2048 channels to record energies from 1 to 40 KeV.
Results and Discussion
The amount of P in heterogeneous forage samples could be determined with pXRF (r2 = 0.93; Figure 1). Relationship strength increased with decreasing particle size; however, the relationship was still strong (r2 ≥ 0.57) at the largest particle size. Scanning time did not affect the relationship with ICP concentration for any of the particle sizes evaluated (1).
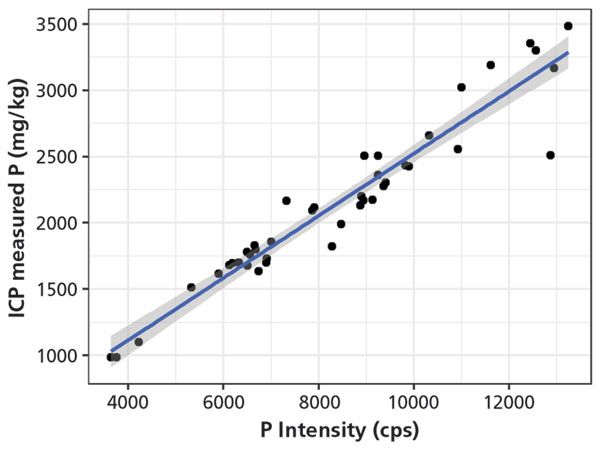
Figure 1: Regression plot (p < 0.001) for ICP and pXRF determined P for the ≤0.5-mm samples. The shaded portion represents the standard error of the regression line.
For P in manure, dried and ground samples produced a stronger relationship with wet chemical techniques (r2 = 0.98; Figure 2). The presence of moisture negatively affected elemental determination in manure samples. Calibrations (n = 200) were prepared using random forest regression with detector channel counts as independent variables. The back end of the spectrum (14–15 keV) had strong predictive power (r2 = 0.98) for moisture content (Figure 3). The random forest approach increased r2 between pXRF and wet-chemical methods from less than 0.66 to greater than 0.96 for P compared to linear, non-linear, and Lucas-Tooth equations. These results indicated that elemental concentration can accurately be measured in dried and moist manure samples using pXRF, and expands the potential applications of pXRF to in situ elemental determinations for agricultural and environmental samples.
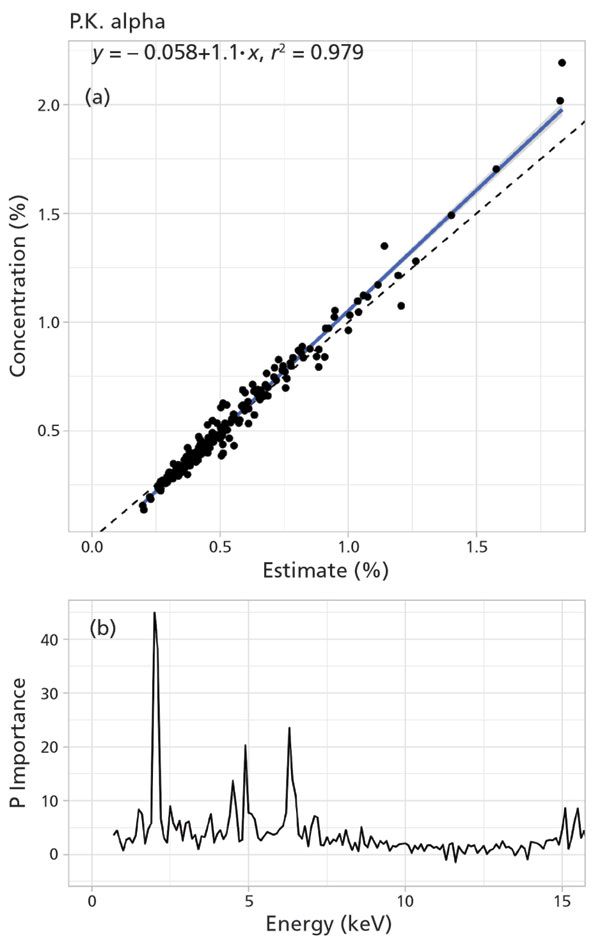
Figure 2: Predicted phosphorus (P) concentration using random forest regression. (a) Validation of the predicted P concentration (estimated %) with the ICP measured P concentration (concentration %) of the sample. There was strong relationship (r2 = 0.98) between estimated and actual P concentration in the sample. (b) Importance plot showing the region of the spectrum for P prediction including the influential energy levels.
Although additional work is needed to extend this to in situ field analysis, specifically the pXRF determination of whole forage plants, this simplification of the elemental analytical method could expedite NMP planning, contributing to better whole-farm P management and improved surface water quality.
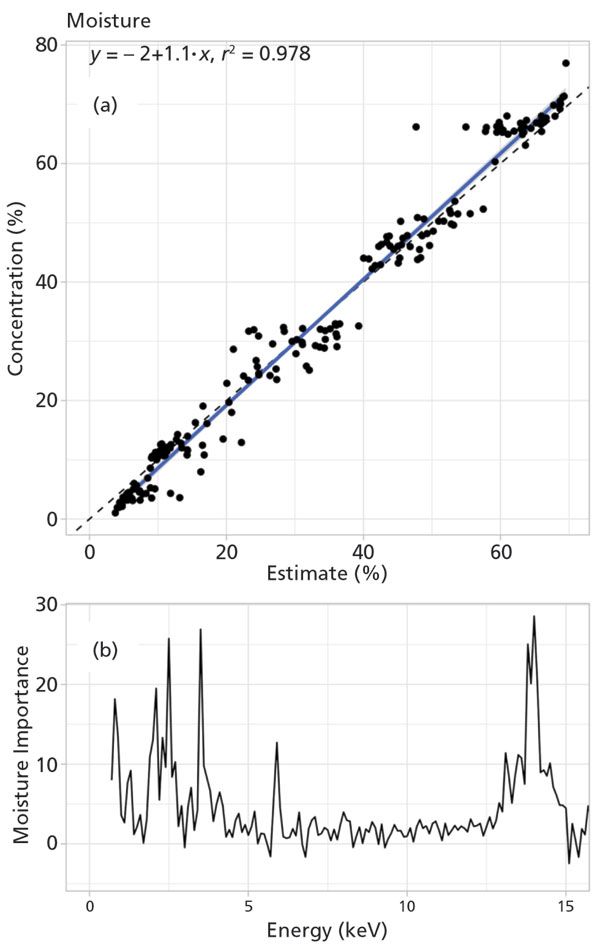
Figure 3: Moisture content prediction using random forest regression. (a) Validation of the predicted moisture content (estimated %) from random forest regression with the actual moisture content (concentration %) in the sample. There was strong relationship (r2 = 0.98) between estimated and actual moisture concentration in the sample. (b) Importance plot showing the region of the spectrum for moisture prediction. The moisture was predicted with better strength (r2 = 0.98) at the back end of the spectrum (14-15 KeV), with some influences from front end of the spectrum (2-4 KeV).
References
(1) Y. Sapkota, L.M. McDonald, T.C. Griggs, T. Basden, and B.L. Drake. Plant Nutrition doi.org/10.3389/fpls.2019.00317 (2019).
(2) B. Drake, CloudCal v3.0. GitHub (2019). doi:10.5281/zenodo.2596154.
(3) K. Ho, IEEE Trans. Pattern Anal. Mach. Intell. 20, 832–844 (1998).
(4) E. Kleingberg, Ann. Math. Artif. Intell. 1, 207–239 (1990).
(5) L. Breiman, Mach. Learn. 45, 5–32 (2001).
(6) A. Liaw, and M. Wiener, R News 2/3, 18–22 (2002).
(7) J.B. Ghasemi, and H. Tavakoli, Anal. Methods 5, 1863–1871 (2013).
Yadav Saptoka is with the Division of Plant and Soil Sciences at West Virginia University, in Morgantown, West Virginia, and the Wetland and Aquatic Biogeochemistry Laboratory of the College of Coast and Environment at Louisiana State University, in Baton Rouge, Louisiana. Louis M. McDonald and Thomas C. Griggs are with the Division of Plant and Soil Sciences at West Virginia University, in Morgantown, West Virginia. B. Lee Drake is with the Department of Anthrolpology at the University of New Mexico, in Albuquerque, New Mexico. Thomas J. Basden is with the Extension service of West Virginia University, in Morgantown, West Virginia. Direct correspondence to: LMMcDonald@mail.wvu.edu.
Total Reflection Energy Dispersive X-ray Fluorescence for Analysis of Human Samples: from Cells to Tissues
Ana Pejovic´-Milic´ and Gabriella Mankovskii
Trace metals play a crucial role in the human body and health. Measuring the accumulation of these metals in human cells and tissues is important for diagnosis and treatment of many diseases, as well as for measuring environmental, occupational, and medical exposures. For example, environmental exposure of children to lead is associated with intellectual deficiency (1), while exposure to aluminum (2) and manganese (3) in the workplace highlights the need to analyze human samples to regulate occupational exposures and improve occupational hygiene. Furthermore, modern ophthalmology is exploring novel ideas on the effects of metals on eye health-namely, the link between neonatal cataracts and lead exposure during pregnancy, and the use of cosmetics, potentially leading to the accumulation of metals in the eye, and larger lacrimal sac stones in women.
Due to their unique and customizable optical and physical properties, nanoparticles have undergone a revolution in terms of their applications in medicine. Modern personalized nanomedicine opens up a further need to measure cells' accumulation of metals delivered in the form of nanoparticles that have been developed to aid in imaging (4), therapy (5), and theranostic applications (6). Among these nanoparticles, gold nanoparticles are the most widely used, owing to their ability to act as dose enhancers and drug carriers in cancer therapy. Other nanoparticles that are currently being explored are silver (7), platinum (8), and iron (9), further opening up the need for their quantification to understand and investigate factors that affect their cellular uptake and transport.
Currently, inductively coupled plasma (ICP) spectrometry is the most commonly used technique to measure metals in human ex vivo cells and tissues. However, ICP has several drawbacks, including, but not limited to, complex sample preparation procedures (use of strong acids for digestion of samples), the need for exact weights and dilution volumes, sample destruction, daily calibration, careful matrix matching between the sample and calibrator, potential carry-over between samples, and the need for skilled operators.
Total reflection X-ray fluorescence analysis (TXRF) is an advanced energy-dispersive X-ray analytical technique to measure down to the trace element range. The development of benchtop TXRF spectrometers in the last decade presented this powerful technique as an ideal analytical instrument that is comparable, if not superior, to ICP spectrometers for use in medicine. Besides the simplicity of sample preparation, TXRF requires a very small amount of sample, which is typically the situation in medicine; only a few micrograms or microliters are required for the analysis. The low detection limits are attainable with careful sample preparation to achieve the conditions of total reflection. The matrix matching between the sample and calibrator is eliminated, due to the use of internal calibration. A rapid analysis time of a few seconds and simultaneous detection of many elements are additional advantages of this technique. Analytical power is an important requirement of modern medicine, while the detection of many elements (from boron to uranium) in one measurement opens up new insights on the multi-elemental effects of toxic metals on human health, a new area of research significantly underdeveloped at present. More information about TXRF is available in the literature (10,11).
While the benchtop TXRF offers many advantages for use in medicine, it also requires proper method development and validation before it can be used routinely. This paper provides an overview of the main factors to consider when developing TXRF quantification methods for human samples based on experience from our laboratory, namely sample preparation, validation of measurements, selection of an internal standard, and spectral fitting.
Figure 1 shows an example of variability in the measured concentrations of some elements observed in human cerebrospinal fluid (CSF). For instance, sodium and chlorine were lost from the sample as volatile compounds when dissolving CSF in nitric acid (1:1; method 3), highlighting the influence of sample preparation on measured concentrations. Therefore, any new sample preparation method warrants the need to use standard material for validation. Unfortunately, standard materials for human fluids and tissue are not always readily available. In such cases, the developed method should be cross-validated with another analytical technique, such as ICP.
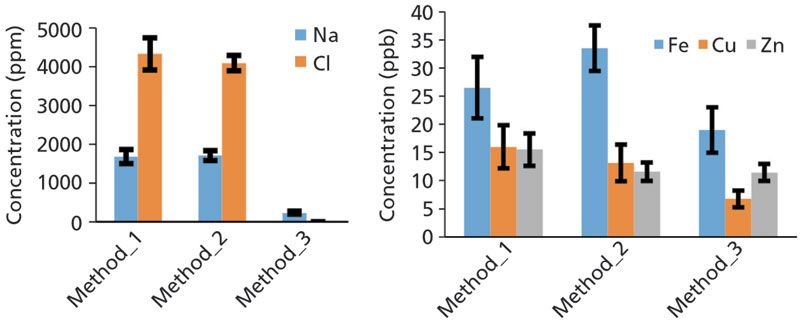
Figure 1: Quantification of human cerebrospinal fluid (CSF) using three preparation methods: 1) 60 µL of CSF dried at 80 °C and measured for 1500 s; 2) 60 µL of CSF diluted in 60 µL water, dried at 80 °C, and measured for 1500 s; 3) 60 µL of CSF dissolved in 60 µL HNO3, dried at 80 °C and measured for 1500 s. Quantification of 5-µL solutions was performed with 1 ppm of yttrium as an internal standard. Measurements were done on S2 PicoFox Spectrometer (Bruker, AXS) with Mo excitation at 17.5 keV using siliconized quartz sample carriers.
Our laboratory has previously cross-validated newly developed TXRF method with inductively coupled plasma atomic emission spectroscopy (ICP-AES) for quantification of gold nanoparticles accumulated in cancer cells. The starting assumption of cross-validation was that quantification based on ICP-AES is a "standard" analytical method, due to its wide use in the medical community (12–15). However, using a NIST gold nanoparticle standard, we observed the recovery rates of 94.6±3.4% and 44.8±2.4% with TXRF and ICP-AES spectrometers, respectively (Figure 2). This outcome suggested TXRF as a superior quantification method, and pointed out that the widely utilized ICP method for gold nanoparticle quantification was not properly developed and validated, even though in use for many decades.
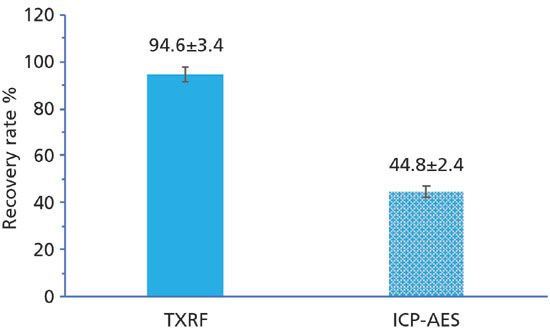
Figure 2: Comparison of TXRF and ICP-AES recovery rates of 10 nm NIST gold nanoparticles in MDA-MB-231 breast cancer cells.
Another critical point for accurate absolute quantification with TXRF is selection of an internal standard. An ideal internal standard is an element that is not originally present in the sample; it should not create any peak overlaps with the elements of interest, and should undergo the same electron transitions as the elements under investigation. In the case of quantification of low Z elements detection using K X-ray energies, the typical internal standard recommended by the vendor is yttrium, while we recommend the use of lanthanum and gadolinium for medium and high Z element quantifications in human samples. Moving to the spectral analysis, which is crucial due to the chemical complexity of human fluid and tissues, Figure 3 illustrates the comparison of different fitting routines for a gold-certified standard solution measured with 1 ppm of lanthanum as an internal standard. Built-in fitting routines that are supplied with the spectrometer resulted in decreased accuracy in the quantification of gold, while external ones showed nearly 100% accuracy. Therefore, the authors encourage users to explore fitting software that is suitable for their specific analyte and sample requirements.
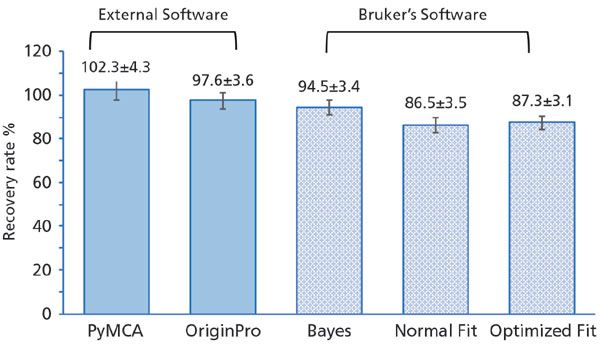
Figure 3: Comparison of external software (PyMCA and OriginPro) with Bruker's fitting software using 1 ppm certified gold solution and 1 ppm certified lanthanum solution as an internal standard.
The simplicity of sample preparation combined with low limits of detection makes TXRF an attractive tool to quantify elements in ex vivo human fluid and tissues. As with any other technique, quantification methods for new samples need to be carefully developed and validated. This becomes especially important because inaccurate measurements have far-reaching consequences to human health, since they can lead to misdiagnosis or overdosing.
Acknowledgment
The authors are grateful to Dr. Zekeriyya Bahadir for sharing the results on ongoing work shown in Figure 1.
References
(1) B.P. Lanphear, R. Hornung, J. Khory, K. Yolton, P. Baghurst, D.C. Bellinger, R.L. Canfield, K.N. Dietrich, R. Bornschein, T. Greene, S.J. Rothenberg, H.L. Needleman, L. Schnaas, G. Wasserman, J. Graziano, and R. Roberts, Environ. Health Perspect. 113(7), 894–899 (2005).
(2) V. Riihimäki and A. Aitio, Crit. Rev. Toxicol. 42(10), 827–853, (2012).
(3) M.J. Leonhard, E.T. Chang, A.E. Loccisano, and M.R. Garry, Toxicology, 420, 46–65 (2019).
(4) X. Huang, I.H. El-Sayed, W. Qian, and M.A. El-Sayed, J. Am. Chem. Soc., 128(6), 2115–2120 (2006).
(5) J.F. Hainfeld, D.N. Slatkin, and H.M. Smilowitz, Phys. Med. Biol. 49(18), N309–N315 (2004).
(6) P. Rai, S. Mallidi, X. Zheng, R. Rahmanzadeh, Y. Mir, S. Elrington, A. Khurshid, and T. Hasan, Adv. Drug Deliv. Rev. 62(11), 1094–1124 (2010).
(7) J.R. Morones, J.L. Elechiguerra, A. Camacho, K. Holt, J.B. Kouri, J.T. Ramirez, and M.J. Yacaman, Nanotechnology 16(10), 2346–2353, (2005).
(8) E. Porcel, S. Liehn, H. Remita, N. Usami, K. Kobayashi, Y. Furusawa, C. Le Sech, and S. Lacombe, Nanotechnology, 21(8), 85103 (2010).
(9) B.T. Farrell, B.E. Hamilton, E. Dósa, E. Rimely, M. Nasseri, S. Gahramanov, C.A. Lacy, E.P. Frenkel, N.D. Doolittle, P.M. Jacobs, and E.A. Neuwelt, Neurology 81(3), 256–263 (2013).
(10) P. Wobrauschek, X-Ray Spectrom. 36(5), 289–300 (2007).
(11) M. West, A. T. Ellis, C. Streli, C. Vanhoof, and P. Wobrauschek, J. Anal. Atom. Spectrom., 32(9), 1629–1649 (2017).
(12) L.C. Kennedy, A.S. Bear, J.K. Young, N.A. Lewinski, J. Kim, A.E. Foster, and R.A. Drezek, Nanoscale Res. Lett. 6(1), 283 (2011).
(13) P. C. Naha, P. Chhour, and D. P. Cormode, Toxicol. Vitro Int. J. 29(7), 1445–1453 (2015).
(14) B. D. Chithrani, A. A. Ghazani, and W. C. W. Chan, Nano Lett. 6(4), 662–668 (2006).
(15) A. Albanese, K. M. Tsoi, and W. C. W. Chan, J. Lab. Autom. 18(1), 99–104 (2013).
Ana PejoviÄ -MiliÄ and Gabriella Mankovsk are with the Department of Physics at Ryerson University in Toronto, Ontario, Canada. Direct correspondence to: anamilic@ryerson.ca.
Peering into the Metal Architecture of Cryofrozen Cells with Unprecedented X-ray Brilliance
Björn De Samber
Instrumental developments in X-ray imaging and spectroscopy continue to step forward rapidly. At third-generation synchrotron facilities, several nanoprobe beamlines have arisen, providing X-ray nanobeams with unprecedented flux of up to 1012 photons per second, all concentrated within a focal spot of only a mere 50 nm. Both the size of the X-ray beam and its flux are vital cornerstones for enabling trace level metal imaging within single cells. With the spatial resolving power now available, a new milestone is being achieved: chemical imaging of trace metals in single cell organelles, such as mitochondria, lysosomes, and endoplasmatic reticulum (ER).
Why Imaging Metals in Cells Matter
One might wonder why imaging of metals in the cell is of such great importance. Throughout the evolution of life on earth, metals such as iron (Fe), copper (Cu), zinc (Zn), nickel (Ni), and cobalt (Co) were naturally present, and formed critical ingredients for the recipe of life on earth (1). The unique electronic structure of metals is used in one third of all known proteins, enabling their stable folding, creation of reactive centers, or even signaling (2). The role metals played throughout the history of life on earth was also far from static: During the so-called "great oxygenation event" 2.45 billion years ago (3), our atmosphere changed from an oxygen-poor to an oxygen-rich environment, transforming fairly insoluble metal sulfides-hard to harvest for life-into water-soluble sulfates, accelerating the incorporation of newly available metals such as iron and zinc. Iron-containing hemoglobin, zinc-finger containing proteins, and cobalt containing vitamin B12 are only a few examples of metal-containing biological molecules now essential for life.
One of the pivotal aspects to enable X-ray metal imaging of single cells is to reduce sample radiation damage and keep all metal ions in a (spatially) fixed position during the X-ray scanning process. The largely uncompromising approach to achieve this is to cryogenically freeze the cells into their so-called "vitreous" glassy state, which is very close to their real-life state. At a handful of nanoprobe beamlines worldwide, an admirable effort is being made to embed cryogenic sample environments into the nanoprobe vacuum, maintaining an uninterrupted cryogenic workflow. Cryogenic sample preparation, however, does not remove all doubts: Necessary removal of the cell medium by "washing" and so-called "blotting" of the cell monolayer (removing the excess of water covering the cell) both remain crucial steps before cryofixation that can influence the cell's metal chemistry. All in all, cryogenic sample preparation needs to be effected with some flair (untrained staff give better priority to an automated blotting device, while the hand of a lifelong expert can surpass the instrument in terms of accuracy).
Current Challenges
The current challenges for synchrotron radiation–based nanochemical imaging are still numerous. Life science and X-ray science are quite different fields, and researchers from these two disciplines almost speak different languages. Moreover, cell biologists pose very specific wishes that can be particularly challenging for the analytical X-ray scientist: statistical analysis on large numbers of cells, comparison of cells cultured under different conditions or at different exposure times, imaging of one specific biological event or feature, quantitative comparison of specific cell regions, and so forth. Given that cryogenically frozen cells are mainly composed of ice, quantification algorithms are also required that compensate for self-absorption effects in such a matrix. Biologists should, therefore, ideally receive specialized support to valorize their synchrotron nanoprobe experiments. This support should be all-embracing: writing a technically sound proposal, preparation of cryofrozen samples compatible with the X-ray nanoprobe used, shipping of (potentially hazardous) cryocooled biological samples to the synchrotron, setting up the nanoprobe experiment, performing the scans, and data processing after the experiment. Beamline scientists can only provide partial support because of limited staff and time. Ideally, nano-analytical scientists can provide expertise in sample preparation before, guidance during, and data analysis after the synchrotron experiment. Because synchrotron radiation-based metal imaging is still uncharted territory in many fields of life science, results are often "a first," and interpreting should be done with great care. Thorough interaction between the nano-analytical and life scientist can as such open the doorway to fascinating new multidisciplinary science.
Future Prospects
In terms of future prospects, the future is bright. New, fourth-generation synchrotrons are being developed worldwide that provide increased brilliance, coherence, and source symmetry. A few examples of facilities are the new PETRAIV storage ring in Germany, MAXIV in Sweden, the APS upgrade in the United States, and the ESRF-EBS upgrade in France. These upgrades will enable even brighter, smaller, and symmetrical nanobeams, providing metal imaging of single cells in only a few minutes, instead of hours currently. When accepting the same hourly time scale per single cell, elemental maps of more "exotic" ultratrace elements, such as copper, nickel, and cobalt, will become available. A powerful development is the combination of elemental with morphological nano-imaging. X-ray phase contrast imaging performed in sequence with elemental imaging on cryofrozen cells has already shown promising results, with 3D imaging quality progressing towards transmission electron microscopy (TEM) imaging level. Confocal light microscopy imaging with fluorescent probes preceding an X-ray nanoprobe experiment forms another attractive option for complementary functional imaging. The "revolution in resolution" in X-ray imaging is also taking place in other imaging fields: Super-resolution light microscopy techniques have been established (4) that will offer fascinating possibilities in combination with X-ray imaging.
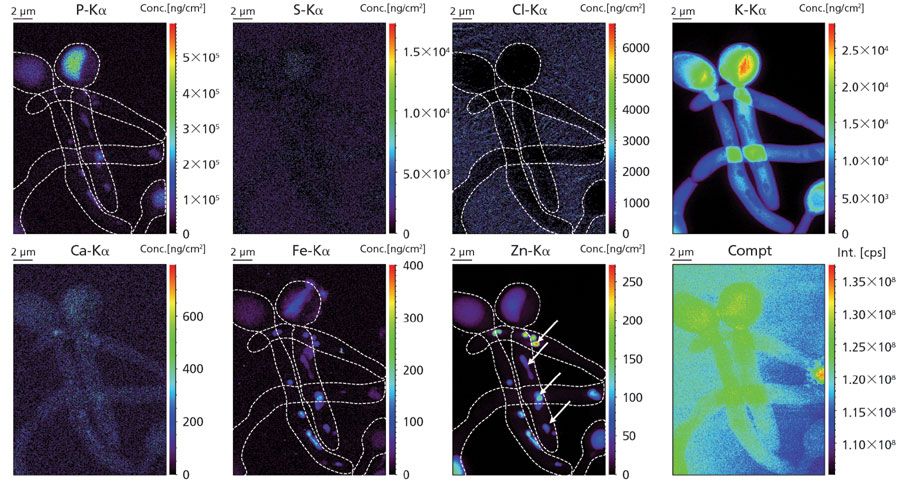
Figure 1: Elemental distribution of phosphorous (P), sulfur (S), chlorine (Cl), potassium (K), calcium (Ca), iron (Fe), and zinc (Zn) (expressed in ng/cm²) and Compton scattering (in counts per second, cps) of cryofrozen Candida albicans. Boundary of C. albicans is indicated with a white striped line for clarity. Hyphae contain local enrichments of iron and zinc (indicated with white arrows). Ice layer thickness covering the sample was estimated to be 16 µm using the K-Kα/Kβ ratio method.
Imaging of trace level metals at the nanoscopic scale shows potential for a wide number of subdisciplines within the life sciences, especially inflammation, medical biotechnology, and plant science. An example of single-cell nanochemical imaging under cryogenic conditions is our current study to gain a better understanding of the role of metals in the human immune system. One of the cell types we are investigating is neutrophils, a type of white blood cell that patrols our blood stream; neutrophils are the first defense cells to migrate to sites of infection. They react fiercely with a wide arsenal of sophisticated defense mechanisms, such as engulfment of the pathogen (also referred to as phagocytosis), release of harmful reactive oxygen species (ROS), and the formation of neutrophil extracellular traps (NETs) to entangle the pathogens (5). Besides these known mechanisms, it is believed that the harvesting of metal ions from the pathogenÂÂ-literally starving the pathogen to death-could form an important immunity response (6). Figure 1 shows the area concentration in ng/cm2 of a variety of elements within cryofrozen Candida albicans, a class II pathogen. Formation of germ tubes-also referred to as hyphae-is clearly visible, containing local enrichments of iron and zinc. Figure 2 (left) shows in-line X-ray holographic imaging of a cryofrozen neutrophil that phagocytosed a single C. albicans, highlighting the subcellular morphology of this event at the nanoscale. Figure 2 (right) shows corresponding elemental images of phosphorus (P), sulfur (S), iron (Fe), and zinc (Zn); phagocytosis is evidenced by clear wrapping of the phosphorus-rich lobulated nucleus around C. albicans. Analytical investigations of changes in metal concentrations throughout phagocytosis are currently ongoing work. Practically, human neutrophils were isolated from live donors, and brought into contact with opsonized C. albicans. Culture was performed upon silicon nitride (Si3N4) membranes, after which the samples were blotted and plunge frozen–vitrified in cryofrozen ethane at -150 °C. Cryogenic transfer of the sample into the X-ray nanoprobe was accomplished using a Leica EM VCT/VCM cryogenic bath–transfer shuttle. Measurements were performed at ESRF's ID16A "nano-imaging" end station, developed in-house as part of the ESRF Upgrade Program. The ID16-A beamline provides in-vacuum nano-XRF analysis of cryofrozen cells at -150 °C using a 17.1 keV pink beam with flux of approximately 2 x 10¹¹ photons/s and beamsize of 50 nm or less using a multilayer Kirkpatrick-Baez mirror system. For obtaining both elemental maps, a dwell time of 50 ms and a pixel size of 50 nm were chosen. Fluorescence was recorded using a six element silicon drift detector (SDD) from SGX Sensortech. For quantification of the elemental maps, a thin flake of NIST SRM 1577C "bovine liver" was measured; self-absorption for the lower atomic number elements were corrected for by using the fundamental parameter (FP) method. Thickness of the ice layer covering the cells was estimated by comparing the K-Kα/Kβ ratio with the theoretical ratio (where no absorption is present). X-ray fluorescence emitted from the cells, but absorbed throughout the covering ice layer, was corrected for all elemental maps. Areal concentrations maps were expressed in nanograms per cm2 or in number of atoms per pixel.
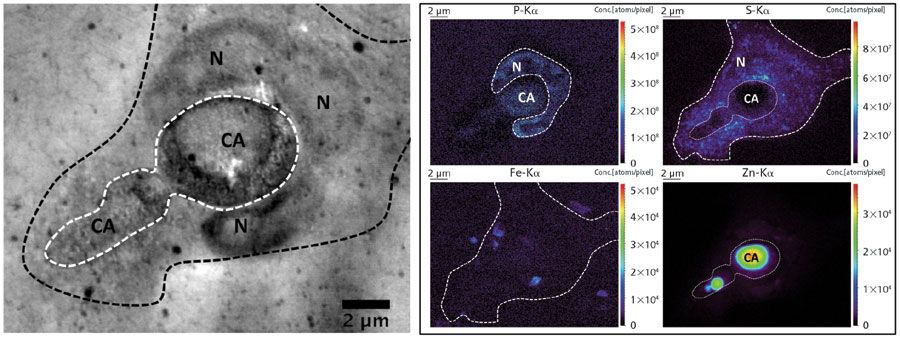
Figure 2: : Left: in-line X-ray holographic imaging of cryofrozen C. albicans phagocytosed by a human neutrophil. Legend: (N) neutrophil lobulated nucleus, (CA) C. albicans. Boundary of C. albicans and neutrophil are indicated using a white and black striped line, respectively. Right: area concentration maps of P, S, Fe, and Zn of the same area, now expressed in number of atoms/pixel. Ice layer thickness covering the sample was estimated to be 24 µm using the K-Kα/Kβ ratio method.
References
(1) C. Ash and R. Stone, Science 300 (5621), 925-925 (2013).
(2) C.J. Chang, Nature Chem. Bio. 11 (10), 744-747 (2015).
(3) T.W. Lyons, C.T. Reinhard, and N.J. Planavsky, Nature 506(7488), 307-315 (2014).
(4) T.L. Liu, S. Upadhyayula, D.E. Milkie, V. Singh, K. Wang, I.A. Swinburne, K.R. Mosaliganti, Z.M. Collins, T.W. Hiscock, J. Shea, A.Q. Kohrman, T.N. Medwig, D. Dambournet, R. Forster, B. Cunniff, Y. Ruan, H. Yashiro, S. Scholpp, E.M. Meyerowitz, D. Hockemeyer, D.G. Drubin, B.L. Martin, D.Q. Matus, M. Koyama, S.G. Megason, T. Kirchhausen, and E. Betzig, Science 360(6386), 13 (2018).
(5) V. Brinkmann and A. Zychlinsky, Nature Rev. Microbiol. 5(8), 577–582 (2007).
(6) M.J. Niemiec, B. De Samber, J. Garrevoet, E. Vergucht, B. Vekemans, R. De Rycke, E. Bjorn, L. Sandblad, G. Wellenreuther, G. Falkenberg, P. Cloetens, L. Vincze, and C.F. Urban, Metallomics 7(6), 996–1010 (2015).
Björn De Samber is with the X-ray Imaging and Microspectroscopy Group (XMI) at Ghent University, in Ghent, Belgium. Direct correspondence to: Bjorn.DeSamber@UGent.be
X-Ray Fluorescence Microscopy at the Advanced Photon Source
Gayle E. Woloschak, S. Chen, and T. Paunesku
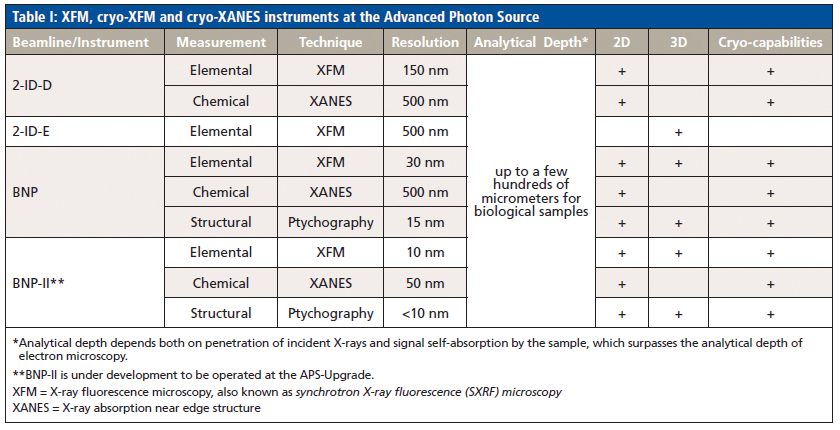
X-ray fluorescence microscopy (XFM) is a technique that is increasingly generating interest among biomedical investigators interested in elemental information about biological materials. Examples of studies with vertebrate animal samples and cells using XFM at the Advanced Photon Source (APS) at Argonne National Laboratory (ANL) range from cell cycle and embryonic development, to metal accumulating diseases, to micronutrient deficiencies, to use of biomedical contrast agents and nanoparticles, to toxic effects of plutonium, as well as new technical developments (for example, in ptychography). There are multiple X-ray fluorescence micro- or nano-probes available at the APS. Two of them have cryogenic capabilities: a 2-ID-D microscope equipped with an Oxford cryojet, which provides millimeter-sized field of view and 200–300 nm spatial resolution, and the Bionanoprobe (BNP), which delivers a spatial resolution down to 30 nm, but has limited travel of ~80 µm (see Figure 1). Both the 2-ID-D and the BNP are used for biological samples for more of 50% of the available beamtime, and both instruments are heavily oversubscribed. The second-generation BNP (BNP-II), as one of beamline enhancement projects for the APS-Upgrade, is currently under development. The BNP-II will enable fast 2D survey of millimeter-sized samples with <10 nm spatial resolution, where a solution for multiscale analysis followed by high-resolution local tomography will be extremely desirable. The major specifications and capabilities of existing instruments, as well as future BNP-II, are listed in Table I. Other facilities in the United States, such as at the National Synchrotron Light Source (now replaced by NSLSII) and Stanford Synchrotron Radiation Lightsource (SSRL), as well as other synchrotrons worldwide such as Diamond Light Source in the UK, the European Synchrotron Radiation Facility (ESRF) in France, Berliner Elektronenspeicherring-Gesellschaft für Synchrotronstrahlung (BESSY II) and Deutsches Elektronen-Synchrotron (DESY) in Germany, Super Photon Ring-8 GeV (SPring8) and Photon Factory in Japan, Shanghai Synchrotron Radiation Facilities (SSRF) in China, and Australian Synchrotron (AS), are all also extensively used.
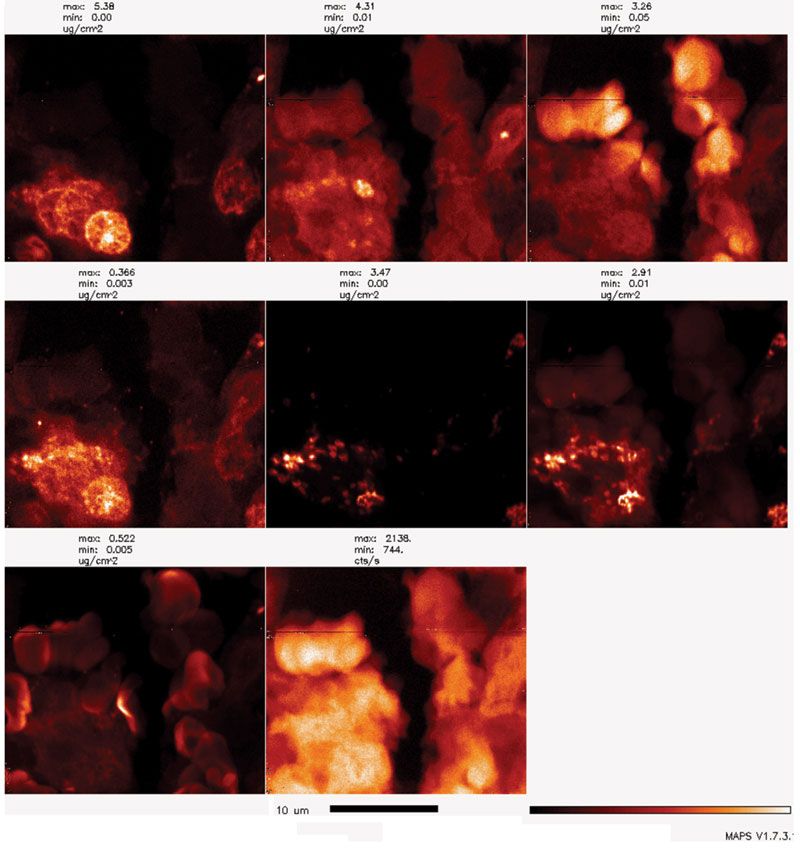
Figure 1: BNP can be used for scanning either at cryogenic or room temperature. In this example, BNP was used to scan a 5-µm thick tissue section obtained after formalin fixation and paraffin embedding of VX2 tumor tissue. A small region of the VX2 tumor grown in a liver of a rabbit injected with Fe3O4@TiO2 core-shell nanoparticles surface covered with glucose is shown here. An X-ray beam with a spot size of 80 nm and energy of 10 keV was used to excite X-ray fluorescence of all the elements present in the 5-µm thick section of rabbit VX2 tumor. Elemental maps were obtained by signal deconvolution using MAPS program. False color red temperature images show elemental signatures of phosphorus (P, most intense in cell nuclei), sulfur (S, present in all cellular proteins), chlorine (Cl), calcium (Ca), titanium (Ti, unique to nanoparticles), iron (Fe, present in nanoparticles, cells, and red blood cells [RBCs]), zinc (Zn, also present in cells and RBCs) and cumulative fluorescence of the entire sample (s_a). Black bar positioned is 10-µm, red temperature color scale goes from no signal (black) to maximum signal (white). Note clear outlines of sectioned cell nuclei (P map), nucleated cells (Ca map), outlines of cells and RBCs (S map, Zn map), as well as nanoparticles inside cells, presumably in endosomes (Ti map and Fe map).
By using XFM, biological samples up to a few hundreds of micrometers thick can be directly studied due to the high penetration power of hard X-rays. Internal structural and elemental information can be reconstructed based on a series of projections collected at different sample rotation angles using a computed tomographic method. Of all the techniques used for sample preparation, the cryogenic sample preparation approach is acknowledged as the best and most accurate, because it preserves elemental distribution as is, even the distribution of free ions (not incorporated into proteins) such as calcium, whose most important function as a second messenger depends precisely on it being free inside cells. Typical sample sizes after cryogenic preparation range from a few micrometers thick (such as frozen cell monolayers produced via plunge freezing), to a few hundred micrometers thick (such as tissue samples produced via high-pressure freezing); room-temperature preparation approaches produce samples with a similar span of thicknesses.
Parallel sample processing suitable for comparative studies of samples at different resolutions and under different imaging conditions is important for extracting the entire possible sample information. While low-resolution overview scans permit region identification and comparisons of different tissues and tissue parts, high-resolution scans allow insight into intracellular elemental distributions that often necessitate tomographic imaging for complete data information acquisition.
Gayle E. Woloschak and T. Paunesku are with the Department of Radiation Oncology at the Feinberg School of Medicine at Northwestern University in Chicago, Illinois, and the Northwestern Argonne Institute of Science and Engineering (NAISE), in Chicago, Illinois. S. Chen is with the Northwestern Argonne Institute of Science and Engineering (NAISE), in Chicago, Illinois, and the X-ray Science Division of Argonne National Laboratory in Argonne, Illinois. Direct correspondence to: g-woloschak@northwestern.edu.
The Use of μ-XRF and μ-XANES in the Study of Functional Ceramics
María Elena Montero-Cabrera, María E. Fuentes-Montero, Hiram Castillo-Michel, Isaí Castillo-Sandoval, Jesús Canche-Tello, and Luis E. Fuentes-Cobas
Synchrotrons around the world are continuously upgrading to achieve higher brightness beams and to obtain micro- and nanometric resolution with high signal-to-noise ratios. As a consequence, µ-X-ray fluorescence (µ-XRF) and µ-X-ray absorption near edge structure (µ-XANES) techniques, with synchrotron light, are considered extraordinarily useful tools for elemental and phase analysis in environmental, earth sciences, and cultural heritage research. Their use in materials science, such as the study of functional ceramics, materials for electronics, and energy harvesting, open up excellent areas of opportunity. The description of microzones with electrical anomalies, of the type of oxygen vacancies, in ferroelectric ceramics (1), or the changes of electrical resistance in electrode-thin film ceramics contacts in non-volatile memories (2), are good cases for the application of X-ray absorption methods. For these studies, distinctive features of the XANES spectra are used, such as the pre-edge zone, the absorption edge energy, and the white-line in transition metals for mixtures and compound materials.
This article deals with the use of µ-XRF and µ-XANES in the study of lead-free piezoelectric ceramics of (Bi0.5Na0.5)0.94Ba0.06TiO3 (BNBT6). In this investigation, the concentration of oxygen vacancies in micrometric zones of the bulk ceramic was detected. Non-stoichiometry is a common phenomenon in these ceramics, and can cause significant changes in electrical conductivity (3).
Experiments using µ-XRF and µ-XANES at the Ti K-edge were performed on the samples on the scanning X-ray microscope at ID21 beamline at the European Synchrotron Radiation Facility (ESRF, France). Details on detectors, monochromators, and focusing elements are given in (1,4,5). XRF spectra were selected in the energy interval Ef from 1 keV to 5.4 keV. The µ-XRF signal matrices were processed using PyMCA software (6). The details of the processing of the µ-XRF signal matrices also appear at the supplementary information in (1).
Then, µ-XANES mapping was performed. Figure 1 shows the µ-XRF intensity maps of the fluorescence lines from Ti and Bi acquired on BNBT6-Np, and an example of µ-XANES spectra, which are reproduced with permission from reference (1). These µ-XANES spectra, obtained by the area integration described in the figure caption, were compared. The general shape of both spectra preserves the main characteristics. The µ-XANES "Np-Global" is very similar to the spectrum published in (7) of the of bulk ceramic. Furthermore, the pre-edge features are of equal intensity, regardless of the integration area. Nevertheless, in the "Np-High-Signal" spectrum, the main edge white-line and the other closest features have lower intensity, have vanished, or are distinctly deformed. The spectra passed the test on fluorescence over-absorption, performed using the standard methods (8), with the plotting function of the Athena graphical user interface (GUI) for the free IFEFFIT interactive XAFS analysis software (9) for the spectra and their derivatives.
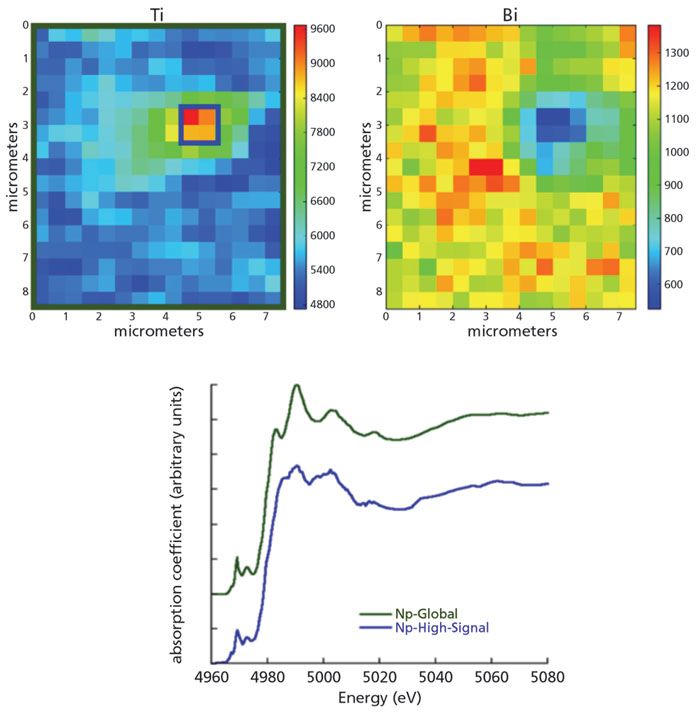
Figure 1: Top: µ-XRF mapping of the non-poled (Np) BNBT6 sample, excited with incident X-ray energy Ex = 5.3 keV, for intensities of the fluorescence lines Ti Kõ = 4.512 keV (left) and BiMõ = 2.418 keV (right). For each map, the counting intensities are displayed in jet color map scale. Bottom: µ-XANES Ti K-edge µ(Ex) integrated spectra. Label "Np-global" was integrated over the whole scanned area (olive green rectangle around the upper left map), and the label "Np-High-Signal" was integrated over the highest intensities of the Ti-signal area (blue square in the upper left map).
The following considerations suggest that there is a Bi deficiency, concentrated in the ceramic zones producing the anomalous spectra:
1) The spatial coincidence of the high-intensity zone of the Ti-signal with the Bi-signal low intensity suggests a slight deficiency of Bi atoms in that zone. Therefore, as Bi is the heaviest absorbent element in the ceramic, the matrix's self-absorption is lower at these points and then the Ti-signal is higher; and 2) the refinement index in the fitting of the XRD high-resolution pattern (not presented here) was consistent with the occupation values obtained by considering vacancies in the perovskite A sites.
The clarification of these differences was explored using two approaches: 1) Identifying the influences of Bi–O vacancies through the modeling of the XANES spectra by means of the ab-initio FDMNES (10) and FEFF9 (11) codes; and 2) investigating the consequences of the distortion of the Ti cation environment through the modeling of the Np-High Signal µ-XANES spectrum by a linear combination analysis (LCA) of experimental model compounds spectra. The details for this are presented in (1).
High resolution synchrotron observations uncovered micrometric regions with detectable chemical and structural alterations. In particular, µ-XANES spectra exposed a Bi–O deficient structure. The local oxygen vacancies altered the densities of electronic states accessible to the photoelectron. In the studied microregions, the local deformation of the vacancy-containing oxygen octahedra is substantially larger than the average one. Following that, the oxygen vacancies and alterations, concentrated in enriched microregions, is certain.
The support provided by CONACYT Projects No. 183706, 257912 and 270738 is acknowledged. Microspectroscopy experiments were accomplished at the European Synchrotron Radiation Facility (ESRF) at Grenoble, as part of the proposal HG/77. J. Canche thanks for the postdoctoral CONACyT scholarship No.291222.
References
(1) J. Canche-Tello, M.E. Montero-Cabrera, M.E. Fuentes-Montero, L. Pardo, H.E. Esparza-Ponce, H. Castillo-Michel, I. Castillo-Sandoval, J.M. Nápoles-Duarte, S.D. Juárez-Escamilla, and L.E. Fuentes-Cobas, J. Eur. Ceram. Soc. 39, 1020–1030 (2019).
(2) C. Lenser, A. Kuzmin, J. Purans, A. Kalinko, R. Waser, and R. Dittmann, J. Appl. Phys. 111, 076101 (2012).
(3) M. Li, H. Zhang, S.N. Cook, L. Li, J.A. Kilner, I.M. Reaney, and D.C. Sinclair, Chem. Mater. 27, 629–634 (2015).
(4) B. Fayard, E. Pouyet, G. Berruyer, D. Bugnazet, C. Cornu, M. Cotte, V.D. Andrade, F.D. Chiaro, O. Hignette, J. Kieffer, T. Martin, E. Papillon, and M. Salomé, V.A. Sole, J. Phys.: Conf. Ser. 425, 192001 (2013).
(5) M. Salomé, M. Cotte, R. Baker, R. Barrett, N. Benseny-Cases, G. Berruyer, D. Bugnazet, H. Castillo-Michel, C. Cornu, B. Fayard, E. Gagliardini, R. Hino, J. Morse, E. Papillon, E. Pouyet, C. Rivard, V.A. Solé, J. Susini, and G. Veronesi, J. Phys.: Conf. Ser. 425, 182004 (2013).
(6) V. Solé, E. Papillon, M. Cotte, P. Walter, and J. Susini, Spectrochim. Acta Part B 62, 63–68 (2007).
(7) M.E. Montero-Cabrera, L. Pardo, A. García, M.E. Fuentes-Montero, M.L. Ballinas-Casarrubias, and L.E. Fuentes-Cobas, Ferroelectrics 469, 50–60 (2014).
(8) D. Gianolio, X-Ray Absorption and X-Ray Emission Spectroscopy: Theory and Applications (John Wiley & Sons, New York, New York, 2016).
(9) B. Ravel and M. Newville, J. Synchrotron Radiat. 12, 537–541 (2005).
(10) Y. Joly, O. Bunau, J.-E. Lorenzo, R.-M. Galera, S. Grenier, and B. Thompson, Journal of Physics: Conference Series (IOP Publishing, New York, New York, 2009), p. 012007.
(11) J.J. Rehr, J.J. Kas, F.D. Vila, M.P. Prange, and K. Jorissen, Phys. Chem. Chem. Phys. 12, 5503–5513 (2010).
María Elena Montero-Cabrera, Isaí Castillo-Sandoval, Jesús Canche-Tello, and Luis E. Fuentes-Cobas are with the Advanced Materials Research Center in Chihuahua, Chih, México. María E. Fuentes-Montero is with the Faculty of Chemical Sciences at the Autonomous University of Chihuahua, in Chihuahua, Chih, México. Hiram Castillo-Michel is with the European Synchrotron Radiation Facility, in Grenoble, France. Direct correspondence to: elena.montero@cimav.edu.mx
Multimodal Scanning X-ray Microscopy at Nanoprobe Endstations of Fourth-Generation Synchrotrons
Michael E. Stuckelberger
For simplicity, scanning X-ray microscopy measurements are often performed acquiring a single mode, or multiple modes are acquired subsequently in dedicated scans. Although adding considerable complexity to the experiments, the simultaneous acquisition of multiple measurement modes offers several advantages: 1) alignment errors are excluded in the pixel-to-pixel correlation of sample properties from different measurement modes; 2) the sample and sample environment are precisely in the same state for all measurement modes for a given spot (this is particularly critical for in-situ measurements suffering from irreversible sample modifications or poor reproducibility); and 3) multimodal scanning microscopy is compatible with time-wise cropping of data points, without sacrificing the correlation between measurement modes. Advantage number 3 turns out to be meaningful if advanced scanning patterns such as Lissajous-like figures are utilized; these cover the entire region of interest in a short time, and increase the resolution with time. In contrast, conventional scan patterns lead to a linearly increasing scanned area with time. For samples with time-dependent X-ray response, for example, due to X-ray induced damage, time-wise cropping makes it possible to keep significant results of the entire region of interest by reducing the sensitivity or resolution in post-processing. This opens the window to new experiments that are hardly feasible today, due to a priori unknown time dependencies.
X-ray fluorescence (XRF) and absorption contrast are prominent examples for measurement modes that can readily be combined, and provide chemical composition together with a measurement of the absorptance. Further common measurement modes include small- and wide-angle scattering or X-ray diffraction (XRD), yielding information on the material structure. Note that X-ray beam induced current (XBIC) or voltage (XBIV), and X-ray excited optical luminescence (XEOL) measurements are less common and most often applied to semiconductor devices such as photovoltaic solar cells (1–4).
XBIC measurements can be used to evaluate the nanoscale performance of polycrystalline solar cells or nanowires, and are often combined with XRF measurements to correlate them with the elemental distribution (1,5). Lock-in amplification not only boosts the signal-to-noise ratio of XBIC measurements (6), but also enables the application of bias light and bias voltage, such that the device can be operated close to standard operating conditions (7). Combining the spatial resolution of the more common electron-beam induced current (EBIC) measurements with the penetration depth of laser-beam induced current (LBIC) measurements, XBIC offers unprecedented spatial resolution of the electrical response from buried structures in assembled devices.
XEOL measurements assess in the simplest form the flux of visible-range photons emitted from each spot, which can be evaluated as the absorptance or radiative-recombination probability in semiconductors. More advanced setups assess the time-resolved (TR) or spectrally resolved (SP) XEOL signal using fast single-photon counters that are synchronized to the bunch clock or a spectrophotometer, respectively. For example, TR-XEOL and SP-XEOL can yield the charge-carrier lifetime and semiconductor bandgap with a spatial resolution beyond the diffraction limit of lasers that are commonly used for photoluminescence measurements.
Ptychography, as a new standard measurement mode at nanoprobe endstations, offers a spatial resolution of the sample structure beyond the spot size. In contrast to the aforementioned modalities, ptychography relies on the high coherence of the X-ray beam, and the reconstruction requires overlapping scan points (8).
A "dream experiment," involving the simultaneous measurement of XRF, XBIV, ptychography, XRD, and XEOL, is laid out in Figure 1. Although the combination of these five measurement modes is feasible, experimental constraints set limits such that only part of these modalities may be measured simultaneously.
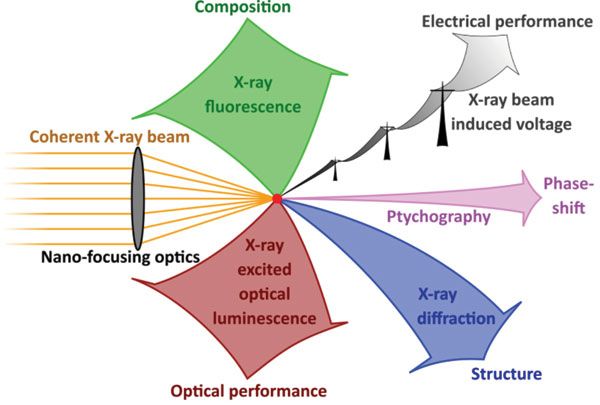
Figure 1: A "dream experiment" involving five-fold multi-modality in scanning X-ray microscopy.
First, the solid angle accessible for detector placement is limited. In practice, XRF, XEOL, and XRD compete with each other, whereas forward scattering for ptychography and electrical wiring for XBIV is less critical.
Second, the optimum dwell time differs among the measurement modes. Unfortunately, the choice of the longest dwell time is not satisfying for combined measurements if sample degradation is an issue. In the case of solar cells, for example, the charge carrier recombination at electronic defects, even at sub-ppm levels, can have a dramatic effect on the XBIC, XBIV, and XEOL signal, whereas structural and compositional damage is observed only at higher defect densities. Therefore, electrical measurements may be performed first with short dwell times, and XRF measurements last with long dwell time for high sensitivity. For the photon-hungry XEOL measurements, a compromise needs to be found between sample degradation and signal-to-noise ratio.
Third, the high coherence required for ptychography is with present X-ray sources not compatible with the high-flux requirement for photon-hungry techniques such as XRF or XEOL. However, with the advent of nanoprobe endstations at fourth-generation synchrotrons, high coherence and high flux are not exclusive anymore, and we expect ptychography to play a crucial role in future multimodal measurements.
Despite these challenges, the advantages of simultaneous multimodal measurements often dominate, particularly for measurements at the highest spatial resolution or in a dynamic environment.
An experiment utilizing a subset of the modalities shown in Figure 1 is highlighted in reference (9), where XRD, XRF, and XBIC were combined for single-grain strain mapping in an industrial solar cell. The simultaneous assessment enabled the correlation of structure, composition, and performance in a statistically relevant matter, which is an important step towards solving the material's paradigm for complex systems, such as graded Cu(In,Ga)Se2 in fully assembled electronic devices.
Worldwide, fourth-generation synchrotrons based on a multibend achromat lattice are being planned, under construction, or have recently started operation (10–13). The dramatic increase of the coherence boosts the focused flux at nanoprobe endstations, which is a game changer for multimodal X-ray microscopy beyond techniques that intrinsically rely on coherence as highlighted in Figure 2.
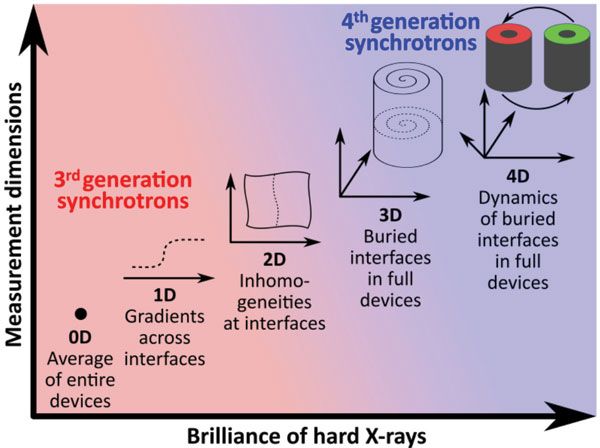
Figure 2: With increasing brilliance, the number of accessible measurement dimensions increase.
Today, static 2D measurements are standard in scanning X-ray microscopy, and reasonably high throughput is achieved to evaluate large regions of interest or large sample series. Three-dimensional measurements in tomography mode or 2D measurements with time and parametrizations thereof as third dimension are feasible. However, 4D measurements are limited by the focused X-ray flux to proofs of principle.
With the high brilliance from multibend achromat lattice synchrotrons, 3D scanning tomography will become a commodity, and the systematic 4D sample characterization becomes accessible beyond proof-of-principle applications. Finally, with photon-efficient X-ray focusing, scanning X-ray microscopy will not be limited to the modalities mentioned here, but it will be expanded by a variety of measurement modes that are performed today with limited spatial information.
References
(1) M.E. Stuckelberger, B. West, T. Nietzold, B. Lai, J.M. Maser, V. Rose, and M.I. Bertoni, J. Mater. Res. 32(10), 1825–1854 (2017).
(2) M.E. Stuckelberger, T. Nietzold, B.M. West, B. Lai, J.M. Maser, V. Rose, and M.I. Bertoni, 44th IEEE Photovoltaic Specialist Conference, PVSC, 2017.
(3) R.P. Taylor, A.A. Finch, J.F.W. Mosselmans, P.D. Quinn, J. Lumin. 134, 49–58 (2013).
(4) G. Martínez-Criado, B. Alén, J.A. Sans, A. Homs, I. Kieffer, R. Tucoulou, P. Cloetens, J. Segura-Ruiz, J. Susini, J. Yoo, and G. Yi, Nucl. Instrum. Methods Phys. Res., Sect. B 284, 36–39 (2012).
(5) B.M. West, M. Stuckelberger, H. Guthrey, L. Chen, B. Lai, J. Maser, V. Rose, W. Shafarman, M. Al-Jassim, and M.I. Betroni, Nano Energy 32, 488–493 (2017).
(6) M.E. Stuckelberger, T. Nietzold, B.M. West, T. Walker, C. Ossig, M. Kahnt, F. Wittwer, J. Deng, J.M. Maser, B. Lai, Z. Cai, V. Rose, A. Ulvestad, M.V. Holt, S. Hruszkewycz, J.J. Dynes, J. Wang, D. Salomon, R. Tucoulou, X. Huang, H. Yan, E. Nazaretski, Y.S. Chu, C.G. Schroer, and M.I. Bertoni, Microsc. Microanal. 24(S2), 434–435 (2018).
(7) C. Ossig, T. Nietzold, B. West, M. Bertoni, G. Falkenberg, C.G. Schroer, and M.E. Stuckelberger, JoVE (in press) (2019).
(8) F. Pfeiffer, Nature Photonics, 12(1), 9–17 (2018).
(9) A. Ulvestad, et al. J. Synchrotron Rad. 26 1 1316–1321 (2019).
(10) P.F. Tavares, e. al. J. Synchrotron Rad. 25, 1291–1316 (2018).
(11) P. Raimondi, Synchr. Rad. News 29, 8–15 (2016).
(12) C.G. Schroer, et al., J. Synchrotron Rad. 25, 1277–1290 (2018).
(13) R. Hettel, Synchr. Rad. News 32,2, 34-35 (2019).
Michael E. Stuckelberger is with the Deutsches Elektronen-Synchrotron (DESY), in Hamburg, Germany. Direct correspondence to: michael.stuckelberger@desy.de

New Study Reveals Insights into Phenol’s Behavior in Ice
April 16th 2025A new study published in Spectrochimica Acta Part A by Dominik Heger and colleagues at Masaryk University reveals that phenol's photophysical properties change significantly when frozen, potentially enabling its breakdown by sunlight in icy environments.