Organic Nitrogen Compounds IV: Nitriles
Spectroscopy
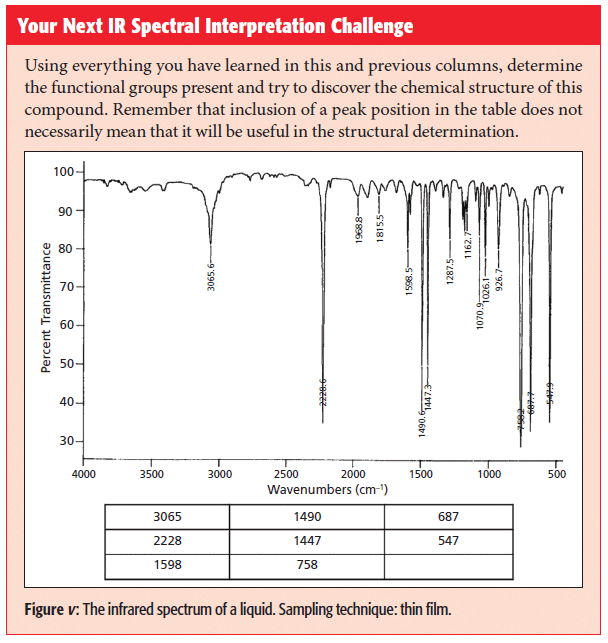
The nitrile functional group consists of a carbon-nitrogen triple bond with one substituent as such: -C≡N. Nitriles have an intense and sharp C≡N stretching peak near 2200 cm-1. This peak for aromatic nitriles is lower than for saturated nitriles because of conjugation, like what we saw for C=O bonds. Nitriles are not that common but their presence is easy to spot because of the unusual intensity and position of the C≡N stretching peak.
In the previous three installments of our examination of the infrared (IR) spectra of organic nitrogen containing functional groups, I introduced the topic and then we looked at primary, secondary, and tertiary amines. In the introductory column (1), we discussed how carbon and nitrogen can form single, double, and triple bonds, as seen in Figure 1.

Figure 1: Examples of nitrogen-carbon bonds. From left to right a single bond, a double bond, and a triple bond.
In that first column, I also bemoaned the fact that C-N bonds have weak stretching peaks and show up in the busy fingerprint region so are hard to spot, and that C=N bonds are chemically unstable and rare. Thus, there is not a good IR spectral signature for either of these bonds. The carbon-nitrogen triple bond gives rise to a functional group called nitriles, and contain a C≡N bond with a single substituent. If the carbon adjacent to the nitrile is saturated, the nitrile is said to be saturated. Similarly, if the carbon adjacent to the nitrile is aromatic, the nitrile is aromatic.
Recall that one of the things that determines peak positions in IR spectroscopy is chemical bond strength, and that as chemical bond order goes up the force constant increases and peak positions move to higher wavenumbers (2). For example, we have learned that C-C stretches fall between 1600 and 1400 cm-1 (3) (going forward, assume all peak positions are in cm-1 or wavenumber units), that C=C stretches fall between 1680 and 1630 (4), and that C≡C stretches fall around 2200 (5).
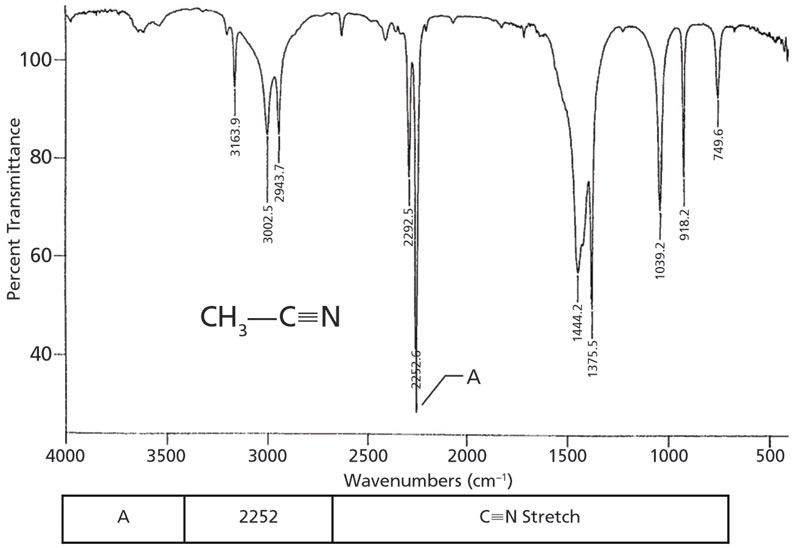
Because the nitrile group contains a triple bond, and because carbon and nitrogen have similar atomic masses (remember that atomic mass is another thing that determines peak positions [2]) we might expect C≡N stretching peaks to fall near where C≡C stretching peaks do, near 2200. This is, in fact, the case-as seen in the spectrum of the common solvent acetonitrile, shown in Figure 2. The peak at 2252 is the C≡N stretch of this molecule.

Figure 2: The infrared spectrum of acetonitrile, C2H3N.
Note the intensity and sharpness of the C≡N stretching peak. Recall that one of the things that determines peak intensities in IR spectroscopy is the change in dipole moment with respect to distance, dµ/dx, during a vibration (2). The carbon-nitrogen triple bond is relatively polar, and stretching it gives a large dµ/dx value, hence the intensity of the C≡N stretching peak. For saturated nitriles, this peak falls from 2260 to 2240. For aromatic nitriles, this peak is found between 2240 and 2220.
Note that the C≡N stretching peak for aromatic nitriles is lower than for saturated nitriles. This is because of a phenomenon called conjugation, where there is an electronic interaction between the C≡N bond and the aromatic ring that weakens the C≡N bond, lowers its force constant, and hence lowers the peak position. Conjugation also takes place when C=O bonds are attached to aromatic rings, and as we have seen this causes the C=O stretching peak position to also be lowered (6). Table I summarizes the C≡N stretching peak positions for nitriles.

There are no other useful group wavenumbers for nitriles, but the unusual position and intensity of the C≡N stretching peak make nitriles easy to detect by IR spectroscopy.
I am afraid that, besides the C≡N stretching peak, the spectrum of acetonitrile is not a good reference spectrum. Note that the molecule contains a methyl group, hence a saturated carbon, but that the C-H stretches are above 3000. This violates the rule that, in general, saturated C-H stretches fall below 3000. (3). The problem here is that the methyl group is attached directly to the nitrile, messing up its stretching force constants. Recall, however (3), that methyl groups have a bending umbrella mode at 1375±10. The peak at 1375 in the spectrum of acetonitrile is the methyl group umbrella mode, the best indicator in this spectrum that there is a methyl group present. There are very few absolute rules when interpreting IR spectra, but I can honestly say that I have never seen a CH3-C group umbrella mode peak ever fall outside the 1375±10 range.
Conclusions
Nitriles contain a C≡N bond, and are either saturated or aromatic depending on the adjacent carbon. They have an intense C≡N stretching peak around 2200 that is sharp, intense, and easy to spot, because of its unusual position. Aromatic nitriles have a lower C≡N stretching peak position than saturated nitriles, because of conjugation.
Answers to Previous IR Spectral Interpretation Challenges
As discussed in the last column (7), the two previous "IR Spectral Interpretation Challenges" were out of order, meaning you didn't have the right information at the right time to complete them properly. As a result, the last column contained two IR spectral interpretation challenges. The solutions to both are here.
Solution to IR Spectral Interpretation Challenge #1
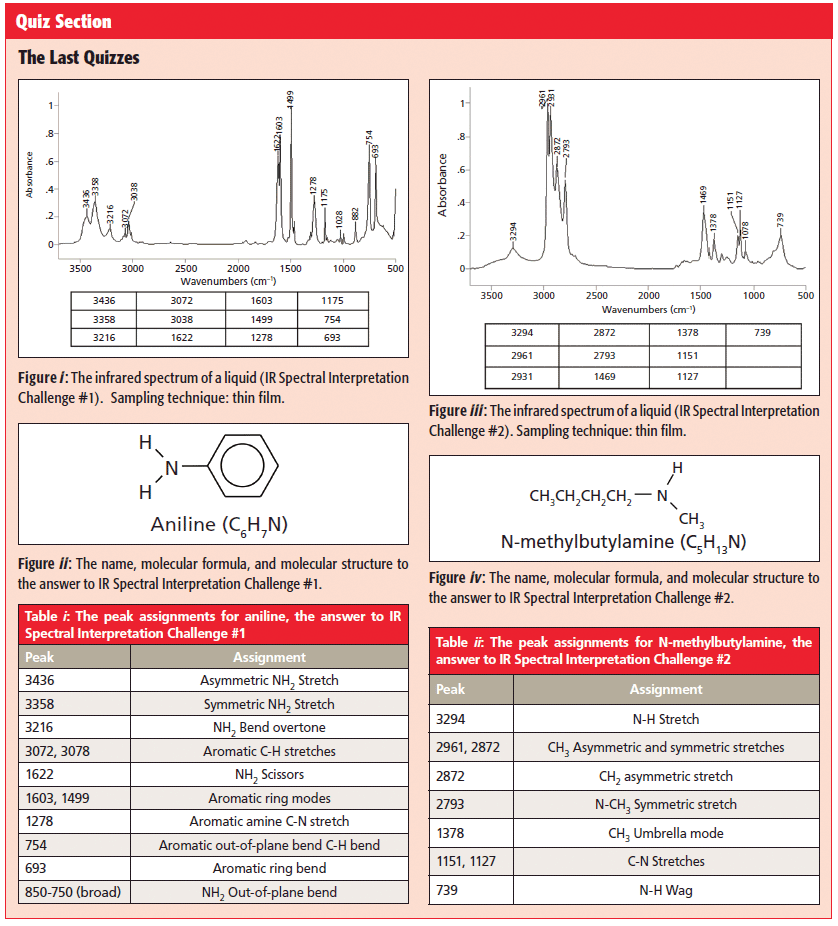
The spectrum in question is seen in Figure i of the Quiz Section, along with a table of its peak positions.
As always, we begin looking at an unknown spectrum from left to right, like a sentence in a book. The first things we encounter in Figure i are two medium intensity and medium width peaks at 3346 and 3358. We have seen that both OH stretches and N-H stretches fall in this wavenumber range (1). However, recall that, because OH bonds are more polar than NH bonds, OH bonds form stronger hydrogen bonds, and hence have wider peaks than NH bonds. Given the medium width of the two peaks at 3346 and 3358, they should be assigned as NH stretches. The fact that there are two NH stretching peaks means the nitrogen has two hydrogens attached, or in other words, is a NH2 group.
One of the functional groups that has an NH2 group in it is a primary amine. One of the beauties of NH stretches is that their position is sensitive to whether the amine is saturated or aromatic. Using what we have learned previously (8), the NH stretching peak positions here mean the molecule is an aromatic amine. Specifically, the 3436 peak is the asymmetric NH2 stretch, and the 3358 peak is the NH2 symmetric stretch. Thus, based just on the number and position of the NH2 stretches we now know our molecule is a primary aromatic amine.
Primary amines also have NH2 bending peaks, and we should track these down to confirm our primary amine assignment. Primary amines have an NH2 scissoring peak between 1650 and 1580. The peak at 1622 in Figure i can be assigned as this peak. Primary amine NH2 groups also have a wagging vibration, with the hydrogens bending above and below the plane of the page. This peak falls from 850 to 750, and is broadened like the NH2 stretches, due to hydrogen bonding. Seeing this peak in Figure i is a little tricky. There is a broad envelope of absorbance that extends from 800 to 600, but there are sharp peaks from another functional group riding on top of it. As a result, we cannot see the top of the NH2 stretching peak, but the properly placed broadened envelope means it is there.

Our NH stretches told us we have a primary aromatic amine, but we still need to confirm the presence of an aromatic ring by looking for its peaks. Recall that aromatic rings are unsaturated, and hence have C-H stretching peaks between 3100 and 3000 (9). There are several peaks in this region in Figure i, confirming the presence of unsaturated rings. However, C=C bonds also have C-H stretches in this region, so we must look for other aromatic peaks to confirm their presence. Recall that benzene rings have "ring modes" from the stretching of the C-C bonds in the ring that give sharp peaks from 1620 to 1400 (9). The sharp peaks at 1603 and 1429 are ring modes. Lastly, we need to figure out the substitution pattern around the benzene ring. Recall that one can distinguish mono-, ortho-, meta-, and para-substituted benzene rings from each other using the presence or absence of the ring bend at 690±10, and the position of the aromatic C-H wagging peak (9). The ring bend is present in Figure i at 693 and the C-H wag is at 754, meaning the benzene ring is mono-substituted. This means we are pretty much done. We know we have a primary aromatic amine, and a mono-substituted benzene ring. The only structure that makes sense it put the amine on the ring, which gives us the molecule aniline, whose structure is seen in Figure ii in the Quiz Section, and whose peak assignments are seen in Table i in the same section.

Solution to IR Spectral Interpretation Challenge #2
The spectrum for the second IR Spectral Interpretation challenge is seen in Figure ii of the Quiz Section. Looking from left to right, the first peak we encounter is at 3294. Note that it is somewhat broadened but not anywhere near as broad as an OH stretch (1), which indicates it is a N-H stretch. Note that there is one N-H stretching peak, so there is only one N-H bond. We have learned that secondary amines have a single N-H stretch, so there is likely a secondary amine present here (7). The position of this peak can distinguish saturated secondary from aromatic secondary amines. The peak at 3294 tells us this secondary amine is saturated. We have learned that secondary amines also have a N-H wagging peak at 750–700 (7). There is a peak in Figure ii at 739 that is somewhat broadened from hydrogen bonding, indicating this is the N-H wag we are looking for.
For this to truly be a saturated amine, the C-H stretches must confirm the presence of saturated carbons. Recall (3) that saturated C-H bonds have C-H stretching peaks between 3000 and 2800. There are several peaks in Figure ii in that range, meaning there are saturated carbons present. The lack of C-H stretching peaks between 3100 and 3000 means that there are no unsaturated carbons present, and that all the carbons present are saturated. The fact that there are more than two saturated C-H stretching peaks means there are methyl and methylenes in the molecule. Specifically, 2961 is the CH3 asymmetric C-H stretch, 2931 is the CH2 asymmetric stretch, and 2872 is the CH3 symmetric stretch. The fourth peak in this region at 2793 is too low to be a normal CH3 or CH2 stretch. Recall that the N-methyl group, where there is a CH3 attached to a nitrogen atom, has a low wavenumber symmetric methyl stretch (8). The peak at 2793 is properly placed to be an N-methyl symmetric stretch. This peak position is sensitive to whether the amine is saturated or aromatic. This peak's position indicates the amine is saturated, consistent with what the N-H and C-H stretches have told us.
So far, then, we know we have a saturated secondary amine, and that one of the substituents is a methyl group. Our final job then is to determine the other substituent on the amine nitrogen. We know we have CH3 and CH2 present, so the second amine substituent is likely an alkyl chain. To confirm the presence of the CH3 there should be an umbrella mode at 1375±10 (3). The peak at 1378 in Figure ii fits the bill. Recall that the CH2 rocking peak appears at 720±10 if there are four or more methylenes in a row (3). There is a peak in Figure ii at 739, but it is a little too high in wavenumber and too wide to be a CH2 rock, which is why we have already assigned this peak as being from the NH wag of our secondary amine. This all means is that there is no CH2 rocking peak present, and that the alkyl chain present has less than four methylenes in a row. This means the alkyl chain has either one, two, or three methylenes in it.
Recall that the relative intensity of the methylene to methyl asymmetric stretching peaks tracks with the CH2/CH3 ratio for a molecule (3). In Figure iii in the Quiz Section, these two peaks are the same size, indicating the CH2/CH3 ratio is two or three. This fact eliminates the substituent being an ethyl group, since for an ethyl group the methyl peak would be bigger than the methylene peak.
I have said before that one of the biggest challenges in determining an entire molecular structure from an IR spectrum by itself is getting the exact length of alkyl chains. This is the case here. We have narrowed down the chain to having two or three methylenes, but that is a far as we can push the analysis. The final answer could be determined by simply looking up the two appropriate reference spectra.
The substituent is a butyl group with three methylenes in a row, and the molecule is n-methyl butylamine. Its structure is seen in Figure iv in the Quiz Section, and its peak assignments are seen in Table ii in the same section.
References
(1) B.C. Smith, Spectroscopy 34(1), 10–15 (2019).
(2) B.C. Smith, Spectroscopy 30(1), 16–23 (2015).
(3) B.C. Smith, Spectroscopy 30(4), 18–23 (2015).
(4) B.C. Smith, Spectroscopy 31(11), 28–34 (2016).
(5) B.C. Smith, Spectroscopy 32(7), 18–24 (2017).
(6) B.C. Smith, Spectroscopy 32(9), 31–36 (2017).
(7) B.C. Smith, Spectroscopy 34(5), 22–26 (2019).
(8) B.C. Smith, Spectroscopy 34(3), 22–25 (2019).
(9) B.C. Smith, Spectroscopy, 31(5), 36–39 (2016).
Brian C. Smith, PhD

Brian C. Smith, PhD is the founder and CEO of Big Sur Scientific, a maker of portable mid-infrared cannabis analyzers. He has over 30 years experience as an industrial infrared spectroscopist, has published numerous peer reviewed papers, and has written three books on spectroscopy. As a trainer, he has helped thousands of people around the world improve their infrared analyses. In addition to writing for Spectroscopy, Dr. Smith writes a regular column for its sister publication Cannabis Science and Technology and sits on its editorial board. He earned his PhD in physical chemistry from Dartmouth College. He can be reached at: SpectroscopyEdit@MMHGroup.com

AI Shakes Up Spectroscopy as New Tools Reveal the Secret Life of Molecules
April 14th 2025A leading-edge review led by researchers at Oak Ridge National Laboratory and MIT explores how artificial intelligence is revolutionizing the study of molecular vibrations and phonon dynamics. From infrared and Raman spectroscopy to neutron and X-ray scattering, AI is transforming how scientists interpret vibrational spectra and predict material behaviors.
Real-Time Battery Health Tracking Using Fiber-Optic Sensors
April 9th 2025A new study by researchers from Palo Alto Research Center (PARC, a Xerox Company) and LG Chem Power presents a novel method for real-time battery monitoring using embedded fiber-optic sensors. This approach enhances state-of-charge (SOC) and state-of-health (SOH) estimations, potentially improving the efficiency and lifespan of lithium-ion batteries in electric vehicles (xEVs).
New Study Provides Insights into Chiral Smectic Phases
March 31st 2025Researchers from the Institute of Nuclear Physics Polish Academy of Sciences have unveiled new insights into the molecular arrangement of the 7HH6 compound’s smectic phases using X-ray diffraction (XRD) and infrared (IR) spectroscopy.