Using Reference Materials, Part II: Photometric Standards
Spectroscopy
Alignment of the instrument y-axis is a critical step for quantitative and qualitative measurements using spectroscopy. Here, we explain in detail how to use photometric standards for ultraviolet, visible, near infrared, infrared, and Raman spectroscopy.
Alignment of the y-axis (photometric axis) is a helpful tool for all spectra when used for both quantitative and qualitative measurements using spectroscopy. The assumptions of regression are that the data channels or x-axis of data is aligned, and that only amplitude in the y-axis changes with concentration in some mathematically defined manner. An aligned y-axis provides an improved method to compare spectra, and to relate amplitude to concentration. The correction of y-axis (amplitude) variation provides a minimum bias between instruments, and provides a platform for improved calibration or method transfer between instruments. This article provides a discussion for using photometric reference materials to align the y-axis for ultraviolet, visible, near infrared, infrared, and Raman intensity spectroscopic methods. A general method for correcting each type of absorption-based spectrophotometer is given, as well as the types of reference standards used for calibration or verification of the photometric scale. For Raman spectroscopy, a method is described for intensity correction.
Photometric accuracy is a formal term used to describe how well a measuring device (spectrophotometer or illuminance meter) is able to determine the total energy flux transmitted through, reflected from, or scattered from a standard device or standard reference material (SRM). Part I of this series addressed the use of wavelength or wavenumber standards to align the x-axis for spectroscopic data (1); this Part II article addresses the photometric (or y-) axis alignment. The various references to National Institute of Standards and Technology (NIST) documents and SRMs are given throughout this article. Note that equations are described as referenced in (2,3) and that SRM data may be found at the NIST website (https://www.nist.gov/srm).
Volume 14.01 of the American Society for Testing and Materials (ASTM) International document (4,5), describes the measurement of the photometric accuracy for an instrument as follows (Sections 20.1 and 20.3):
“Select the appropriate Standard Reference Material and obtain ten successive readings of the apparent absorbance or transmittance at the specified wavelength. Average the ten readings. The photometric accuracy is the difference between the true absorbance or transmittance value and the average observed value.”
It is further stated that the following apply to the reporting of photometric accuracy:
“Report the photometric accuracy in the following order: reference material, wavelength, true absorbance or transmittance, observed absorbance or transmittance plus or minus the standard deviation.”
Example of Reporting Photometric Accuracy
As an example the stated specifications for photometric accuracy for a test instrument might be written as:
Photometric Accuracy:
±0.002 Au (for range of 0.0 to 0.5 Absorbance units)
±0.004 Au (for range of 0.5 to 1.0 Absorbance units)
±0.3% T
SRM: Measured with NIST 930d filter
Here is an evaluation of these specifications in greater detail. A photometric accuracy of "0.002 Au at 0 to 0.5 Au" indicates that, after the instrument has been set to zero, a standard sample that transmits between 30.1% T (0.5 Au) and 100% T (0.0 Au) measures within ±0.002 Au, as compared to the specified value for that reference standard material at any wavelength position (we note that A and Au are used synonymously).
The tolerance for each of the 930d filters has been stated by NIST as ±0.5 percent relative. Thus, a 10% T filter, which corresponds to a measurement of 0.1 T or 1.0 Au for neutral density 930d-type reference standard, would be expected to be within the range of 9.95 to 10.05% T. These values are equivalent to 1.0022 Au to 0.9978 Au. The difference in Au is 1.0022 Au minus 0.9978 Au equals 0.0044 Au. The standard tolerance in Au is 1.0000 ±0.0022 Au, rounded to 1.000 ±0.002 Au. Conservatively, for transmittance, we state 10.00 ±0.03% T; and related to 0.0 Au or 100% T, we specify 100.0 ±0.3% T.
If the stated tolerance for the NIST 930d filter is ±0.002 Au at 1.0 Au, we are stating that our maximum deviation in photometric accuracy for our instrument at 1.0 Au is also ±0.002 Au. For the worst case measurement for the NIST filter, we would have the filter error of ±0.002 added to the instrument error of ±0.002, to result in a total maximum variation ±0.004 Au error (this is our stated specification for the example given).
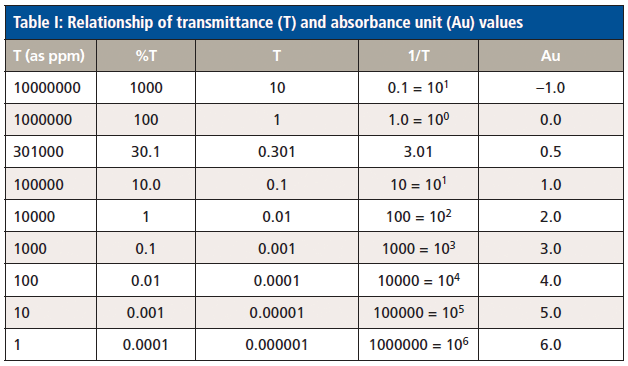
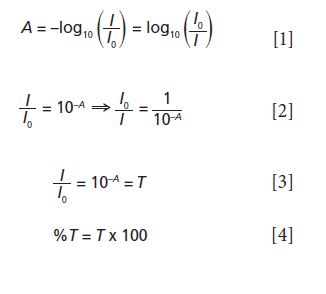
And one can readily calculate the reflectance or transmittance of any measurement given the absorbance of that measurement as follows. For conversion of absorbance (A) to transmittance (T), we use equations 1–4. (Note that the relationships between transmittance and absorbance are given in Table I.)
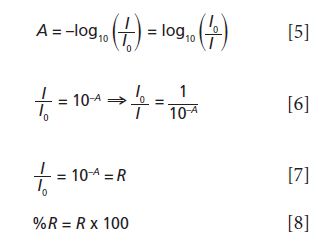
To convert absorbance (A) to reflectance or reflection (R) we use equations 5–8:
Photometric Correction for Absorbance-based Spectrophotometers
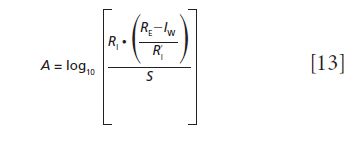
For making photometric calibrations using known reference materials, the ratioed replicate spectral data are retained, along with the replicate spectra of a reference sample and dark background, or dark sample. Equation 9 represents Beer's law for taking measurements using a spectrophotometer. To convert the light reflected or transmitted from a sample (I) ratioed to the incident energy (I0) to Absorbance (A), as a linearized estimate of the spectral response as related to analyte concentration, the following equations 9-13 may be applied.
If only an internal reference is used for spectral collection, then the absorbance spectrum with respect to wavelength is computed as equation 9:

If an external standard material is used to calibrate an automated internal reference material, then the absorbance spectrum with respect to wavelength is computed as equations 10 and 11:

where:

and where for equations 9-11, S is the sample measurement; DS is the dark measurement for the sample, RI is the internal reference measurement, DR1 is the dark measurement for the internal reference sample, RE is the measurement of the external standard reference material for calibration, DRE is the dark measurement for the external standard reference material, and RΔ is the ratio between the dark corrected RE and RI. The final spectrum is simplified to the ratio of (internal reference corrected by the external reference minus dark) divided by (sample minus dark). Note that dark is a measurement where no energy from the source is allowed to the detector (the source energy is blocked), or where a totally dark sample or light trap is measured. The dark measurement represents the dark current changes within the instrument during a measurement that relate to electronic noise where the detection electronics, computational electronics, and control electronics perform basic measurement functions with no imputed energy reaching the detector (the source is turned off or blocked using a shutter closure during the dark measurement).
When a comprehensive method of photometric correction includes a light trap measurement to determine the dark response to correct for optical and window scatter, we use equation 12:
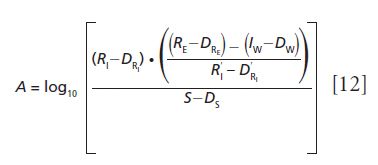
where the variable terms used include R'I as the photometric correction calibration measurement of the internal reference sample, D'RI is the photometric correction calibration measurement of the dark signal intensity for the internal reference sample, IW is the intensity measurement of the light trap to determine the window scatter, and DW is the measurement of the dark signal intensity for the light trap measurement.
Equation 12 is simplified for understanding by removing the dark correction terms as equation 13:
Ultraviolet (UV) Photometric Standards
There are several available standards used for calibrating or verifying photometric correction when using ultraviolet spectrophotometers, with potassium dichromate demonstrated here. The ultraviolet region is generally considered to include from 190 nm to 380 nm (non-vacuum UV region). The photometric values for UV standards are illustrated in Figures 1-2, and the reference absorbance values are given in the accompanying Table II (reference spectra and data provided with permission by Starna Ltd.).
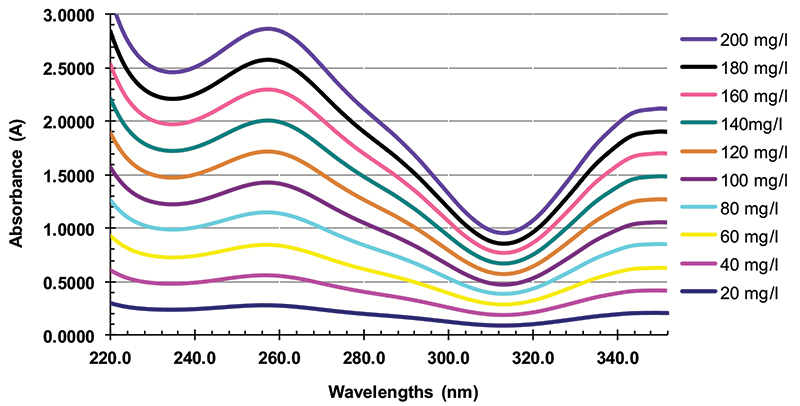
Figure 1: Potassium dichromate absorbance and linearity standard traceable to SRM 935a. (Data and spectrum provided with permission by Starna Ltd., Hainault, IG6 3UT, UK. www.starna.com).
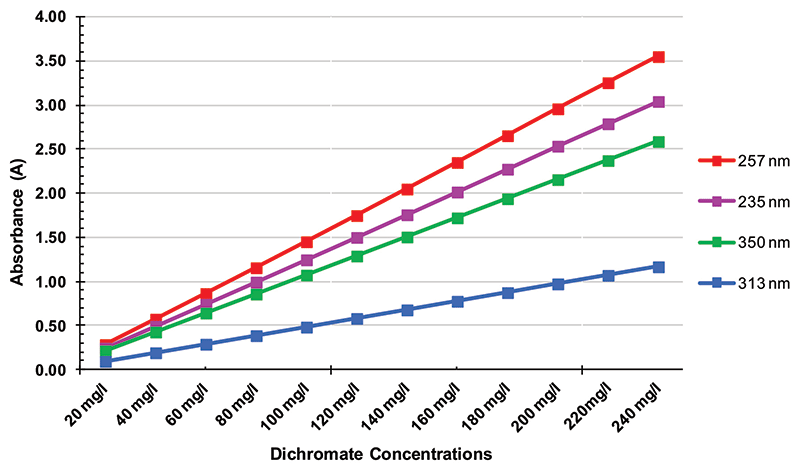
Figure 2: Potassium dichromate absorbance linearity as a photometric standard using twelve concentrations of standard and four specific wavelength measurements (257, 235, 350, and 313 nm) (Table II from 20–200 mg/L). This is a test for photometric linearity throughout the ultraviolet region. (Data and spectrum provided with permission by Starna Ltd., Hainault, IG6 3UT, UK. www.starna.com).

Visible (Vis) Photometric Standards
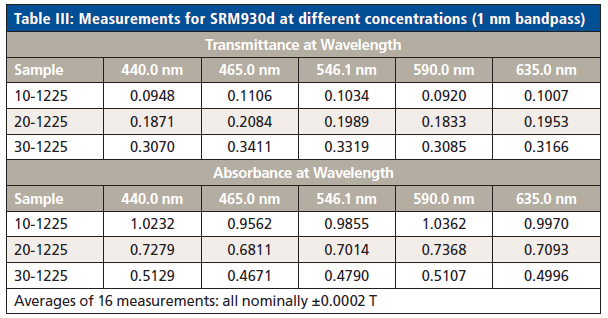
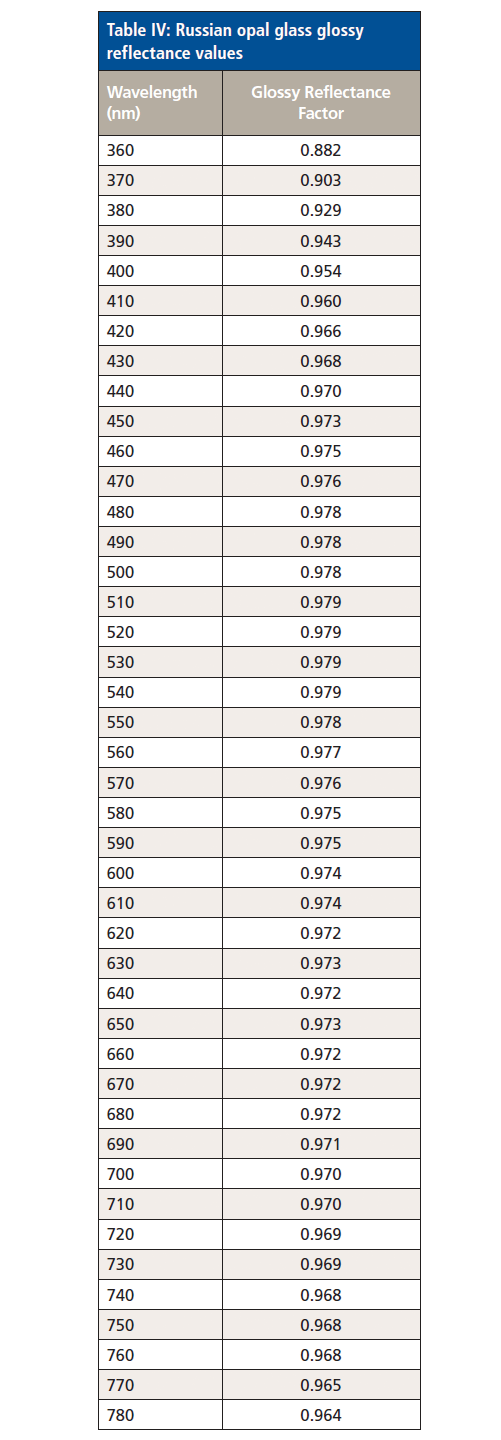
The visible spectral region is generally considered over the range of 380 nm to 750 nm. Two types of available standards are shown, namely NIST SRM 930d and Russian opal glass, which are used for calibrating or verifying photometric alignment of visible spectrophotometers. Photometric values for these standards are illustrated in Figures 3-4, and the reference absorbance values are given in the accompanying Tables III and IV.
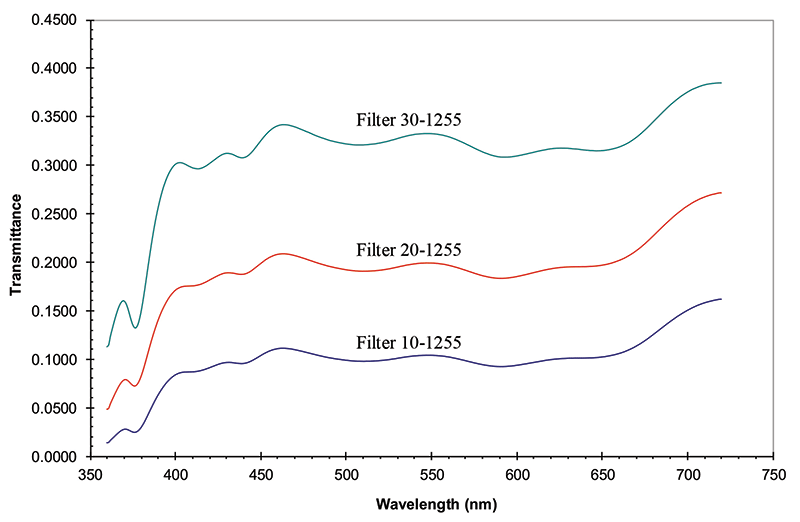
Figure 3: Transmittance of SRM-930d standard set photometric standards; Filter 10-1225, Filter 20-1255, and Filter 30-1255; data in Table III. (Data and spectrum used with permission from Avian Technologies, New London, NH).
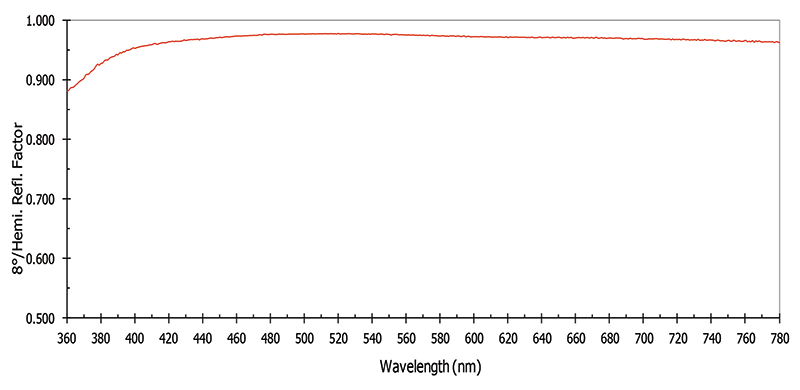
Figure 4: Russian opal glass glossy reflectance standard measured using 8°/hemispherical spectral reflectance factor geometry. Mean reflectance over the spectral region shown is 0.967. Measured photometric data is given in the Table IV. (Data and spectrum used with permission from Avian Technologies, New London, NH).
Near Infrared (NIR) Reflectance Photometric Standards
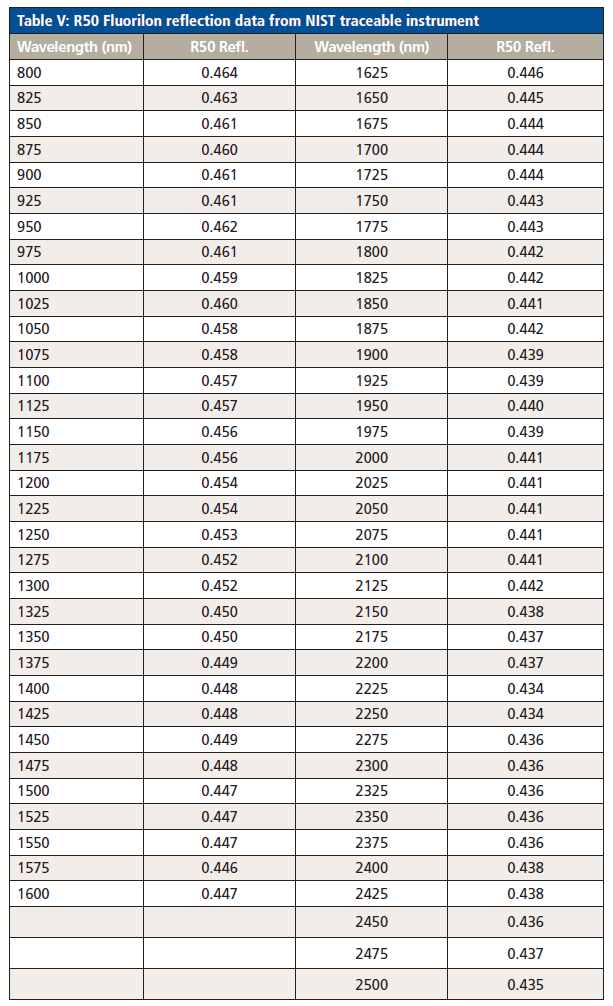
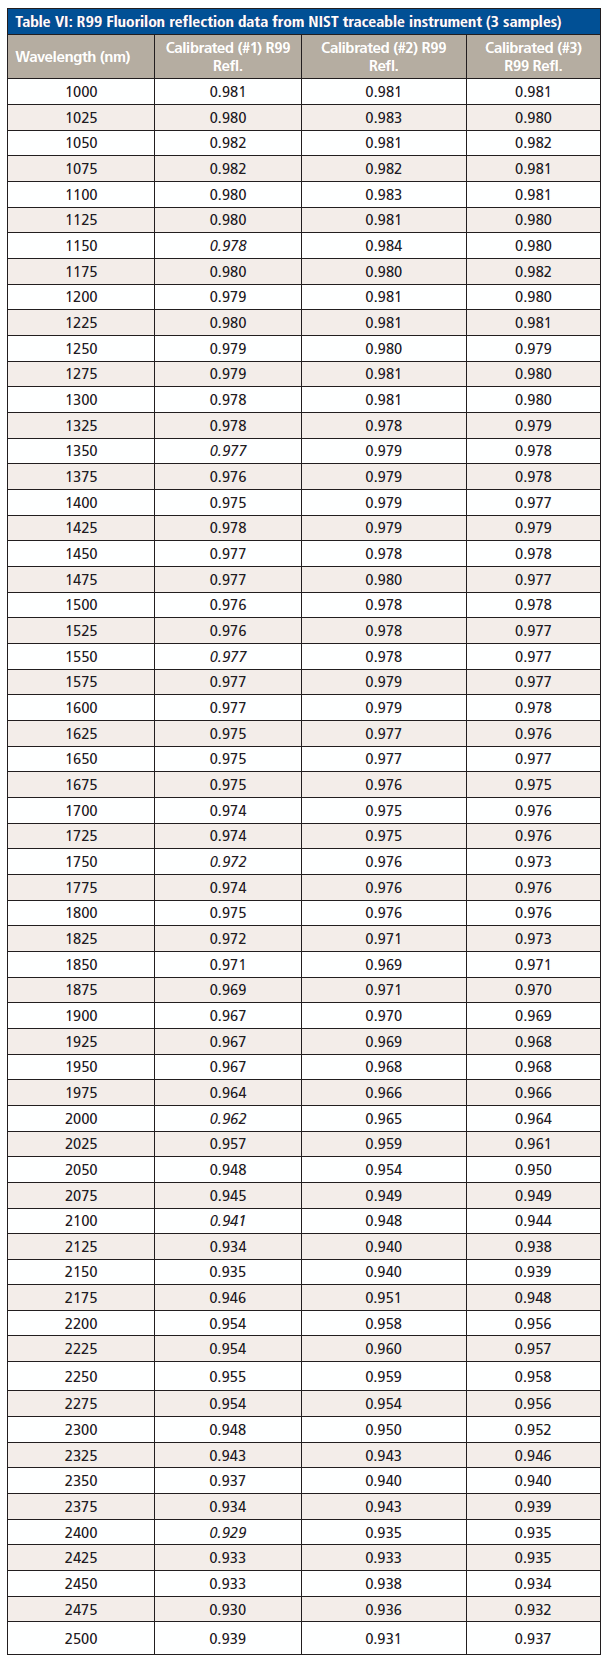
The near infrared spectral region is generally considered to be 780 nm to 2500 nm. Two types of available reflectance standards are shown, namely R50 (~50% reflectance), and sintered Fluorilon (PTFE) (R99 or ~99% reflectance), which are used for calibrating or verifying photometric alignment of NIR spectrophotometers. Photometric values for these standards are illustrated in Figures 5 and 6, and the reference reflectance values are given in the accompanying Tables V and VI. (materials noted provided by courtesy by Avian Technologies). Note that in transmittance measurement mode various solvents or dry air may be used to calibrate or verify the transmittance accuracy to zero (0% T).
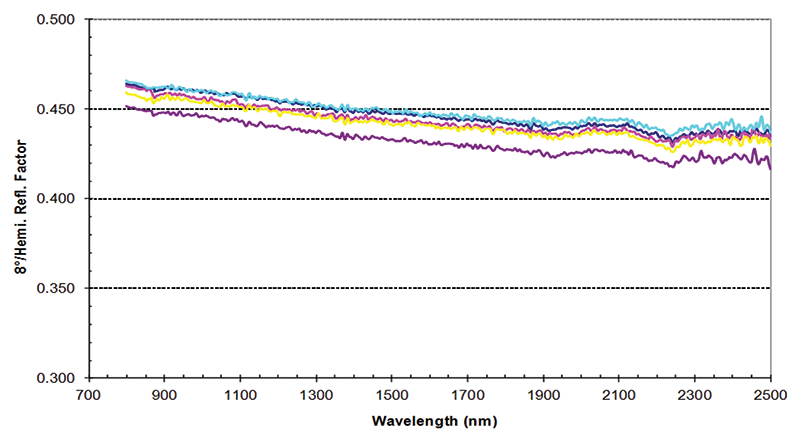
Figure 5: R50 Fluorilon and carbon black mixture as a ~50% reflectance standard; data in Table V. (Spectrum used with permission from Avian Technologies, New London, NH).
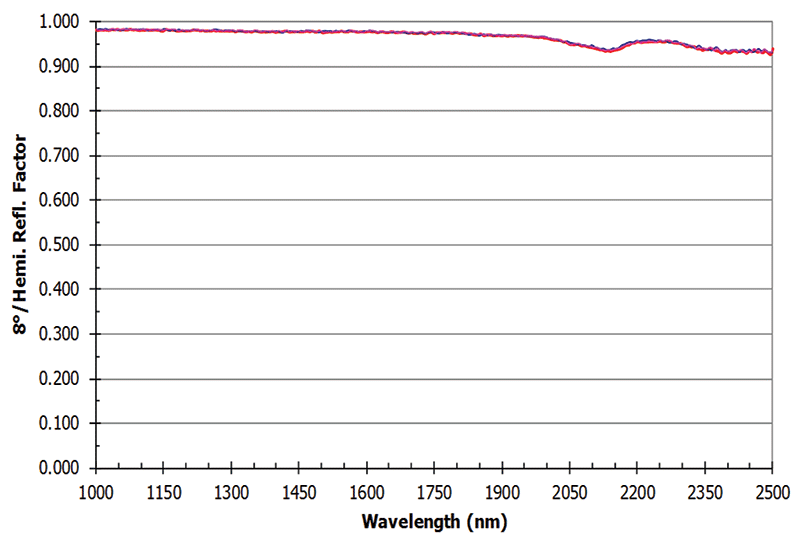
Figure 6: R99 Fluorilon as a ~99% reflectance standard; data in Table VI. (Spectrum used with permission from Avian Technologies, New London, NH).
Infrared (NIR) Reflectance Photometric Standards
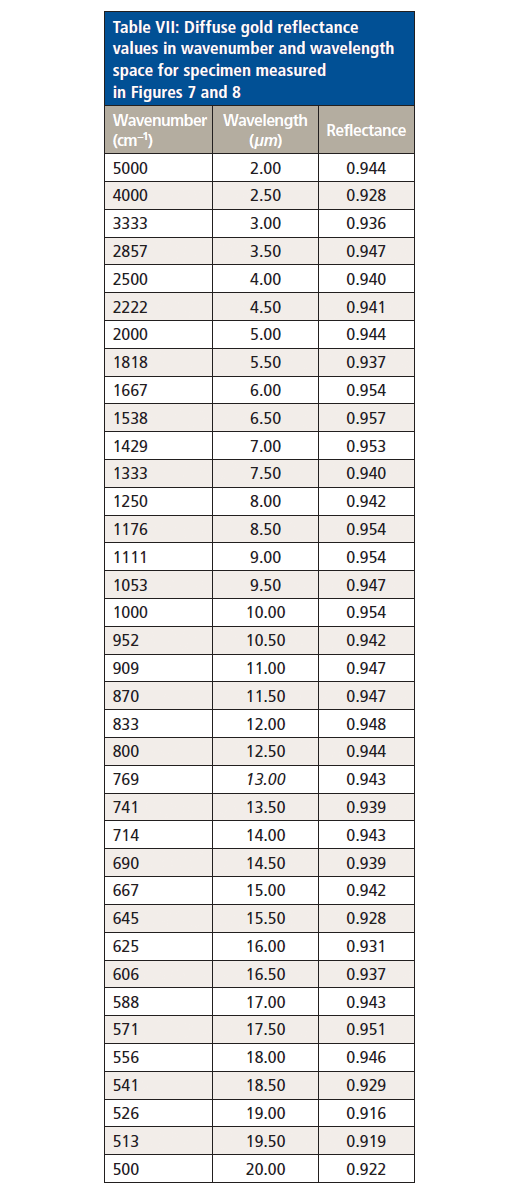
The infrared spectral region is generally considered to be defined as 2500 nm to 25,000 nm (4000 cm-1 to 400 cm-1). Diffuse gold is a primary surface material used for calibrating or verifying reflectance photometric alignment of infrared spectrophotometers. Photometric values for this standard are illustrated in Figures 7-8, and the reference reflectance values are given in the accompanying Table VII. In transmittance measurement mode dry, purged air may be used to calibrate or verify the transmittance accuracy.
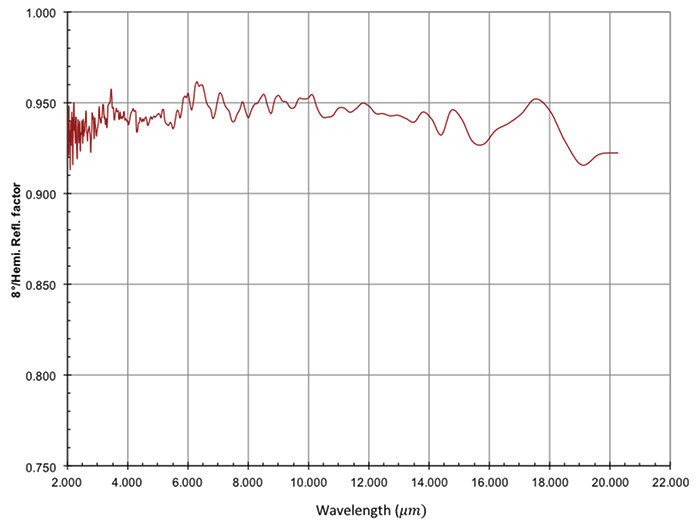
Figure 7: Diffuse gold photometric reflectance standard measured using 8°/hemispherical spectral reflectance factor geometry with a calibrated FT-IR instrument. Mean reflectance over the spectral wavelength region (in micrometers) shown is 0.941. Measured photometric data is given in Table VII. (Data and spectrum used with permission from Avian Technologies, New London, NH).
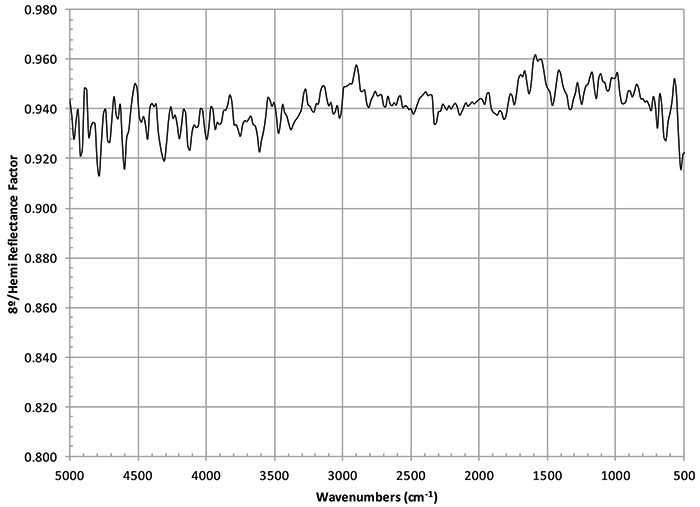
Figure 8: Diffuse gold photometric reflectance standard measured using 8°/hemispherical spectral reflectance factor geometry with a calibrated FT-IR instrument. Mean reflectance over the spectral region (in wavenumbers) shown is 0.941. Measured photometric data is given in Table VII. (Data and spectrum used with permission from Avian Technologies, New London, NH).
Raman Intensity Correction Standards
The Raman spectrum corresponding to the infrared vibrational region includes 4000 cm-1 to 400 cm-1, with Raman spectra referred to as the Stokes shift region defined from 3500 cm-1 to 50 cm-1. A variety of materials are used for calibrating or verifying the intensity scale for Raman spectrometers. Materials for this purpose are listed in Table VIII. Materials noted are provided by NIST.
NIST, previously known as the National Bureau of Standards (NBS), provides materials designed as reference sources to verify the performance characteristics of Raman spectrometers of typical instrument design. The main standards are currently used for intensity standardization. Table VIII lists the typical materials available for Raman intensity calibration. In the case of Raman, there are five active NIST SRMs for measuring Raman intensity, depending upon the excitation laser wavelength used (6–11).
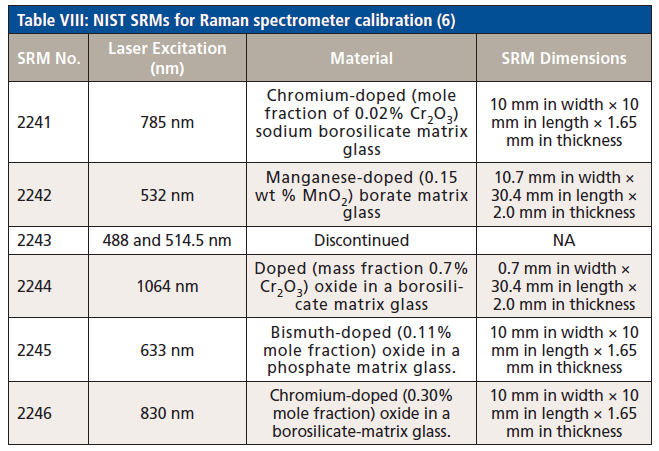
The Raman intensity standards are certified SRMs useful for the correction of the relative intensity of Raman spectra obtained with instruments employing specific laser excitation sources. Individual intensity standards have been provided for Raman excitation wavelengths of 488 nm, 532 nm, 633 nm, 785 nm, 830 nm, and 1064 nm. For these standards, the relative intensity of the glass luminescence has been calibrated at NIST using a uniform- white-light-source, with an integrating sphere collection design. The shape of the mean luminescence spectrum of the SRM glass is described using a polynomial expression for relative spectral intensity versus Raman shift wavenumber (cm-1) based on the specific excitation laser wavelength used (in nanometers).
The spectral correction for any Raman spectrometer is determined by measuring the luminescence spectrum of the SRM, applying the polynomial model, and computing the spectral intensity-response correction for any Raman instrument. The application of the spectral intensity correction eliminates the instrument induced spectral artifacts to provide a more uniform calibrated Raman spectrum.
In order for a Raman spectrometer to be calibrated for intensity the Raman wavenumber axis is corrected using the ASTM E1840-96 protocol (12). The laser excitation is aimed at the frosted surface of the glass, to minimize variation in the scattering response. The intensity correction must be completed over the same Raman shift range as that intended for sample measurement.
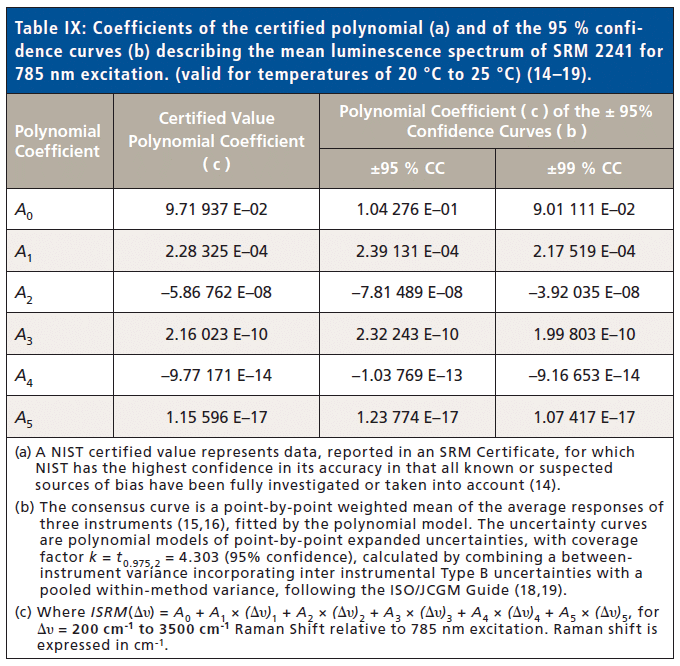
The relative intensity of the measured Raman spectrum of the sample can be corrected for the instrument-specific response by a computational procedure that uses a correction curve. This curve is generated using the certified model and the measured luminescence spectrum of the SRM glass. For the spectral range of certification, Δυ = 200 cm-1 to 3500 cm-1, the elements of the certified relative mean spectral intensity of SRM 2241, ISRM(Δυ), are computed according to equation 14:

where (Δυ) is the wavenumber value in units of Raman shift (cm–1) and the An's are the coefficients listed in Table IX (14–20). The elements of ISRM(Δυ) are obtained by evaluating equation 14 at the same data point spacing used for the acquisition of the luminescence spectrum of the SRM and of the Raman spectrum of the sample. ISRM(Δυ) has been normalized to unity and is a relative unit expressed in terms of photons. The data sets that are the measured glass luminescence spectrum, SSRM, and the measured Raman spectrum of the sample, SMEAS, and are in units of Raman shift (cm–1). The elements of the correction curve ICORR(Δυ), defined by equation 15, are obtained from ISRM(Δυ) and the elements of the glass luminescence spectrum, SSRM(Δυ), by:

The elements of the intensity-corrected Raman spectrum, SCORR(Δυ), are derived by multiplication of the elements of the measured Raman spectrum of the sample, SMEAS(Δυ), by the elements of the correction curve as equation 16 (13).

The certified model, equation 14, is certified for use between 200 cm–1 and 3500 cm–1. The certified model is intended as a simple numerical descriptor of the spectral response observed over the wavenumber range studied. It is not intended as a physically meaningful model. The model coefficients listed in Table IX cannot be used to extrapolate the limits of certification without incurring significant error. Extrapolation of the model outside the certification limits of 200 cm–1 and 3500 cm–1 is not a supported by use of this SRM. This SRM is not intended for use as a standard for the determination of absolute spectral irradiance or radiance.
The equation describing the mean luminescence spectrum of the glass SRM is given in equation 14, where (Δυ) is the wavenumber in units of Raman shift (cm–1). For correction of spectra where the x-axis is in wavelength with units of nanometers, the same model coefficients can be used to calculate ISRM(λ) through the following coordinate transformation as equations 17 and 18:
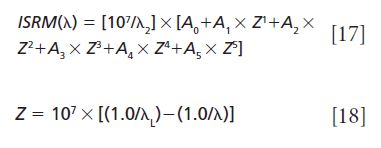
where λL is the wavelength of the laser in nanometers and λ is the spectral wavelength in nanometers. The prefactor of 107 in the first term of equation 17 is needed only if it is desired to preserve the numerical value of spectral areas computed relative to the two x-axis coordinate systems. Definition of this is from reference (7), with the NIST basic application of the intensity standard.
A comprehensive paper describing the complete process of calibrating Raman instruments for intensity using various laser sources and instrument types along with the application of NIST SRMs is given in reference 20 as an Applied Spectroscopy feature article. This paper is recommended for anyone that would practice Raman intensity correction for analytical measurements, and for understanding the details of this process.
References
(1) J. Workman, Jr. and H. Mark, Spectroscopy 34(2), 36–52 (2019).
(2) J. Workman, The Concise Handbook of Analytical Spectroscopy: Physical Foundations, Techniques, Instrumentation and Data Analysis, J. Workman, Ed. (World Scientific Publishing-Imperial College Press, Singapore, 2016). In 5 Volumes, UV, Vis, NIR, IR, and Raman Volumes 1, pp. 163-214; Volume 2, pp. 217-278; Volume 3, pp. 363-424; Volume 4, pp. 323-360; Volume 5, pp. 229-250. ISBN-13: 978-9814508056, 2016). (Permission from NIST for data and spectra related to SRM materials).
(3) Each table refers to specific NIST SRM datasheets and published references and as referred to in reference (2).
(4) Standard Practice for Describing and Measuring Performance of Ultraviolet, Visible, and Near-Infrared Spectrophotometers. American Society for Testing and Materials, ASTM International designation E 275-08(2013), Philadelphia, PA (2013).
(5) Standard Terminology Relating to molecular Spectroscopy; American Society for Testing and Materials, ASTM International designation E 131-10, 2010, Philadelphia, PA (2010).
(6) NIST Raman SRM catalog website: http://nvlpubs.nist.gov/nistpubs/SpecialPublications/NIST.SP.260-176.pdf, pp. 162–163 (accessed Sept. 9, 2017).
(7) Standard Reference Material (SRM) 2241 Certificate, Relative Intensity Correction Standard for Raman Spectroscopy: 785 nm Excitation, National Institute of Standards and Technology, Gaithersburg, MD 20899, 6 pages (28 February 2014).
(8) Standard Reference Material (SRM) 2242 Certificate, Relative Intensity Correction Standard for Raman Spectroscopy: 532 nm Excitation, National Institute of Standards and Technology, Gaithersburg, MD 20899, 6 pages (22 October 2013).
(9) Standard Reference Material (SRM) 2244 Certificate, Relative Intensity Correction Standard for Raman Spectroscopy: 1064 nm Excitation, National Institute of Standards and Technology, Gaithersburg, MD 20899, 6 pages (03 December 2009).
(10) Standard Reference Material (SRM) 2245 Certificate, Relative Intensity Correction Standard for Raman Spectroscopy: 633 nm Excitation, National Institute of Standards and Technology, Gaithersburg, MD 20899, 6 pages (27 September 2011).
(11) Standard Reference Material (SRM) 2246 Certificate, Relative Intensity Correction Standard for Raman Spectroscopy: 830 nm Excitation, National Institute of Standards and Technology, Gaithersburg, MD 20899, 7 pages (31 August 2012).
(12) ASTM E1840-96(2007) Standard Guide for Raman Shift Standards for Spectrometer Calibration (ASTM International, West Conshohocken, Pennsylvania, 2007).
(13) K.J. Frost and R.L. McCreery, Appl. Spectrosc. 52(12), 1614–1618 (1998).
(14) W. May, R. Parris, C. Beck II, J. Fassett, R. Greenberg, F. Guenther, G. Kramer, S. Wise, T. Gills, J. Colbert, R. Gettings, and B. MacDonald, Definition of Terms and Modes Used at NIST for Value-Assignment of Reference Materials for Chemical Measurements; NIST Special Publication 260-136 (2000); http://www.nist.gov/srm/publications.cfm (accessed Sept. 23, 2019).
(15) A.L. Rukhin, Metrologia 46, 323–331 (2009).
(16) R. Dersimonian and N. Laird, Control. Clin. Trials 7(3) 177–188 (1986).
(17) S.D. Horn, R.A. Horn, and D.B. Duncan, J. Am. Stat. Assoc. 70(350), 380–385 (1975).
(18) JCGM 100:2008; Evaluation of Measurement Data - Guide to the Expression of Uncertainty in Measurement (GUM 1995 with Minor Corrections); Joint Committee for Guides in Metrology (2008); http://www.bipm.org/utils/common/documents/jcgm/JCGM_100_2008_E.pdf (accessed Sept. 23, 2019).
(19) B.N. Taylor, C.E. Kuyatt, Guidelines for Evaluating and Expressing the Uncertainty of NIST Measurement Results; NIST Technical Note 1297 (U.S. Government Printing Office: Washington, DC,1994); https://www.nist.gov/pml/nist-technical-note-1297 (accessed Sept. 23, 2019).
(20) S.L. Choquette, E.S. Etz, W.S. Hurst, D.H. Blackburn, and S.D. Leigh, Appl. Spectrosc. 61(2), 117–129 (2007). https://www.nist.gov/publications/relative-intensity-correction-raman-spectrometers-nist-srms-2241-through-2243-785-nm (accessed Sept. 23, 2019).
Jerome Workman Jr.

Jerome Workman Jr. serves on the Editorial Advisory Board of Spectroscopy and is the Senior Technical Editor for LCGC and Spectroscopy. He is also a Certified Core Adjunct Professor at U.S. National University in La Jolla, California. He was formerly the Executive Vice President of Research and Engineering for Unity Scientific and Process Sensors Corporation.
Howard Mark

Howard Mark serves on the Editorial Advisory Board of Spectroscopy, and runs a consulting service, Mark Electronics, in Suffern, New York. Direct correspondence to: SpectroscopyEdit@mmhgroup.com
AI-Powered SERS Spectroscopy Breakthrough Boosts Safety of Medicinal Food Products
April 16th 2025A new deep learning-enhanced spectroscopic platform—SERSome—developed by researchers in China and Finland, identifies medicinal and edible homologs (MEHs) with 98% accuracy. This innovation could revolutionize safety and quality control in the growing MEH market.
New Raman Spectroscopy Method Enhances Real-Time Monitoring Across Fermentation Processes
April 15th 2025Researchers at Delft University of Technology have developed a novel method using single compound spectra to enhance the transferability and accuracy of Raman spectroscopy models for real-time fermentation monitoring.
Nanometer-Scale Studies Using Tip Enhanced Raman Spectroscopy
February 8th 2013Volker Deckert, the winner of the 2013 Charles Mann Award, is advancing the use of tip enhanced Raman spectroscopy (TERS) to push the lateral resolution of vibrational spectroscopy well below the Abbe limit, to achieve single-molecule sensitivity. Because the tip can be moved with sub-nanometer precision, structural information with unmatched spatial resolution can be achieved without the need of specific labels.