2014 Review of Spectroscopic Instrumentation Presented at Pittcon
Our annual review of products introduced at Pittcon.
As we do our annual review of new spectroscopy products presented at Pittcon, it is natural that we also look at how many people attended Pittcon this year, as well as how many companies exhibited there. This year, final attendance (read from the Pittcon website, a somewhat better comparison than using Thursday's figure, as I did last year) was 16,255, compared to the final 2013 attendance, which was 18,197. A breakdown of the attendance by attendee type, and comparison with previous Pittcons is found at the following link: pittcon.org/exhibitor/exhibiting-at-pittcon/#stats. This link seems to change somewhat from year to year, so it's important to keep the pointer up to date. For those who are interested, there are also breakdowns of the attendance by country, and (for the United States) by state.
A somewhat more detailed list of exhibitors is available in an Excel spreadsheet at: pittcon.org/wp-content/uploads/2014/02/Exhibitor-List-2-25-14.xls. From this list we find that there were 946 total companies present. Last year my review claimed 3586 companies; it's well-nigh inconceivable that there should be such a drop from one year to the next. I think it's more likely that last year I made a mistake and reported the total number of booths as the number of companies. Another list, of companies new to Pittcon, is found at the following link: pittcon.org/wp-content/uploads/2014/02/New-Exhibitors-2-24-14.xls. According to these lists, there were 120 of these "newbies."
The number of exhibitors of spectroscopic instrumentation is somewhat difficult to pin down. I compiled my list by using the product locator, and entering the various types of spectroscopic instrumentation, which then caused the product locator to respond with the number of companies found under each category. This is still a far-from-perfect way to count companies, since several of them are included in more than one category, whereas other spectroscopy vendors were not found in any of the categories I searched for using the product locator. Nevertheless, this is the method I used for what I consider the major categories. Here are the results (in alphabetical order):
Accessories: 194
Atomic spectroscopy: 73
Components: 50
Electron spin resonance: 20
Mass spectrometry: 223
Mid-IR: 82
Near-IR: 111
Nuclear magnetic resonance: 59
Raman: 56
Software: 88
UV–vis: 87
X-ray: 44
Of course, this listing contains far too many companies for me to visit them all. I was able to contact and get information from only a small fraction of the companies listed above. I can only hope that I didn't miss the ones with the most worthwhile new offerings.
It is exciting to see that all of the winners of the Pittcon Editors' Awards were spectroscopically related: the Gold Medal award was given to Texas Instruments for its DLP Spectroscopic chipset; the Silver Medal was awarded to Waters for the Acquity QDa mass detector; and the Bronze went to AB Sciex for the CESI-8000 ESI module. Congratulations to all the winners!
Over the years, long-time attendees note the arrival and departure of trends (or maybe even "fashions") in the instruments and booths seen. Last year we noted that with the advent of smartphones and tablet computers, the "computer" as such is also starting to disappear in favor of "smart" devices, where all the electronics, for both sensing and control, are contained within the sensor. This was, perhaps, more evident at some of the technical sessions than on the exhibit floor, but the signs point to that changeover coming. Some companies, while not using actual cell phones, are definitely migrating to cell phone–sized devices, at least as controllers, if not actually incorporating the entire instrument.
Although the latest technology makes it "easy" to create a cell phone–sized instrument, what's not so easy, perhaps, is to make one that will have specifications that are competitive with their larger cousins in terms of: sensitivity, signal-to-noise, analytical performance, and more. So, while there is reason to be optimistic, we won't know what the future holds until it arrives. Meanwhile, we're not quite there yet.
A possible replacement paradigm for the shrinking size of instruments is the shrinking size of samples. Chemists have always been interested in measuring micrograms or nanograms of analyte, or even less. However, those have always been because of low concentrations of analyte in a larger sample. While there are too few to claim a "trend" yet, I noticed a few companies talking about measuring "sub-drop" samples, or sample sizes measuring a small integer number of microliters of sample (presumably containing a medium-to-low concentration of analyte). We'll keep an eye open for this in the future. This year, Drop Technology and Harrick showed devices that fell into that category.
This year we continue the splitting of the review between the hard copy version and the on-line version, which will be accessible at spectroscopyonline.com/Pittcon2014. In this hardcopy version of the review, all products are listed in a summarized fashion in the tables, which highlight key applications, features, and benefits. The on-line version includes a series of appendices that include more detail about each product.
As usual, I organized this review according to the wavelength region and type of spectroscopy involved (for example, mid-IR, X-ray, UV–vis, Raman, and so on). We tried to arrange it so as to allow the readers to more easily compare instruments from different manufacturers, even though it may sometimes lump together instruments of the "good enough is OK" type, with ultraprecise laboratory designs.
The categories we used in this review to classify the instruments (in alphabetical order) are
Accessories
Atomic spectroscopy
Components
Mass spectrometry
Mid-IR
NIR
NMR
Raman
Software
UV–visible
X-ray (which includes all shorter-wavelength methods, if present)
Also as usual, it is inevitable that some categories include products from companies that might arguably also be classified under one of the other categories. These categories are accessories, components, and software. For example, for "hyphenated" techniques, such as inductively coupled plasma–mass spectrometry (ICP-MS), the reader may need to check either category (at least one ICP-MS instrument is included under atomic spectroscopy). I try to be consistent, but can't guarantee perfection. Thus, if a product is not found in an expected category, others should be checked. If you know the name of a company you want to find, look in Table I, which will tell you under what heading you will find it. Some companies with products based on any of multiple technologies will have multiple entries.

Table I: Index of companies mentioned in this article
We also endeavored to give a synopsis of salient features for each product, or at least as much as could be included in limited space. We follow a "features–benefit" format, so that not only are the key features of a given instrument described, but also the meaningfulness of those features to the user.
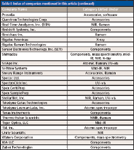
Table I: Index of companies mentioned in this article (continued)
It is also important to keep in mind that while our review focuses primarily on new products introduced at Pittcon, we also include coverage of products introduced at other events (or not even linked to a show) since last year's Pittcon coverage. That means that what follows is a listing of important new products introduced over the past year.
ACCESSORIES
As usual, accessories includes a wide range of products. This is a result of the fact that an "accessory" can be an adjunct to any type of spectrometer. Thus, in addition to optical spectrometers, which themselves cover a wide range of wavelengths (X-rays to terahertz and microwaves with each wavelength range having their own particular needs both because of the physics involved and the sample types measured). There are also nonoptical spectrometers (mass spectrometers, nuclear magnetic resonance [NMR] spectrometers, electron spin resonance [ESR] spectrometers, and so on). There are also innumerable ways an instrument's operation can be enhanced. As was present last year, and noted in the general introduction, the ability to measure small samples seems to be a growing area. Drop Technology, for example, provides a unique interface for handling and measuring samples of 1–4 μL without enclosing the sample in a cell. They also provide a complete instrument incorporating this capability (see the UV–vis section of this review).
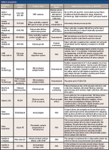
Table II: Accessories
Certainly those products that won the Editors' Awards deserve to be noted here. We did so in the general introduction, but it is sometimes difficult to decide whether a given product qualifies as an accessory or a component, a quandary we discuss elsewhere. It is interesting to note, that this year, all Editors' Award winners are components or accessories, none of them represent entire instruments. Although I make the final decision of where to insert a given company's product according to my own rules, products that are especially noteworthy (Texas instruments' DLP chipset, Waters's Acquity QDa mass detector, and AB Sciex's CESI-8000 ESI module) could legitimately be mentioned in both places.
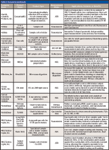
Table II: Accessories (continued)
Every company listed here had a new product or capability on exhibit at Pittcon, and these are all noteworthy. Many of them involve improvements to the optics. Andor Technology had a deep-depletion detector for their NIR cameras. Axiom showed extensions of measurement capability for mid-IR, near-IR, and Raman probes including extended length and extended temperature and pressure capability. FiberTech Optica presented a probe incorporating integral optical filters. Harrick had a multiple-reflection attenuated total reflectance (ATR) accessory that can measure samples in the 2–20 μL range. Metrohm showed a trans-reflectance accessory kit for their near-infrared (NIR) instruments, enabling measurement of heterogeneous samples. Oxford showed a new X-ray camera. Snowy Range had a new immersion Raman probe. International Crystal Laboratories had an F/matching optics, purgeable fixture for long-path cells.
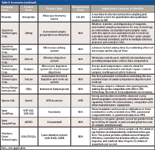
Table II: Accessories (continued)
Improvements to characteristics other than optics often have to do with sample handling. Gasera showed a specialized photoacoustic detector for detecting cocaine in hair (this really fits in both optical and nonoptical categories). Glass Expansion had automated precision syringes and other sample introduction devices. Microsaic showed a real-time mass detection kit for monitoring on- and off-line reactions. PIKE had long-path gas cells, a specialized sample collector for DNA, RNA, and protein and a sealed ATR accessory. Prosolia had a real-time in situ microextraction sampling and ionization source for quantitative and qualitative analysis by mass spectrometry (MS). Questron showed an automated sample preparation workstation.
A "miscellaneous" category is also needed. Inorganic Ventures had a new line of standards, useful for calibrating all types of instruments. Milestone had automated microwave digestion, which allows mixed sample types to be handled. Spex CertiPrep offered new calibration and check-sample standards conforming to United States Pharmacopeia (USP) specifications. Ocean Optics provided a wide-band light source. Finally, Teledyne-Cetac had an improved laser-ablation sample preparation system.
ATOMIC SPECTROSCOPY
When I was in school, atomic spectroscopy included what we now call the "UV–vis" techniques because the method classification back then was based on the physics of interaction, which involved the atomic orbitals of the analyte electrons. Since those days, UV–vis has been separated and this distinction is more nearly based on whether the analyte concentration is measured as absorption (for example, in a cell) or in some cousin of "free space." Hence, the techniques used determine the classification, atomic spectroscopy includes atomic emission spectroscopy (AES) or optical emission spectroscopy (OES), atomic absorption (AA), or some other high-energy source of photons. One of the newest members to this family is laser-induced breakdown spectroscopy (LIBS), wherein a high-energy laser pulse both evaporates (or ablates) the surface of the sample and provides the energy needed to ionize the resulting plasma, and recombination of the gaseous ions then provides the photons that can be analyzed to determine both the nature and concentrations of the species present. This is almost akin to the old arc-spark emission instruments of yore, where making a measurement sounded like being in the middle of a thunderstorm. Ah, those were the days!
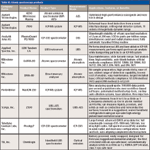
Table III: Atomic spectroscopy products
Lately, the analytical world has become much tamer. Open high-voltage sparks are replaced with enclosed lamps serving as sources, and electronically controlled ionization chambers (ICP and microwave plasma [MP]) give much better control over the sources both for ions and photons. Progress consists of continual improvements of basic technologies, and borrowing concepts from related fields; for example, using waveguides to bring microwaves to where they are needed, an analogy to the use of fiber optics in optical-frequency technology.
COMPONENTS
As a category, components is as varied as accessories. Different products have different characteristics that are applicable to that type of product. These listings, therefore should consider each manufacturer's products on their own merits, and no attempt should be made to compare different manufacturers' products when they're based on different criteria.

Table IV: Components
So, what's the difference between a component and an accessory? I say this every year, but it still needs to be repeated: In my mind, and more importantly in my usage and classification of products, a component is something that can be used in the construction of an instrument and becomes an inherent part of it; if it's not there then the instrument will not work, or at least will be severely degraded. An accessory is a device that can be used optionally in conjunction with an instrument and is generally external to it; the instrument will work just fine without it, but the accessory extends the capabilities (a liquid f low cell for an instrument innately designed to measure solid samples, for example). The accessory can be removed to return the instrument to it's previous performance level, whereas a component generally cannot be removed except by a factory-trained expert.
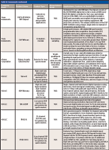
Table IV: Components (continued)
As noted in the general introduction, all of the Editors' Awards this year are for accessories and components, and none were for complete instruments. Two of those products were discussed in the accessories section. The third Editors' Award is presented here: Waters's Acquity QDa mass spectrometry detector.
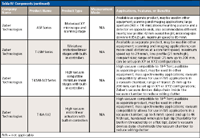
Table IV: Components (continued)
MASS SPECTROMETRY
This category of instrumentation is probably one of the best examples of how, even within a single category of instrument, different design choices lead to instruments with different characteristics. The variety of different technologies to distinguish ions of different masses contributes to this variety of instruments.
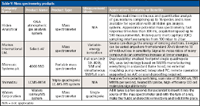
Table V: Mass spectrometry products
Furthermore, the last few years has seen the growth of what have come to be called hyphenated techniques such as gas chromatography–mass spectrometry (GC–MS) and high performance liquid chromatography–mass spectrometry (HPLC–MS). Although an occasional hyphenated instrument is seen that is based on a technique, such as GC coupled to infrared (IR), almost invariably one of the techniques involved in the hyphenation is MS. This is because of the extremely sensitive nature of the mass spectrometer as a detector for chromatography; at the limit, a mass spectrometer can be sensitive to sample quantities as small as just a few ions. This has made MS a popular technique, although that may not be evident from the listings here. That is because several manufacturers chose to promote individual parts of the instrument and list, for example, their latest quadrupole detector under components, rather than including the whole instrument here, in the mass spectrometry section. An example of this is Waters, who did both: the company listed its mass spectrometer here, and also submitted its Editors' Award–winning mass detector, which can be found in the components section.
Other manufacturers are promoting their instruments, and also emphasize one particular aspect or another. Hiden, for example, was promoting its continuous-measurement capability. Markes International can dynamically vary the energy of the ionizing electrons in its ion source. Microsaic Systems was vying for the lead in a small-package MS, and by dispensing with the need for a roughing pump, enter this race with a complete system that can fit in a fume hood. Shimadzu displayed an entry in a different race: one for the fastest mass-spectral acquisition, with an instrument that can measure spectra at a speed of 30,000 u/s. In addition to promoting its mass detector, Waters was emphasizing the ease of switching between measurement modes.
MID-INFRARED (MID-IR)
Mid-IR spectrometers (for which Fourier transform infrared spectroscopy [FT-IR] is a commonly used synonym) do not tout the "specsmanship" (which we eschew in this review, anyway) of their underlying technological "engines." Wavelength scales for all instruments are controlled by laser-fringe-referencing, and the noise characteristics are limited by the detector-noise characteristics of their sensors. Not that all instruments are the same, by any means! Different design decisions on the part of the manufacturer still leave users with a variety of choices. Some manufacturers concentrate on variations in the basic instrument, others on new ways to measure difficult samples. Agilent presented a handheld instrument designed to measure samples in situ. Anasys promoted the highest spatial resolution instrument. Bruker combined a mid-IR and NIR detector with a wide-band beamsplitter in its interferometer to enable simultaneous measurements in both spectral regions. Daylight Solutions had a wide-field, high-spectral-resolution instrument, and reduced data collection requirements (while undoubtedly speeding up the measurement process) by collecting sparse wavelength sets (as compared to collecting and storing full spectra for each sample). Jasco had enhanced the signal-to-noise ratio of its IR microscope with associated video capability. Si-Ware Systems offered a single-chip MEMS-based modular architecture Michaelson interferometer, enabling the world's smallest, most rugged, and lowest price FT-IR spectrometer. Tiger Optics was offering another new technology not commonly seen at Pittcon: cavity ring-down spectroscopy. Multiple models were presented, based on different advantages of the technology — for example, a detector based on the high sensitivity capability for narrow wavelength ranges is exploited in one instrument model for measuring CO in process streams at parts-per-million levels.
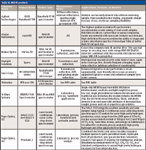
Table VI: Mid-IR products
NIR
The general trend, which has been growing slowly, is for manufacturers to provide instruments precalibrated for the commodities, and the analytes in those commodities, that their customers want to measure. This approach removes one of the biggest blockages to selling NIR instrumentation: the need for a new or old customer that wants to expand the applicability of their existing instrumentation to new products and analyses. This ability permits users to widen the range of analyses they can apply to their instrument and do so at little extra cost. Thus, rather than hardware enhancements, we are seeing more and more of the sets of calibration models that manufacturers can supply to users. Sometimes this is in conjunction with extra algorithmic capabilities, but often it is simply adjunct to the algorithms already available. Of course, there are often extensions and enhancements to the algorithms themselves, as well. And there is still room for improvements to the hardware, as well as extensions (as with mid-IR) to the sample handling and sample presentation capabilities.
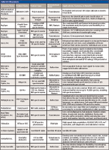
Table VII: NIR products
ABB Analytical provided calibration models for OH value in polyols. BaySpec provided improvements in different aspects of several of their instruments: A software improvement allows for improved identification in industrial inspection and medical diagnosis; a hardware transformation allows another instrument to be used to measure Raman or NIR spectra; and a third instrument can cover both the visible and NIR spectral region. Guided Wave expanded its instrumentation to 12 measurement channels. Jasco improved its spectral resolution as well as the signal-to-noise ratio in their instrument. JDSU increased the spectral range of its miniature detector or instrument and adapted it to point-of-use analysis. Metrohm made its instrument hot-swappable and combined the NIR instrumentation with an automated Karl-Fischer instrument to provide a unique system. Ocean Optics improved its optical and electronic capabilities; the company offers high-speed, high sensitivity, fast, and precise color measurements, while providing spectral buffer for 15,000 spectra, measured with an 18 bit A/D converter. PANalytical offered a near-UV through NIR self-contained instrument for geological field applications. PerkinElmer has new sampling devices and algorithms intended to detect adulterants in milk. Real-Time Analyzers presented a multicomponent fuel analyzer. Shimadzu has high resolution in conjunction with high signal-to-noise ratio and high-speed data acquisition. Stellar-Net offered a system that enables users to develop their own custom analyzers. Unity redesigned its top window for flexibility in packaging and also offers the calibration package for custom applications.
NMR
NMR spectroscopy has not been prominent at Pittcon for several years. Indeed, in some years my general scouting of the exhibit floor did not bring me to any manufacturers of NMR instruments. This year I made a special effort to locate manufacturers of those instruments, and was rewarded by finding about a half-dozen of them. Disappointingly, however, only two of those manufacturers submitted information about their products for this review. One big change from the NMR instrumentation I was used to seeing (while not universal) was a decrease in size (at least from some manufacturers) comparable to the size decreases seen in other technologies. I have to admit that I was most surprised when I came to the Nanalysis booth, which seemed to be empty of an instrument until I asked a salesman in the booth about it, whereupon he pointed to a small, breadbox-sized cabinet sitting on the table. I asked him what it was. "That's it," he replied. I have to admit I was nearly floored, until I realized that if they could remove the magnet from an MS instrument and reduce the size by an order of magnitude, why not do that for an NMR instrument as well? Of course for NMR the magnet could not be completely removed. However, advances in magnet technology have enabled replacing the huge electromagnets of yesteryear with (relatively) small, permanent magnets with suitable characteristics (uniformity) to allow the NMR measurement.

Table VIII: NMR products
RAMAN
The continually changing computer revolution continues to make it's way into the instrument world. Miniaturization is seen here in more than one way. As with NIR, just about every manufacturer provides at least one model that is portable, transportable, or handheld, although users need to decide for themselves exactly what they consider falls into each category — that's the reason we ask them to include the size and weight information.
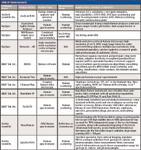
Table IX: Raman products
Just as IR spectroscopy has developed branches reflecting specialized measurement methods (such as ATR), so, too has Raman spectroscopy. While all Raman spectroscopy depends on the same underlying physics of the Raman effect, it has branched off into several sub-techniques including: confocal Raman, surface-enhanced Raman spectroscopy (SERS), and others. All of these variations are included under the umbrella of Raman spectroscopy in this review, along with evolutionary advances in the instrumentation (improved resolution, better signal-to-noise ratios, and more) as well as instruments that merge the Raman measurement with another type of measurement, in the same instrument. Accutech Scientific presented ultrafast measurement this year. BaySpec promoted a dual-wavelength Raman analyzer, along with a confocal Raman microscope and a combined Raman and NIR instrument. B&W Tek presented an extensive software suite, a high-performance "smart" Raman spectrometer, a spectrometer using "Cleanlaze" technology, a flexible fiber probe, and a field-ready handheld instrument. Horiba has a combined Raman–atomic force microscopy (AFM) instrument. Jasco provided automated laser and grating switching, in a high-performance instrument. Ocean Optics offered raster orbital scanning (ROS) technology to measure spectra in less than 9 s, while obtaining visual confirmation of results. Polytec has a rugged on-line system using holographic three-dimensional (3D) transmission gratings. Real-Time Analyzers provided a fuel analyzer that can classify the fuel and analyze it for multiple constituents. Renishaw provided very-high-speed imaging with its StreamLineHR capability. Rigaku has new software that provides identification at the point of receipt, for raw materials. SciAps used a short-wave (SWIR) laser in a handheld instrument that avoids cross contamination between samples. Snowy Range avoided fluorescence with a combination of techniques that suppresses fluorescence and enhances the ability to identify difficult samples. Stellarnet attached a vial holder to the front of the laser, requiring the user only to put a vial in the vial holder. Finally, Thermo provided new software that can identify defects and confirm product quality in pharmaceutical formulations.

Table IX: Raman products (continued)
SOFTWARE
Software, in the context of this review, consists of several different, albeit related, types of products. The first, and arguably the main type, consists of actual programs: the sequences of instructions that computers use to carry out their functions. The second type of product consists of various types of data. One important subcategory of this consists of actual databases, sets of related data that can be used in a manner similar to dictionaries or encyclopedias. A third type of product that we would include under this heading is somewhat related to the fact that spectroscopy is heavily dependent on chemometric algorithms: This software, therefore, consists of the models or collections of models (that is, a database of models) that can be used by the chemometrics algorithms to analyze future samples. This last category tends to be promoted by instrument manufacturers to further their interest in selling instruments without requiring users to calibrate them.
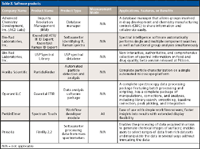
Table X: Software products
Advanced Chemistry Development provided a software package that implements a database manager that promotes collaboration within groups responsible for drug development. Bio-Rad Laboratories provided a chemometrics package that enables identification of materials based on their spectra, and also a spectral library that could be used in conjunction with this software. Horiba provided a software package that can perform complete particle characterization from microscope images. Operant provided a data analysis package that enables the user to specify the sequence of operations to be used in postprocessing spectral data. PerkinElmer provided a workflow manager that features ease of use and greater flexibility with simple workflow screens. Prosolia had software that enables the processing of data acquired in arrays (for example, from scanners) to generate chemical images of surfaces.
TERAHERTZ
While several companies have been actively promoting terahertz spectroscopy (such as in advertisements), only one chose to submit their product information for this review. Advantest America has submitted two products; one a lower-cost spectrometer and the other having several "bells and whistles." In this case, the "bells and whistles" are pretty substantive, but you'll have to examine the extended on-line version of the review to read about what they all are.

Table XI: Terahertz products
UV–VIS
This type of instrument is, arguably, among the oldest and, therefore, is presumably the most mature of the common spectroscopic technologies. Nevertheless, with the advent of new types of sources (lasers), detectors (semiconductors and arrays), different types of samples to be analyzed, and so on, there's still lots of room for development in these areas.
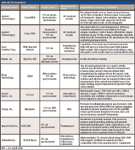
Table XII: UV-vis products
Agilent offered prealigned light sources, autosamplers, and various kinds of cells and cell holders. Areo Creative had small and lightweight instruments with high efficiency and accurate special measurements. Distek showed a dissolution tester with an integral probe. Drop Technology had a method of using an unenclosed droplet as the sample and the means to measure analyte concentration in that sample. Ocean Optics had a small, lightweight, low-cost spectrometer with spectral resolution, noise, and stability equivalent to much larger and more expensive instruments. SciAps had a spectrometer that covers 350–2500 nm in a robust, field-hardened case. Spectro-click had a portable, USB-powered, grating arrangement that exploits high pixel count, in an eight-bit color camera with three orders of magnitude dynamic range. Stellarnet had a high-performance ruggedized spectrometer enclosure with a fiber-optic input covering 190–1110 nm wavelengths.
X-RAY
This is the first year we've had a product to detect and measure radiation shorter than X-rays. S.E. International provided a gamma-ray detection system. Amptek provided a kit to help new users quickly learn to use X-ray fluorescence to do analysis, as well as a new high-performance silicon-drift detector. EDAX promoted its X-ray electron backscatter diffraction spectrometer with an upgraded camera, as well as a high-performance silicon drift detector, and its software package to deconvolve spectral peaks. IXRF had a new sampling wheel with spaces for 12 samples, and a micro X-ray fluorescence (XRF) system with the smallest spot size capability for the largest samples. PANalytical offered guaranteed out-of-the-box analytical performance. Rigaku promoted measurement of ultralow levels of sulfur using wavelength-dispersive XRF (WDXRF). Shimadzu had an energy-dispersive XRF (EDXRF) instrument with a high fluorescent X-ray count per unit time; and an electronically cooled detector that does not require liquid nitrogen
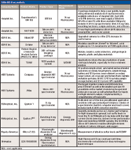
Table XIII: X-ray products
APPENDIXES ON-LINE
Additional product details appear online in the appendixes, at www.spectroscopyonline.com/Pittcon2014:
Appendix I: Accessories Appendix I: Accessories
Appendix II: Atomic spectroscopy Appendix II
Appendix III: Components Appendix III
Appendix IV: Mass spectrometry Appendix IV:
Appendix V: Mid-IR (FT-IR) Appendix V:
Appendix VI: NIR Appendix VI: NIR
Appendix VII: NMR Appendix VII: NMR
Appendix VIII: Raman Appendix VIII: Raman
Appendix IX: Software Appendix IX: Software
Appendix X: Terahertz Appendix X: Terahertz
Appendix XI: UV–vis Appendix XI: UV-vis
Howard Mark serves on the Editorial Advisory Board of Spectroscopy and is a regular coauthor of the "Chemometrics in Spectroscopy" column. He also runs a consulting service, Mark Electronics in Suffern, New York. He can be reached at hlmark@nearinfrared.com
New Raman Spectroscopy Method Enhances Real-Time Monitoring Across Fermentation Processes
April 15th 2025Researchers at Delft University of Technology have developed a novel method using single compound spectra to enhance the transferability and accuracy of Raman spectroscopy models for real-time fermentation monitoring.
New Multi-Spectroscopic System Enhances Cultural Heritage Analysis
April 2nd 2025A new study published in Talanta introduces SYSPECTRAL, a portable multi-spectroscopic system that can conduct non-invasive, in situ chemical analysis of cultural heritage materials by integrating LIBS, LIF, Raman, and reflectance spectroscopy into a single compact device.