A Facile Synthesis of Tannic Acid–Protected Copper Nanoclusters and the Sensitive Fluorescence Detection of Nitrite Ion Under Mild Conditions
Nitrite poses a serious health risk because it is often present in drinking water, foods, biological systems, and agricultural products, and also acts as an environmental reagent for the production of highly carcinogenic N-nitrosamines upon interaction with proteins. Under mild conditions, tannic acid-protected fluorescence copper nanoclusters (TA-CuNCs) were found to be exclusively quenched in the presence of nitrite ions, and exhibited a good linear relationship with fluorescence intensity with a nitrite concentration within a 20–100 μM concentration window and a limit of detection of 40 nM. In addition, the mechanism associated with the sensitive fluorescence quenching response of nitrite with TA-CuNCs is discussed. The nanoprobe was used to detect nitrite in sausage, and the results were consistent with those obtained using UV-vis spectroscopy, which confirmed that the proposed method can be a rapid and reliable technique for detecting nitrite residues in real samples.
Nitrite represents a serious health-risk factor that often appears in biological, food, and environmental samples (1,2). Nitrite, in the form of sodium nitrite, is often added to meat products to maintain the red color and flavor of fresh meat while providing protection against microorganisms (3,4). The U.S. Environmental Protection Agency (EPA) defines the maximum levels of nitrite in drinking water and meat products to be 1 and 200 ppm, respectively (5). Nitrite is also one of the stable metabolites of nitric oxide, which is a messenger molecule involved in the regulation of numerous physiological and biological processes (6). Therefore, the illegal addition of nitrite to meat products and its potential harm to human health prompt the need for its sensitive detection, especially in commercial meat products. Therefore, a facile, effective, cost-effective, and sensitive method for nitrite detection needs to be developed urgently.
Various analytical methods, including chromatography (7,8), differential pulse voltammetry (9), capillary electrophoresis (10), electrochemical methods (11), and chemiluminescence methods (12), have been reported for nitrite detection. However, most of these methods are time-consuming or use toxic and environmentally unfriendly organic agents. Some of these analytical methods also require an elaborate detection process. To overcome these disadvantages, many organic molecules have been synthesized for use as fluorescent probes for sensitive nitrite detection (13,14). For example, noble metal (silver and gold) nanoclusters have been developed for trace determining of nitrite (15,16). Among the aforementioned techniques, fluorescence is well-suited, because of its sensitivity and simplicity. The fluorescence technique also satisfies the requirements of rapid nitrite screening.
Copper nanoclusters not only share similar characteristics with noble metal nanoclusters, such as fluorescence properties, particle size, and biocompatibility, but they are also inexpensive and stable (17–19). As a result, copper nanoclusters offer great potential as a nitrite-detection method that can potentially be superior to the current method of using noble metal nanoclusters (20–22). In particular, tannic acid-coated copper nanoclusters (TA-CuNCs) have attracted extensive scientific and technological interest because of their molecule-like properties, such as luminescence and unique charging properties (23,24). In this study, TA-CuNCs have been evaluated as fluorescent probes for nitrite detection and shown to possess novel and sensitive detection characteristics over a broad range of pH levels. The sensor, based on TA-CuNCs, was used to detect nitrite in commercially available sausage, illustrating potential practical applications.
Materials and Methods
Materials
Tannic acid was obtained from Sigma Aldrich. Sodium nitrite (NaNO2) was acquired from Beijing Chemical Co. All other chemicals agents were used directly. The water was purified through a Millipore purification system.
Instrumentation and Spectroscopy
Fluorescence spectra were collected using a Shimadzu RF-5301PC fluorescence spectrophotometer. The excitation wavelengths were 360 nm for CuNCs.
UV-vis Spectroscopy Measurements
UV-vis measurements were made on a Shimadzu UV-3600 spectrophotometer with 1 cm × 1 cm quartz cuvettes (4 mL volume) to determine nitrite content at a 520 nm wavelength. A simulated gastric fluid was mixed with NaCl and HCl. Then, 2 mL of 5 μg/mL sodium nitrite solution was added to 25 mL of simulated gastric fluid, and the mixture was incubated at 37 °C for 30 min. Afterwards, 2 mL of 0.4% sulfanilic acid and 1 mL of 0.2% naphthylamine were added to the mixture, which was then incubated at room temperature. The final volume of each mixture was adjusted to 50 mL.
Preparation of CuNCs
Aqueous CuSO4 (0.2 mL, 0.1 M) and tannic acid solution (0.1 mL, 1 mM) with 20 mL water was stirred at room temperature. After 5 min, ascorbic acid solution (0.2 mL, 1 M) was added, and the mixture was incubated at 50 °C for 6 h. To remove all unreacted impurity, the product was extensively dialyzed against ultra-pure water for more than 24 h using a 3500 Da dialysis membrane, and the TA-CuNCs were freeze-dried to powder.
Nitrite-Extraction Procedure
The extraction and clean-up procedure for nitrite in sausage was slightly modified from the previously reported investigation (25). For this procedure, a sausage sample (~25 to 50 g) was minced with a grinder and homogenized in a laboratory mixer for 3–5 min. Then, a 5 g portion was removed and extracted with saturated borax solution. Potassium ferrocyanide solution and zinc acetate solution were added to precipitate the protein, followed by 10 min of heating in a boiling water bath. The supernatant was then decanted and placed in another container.
Results and Discussion
Spectral Characteristics of TA-CuNCs
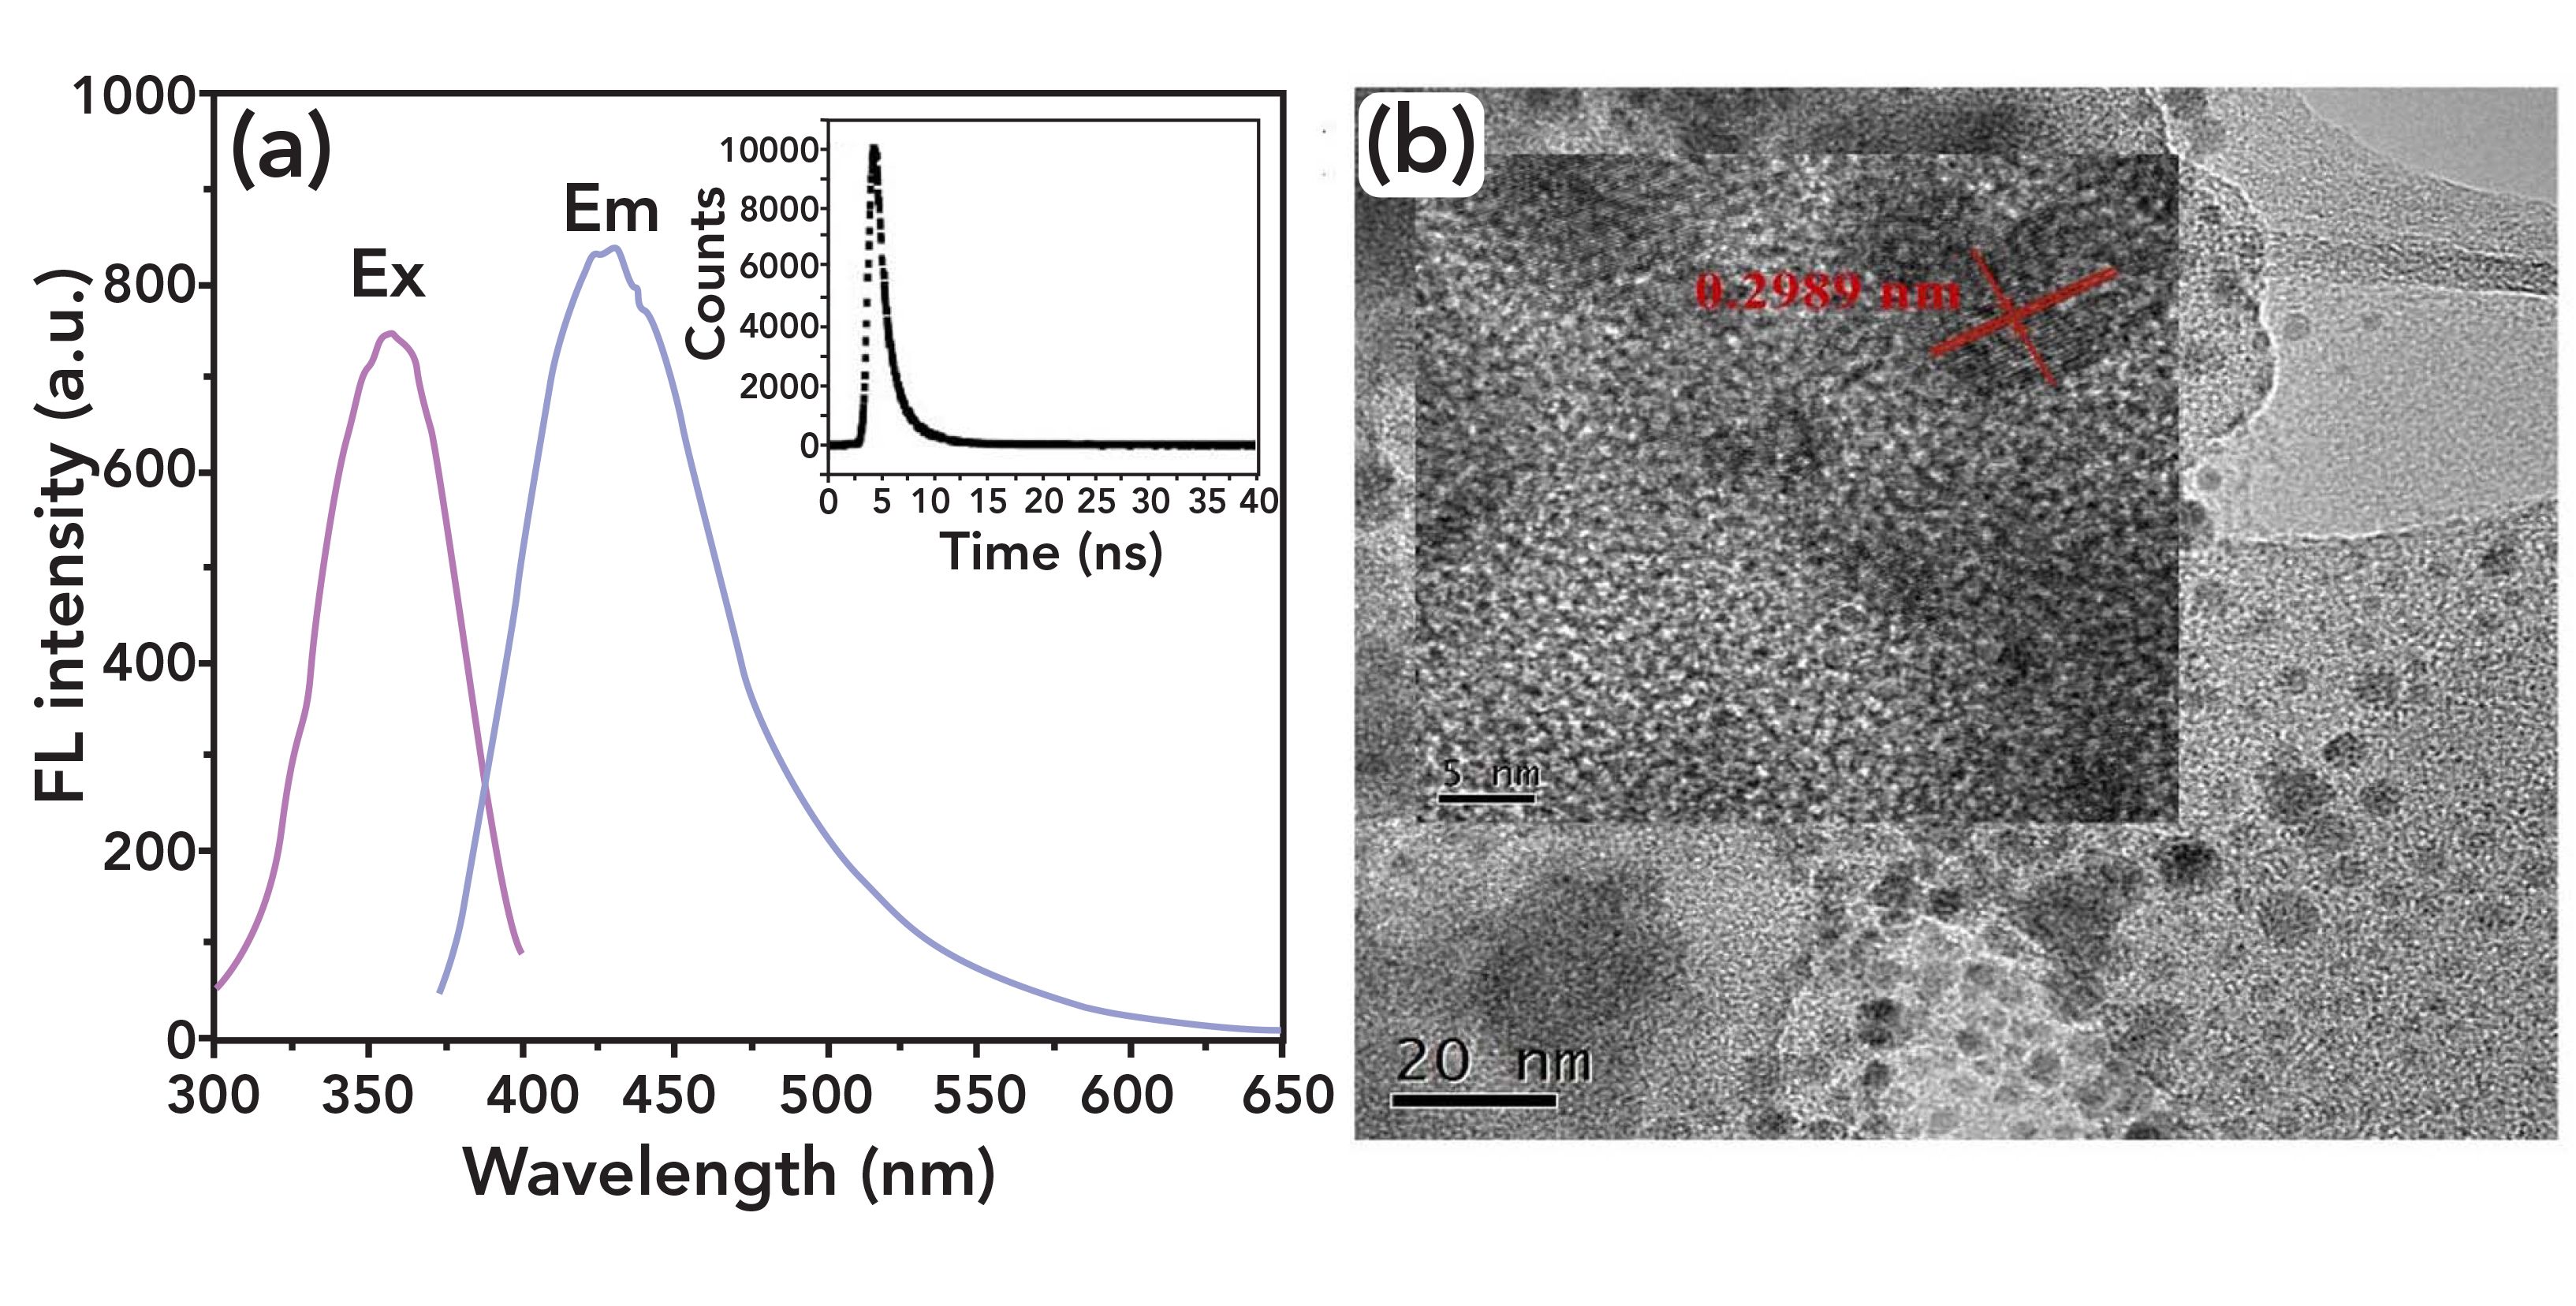
CuNCs were stabilized with TA according to a previously described method (26). The optical properties of the TA-CuNCs were characterized by fluorescence and transmission electron microscopy (TEM). Figure 1a shows that at 360 nm excitation, the fluorescence spectrum of TA-CuNCs shows a strong band at 430 nm. As indicated from the inset of Figure 1a, the fluorescence lifetime of TA-CuNCs was 2.77 ns. The copper nanoclusters were highly dispersible and nearly spherical in shape with an average size of 2.3 nm (Figure 1b). The inset of Figure 1b suggests that the lattice fringes of the products are consistent with metallic copper and have a discerned lattice spacing of approximately 0.2989 nm. All these results suggest that the successful preparation of TA-CuNCs were consistent with the previous reports (27).
FIGURE 1: (a) Fluorescence excitation and emission spectra of TA-CuNCs; inset is the fluorescence lifetime of TA-CuNCs. (b) Photographs of TA-CuNCs in an aqueous solution under UV-vis light; inset is the transmission electron microscope (TEM) image of TA-CuNCs, showing single-magnified CuNCs.
Optimization of Conditions for Detecting Sodium Nitrite Using TA-CuNCs
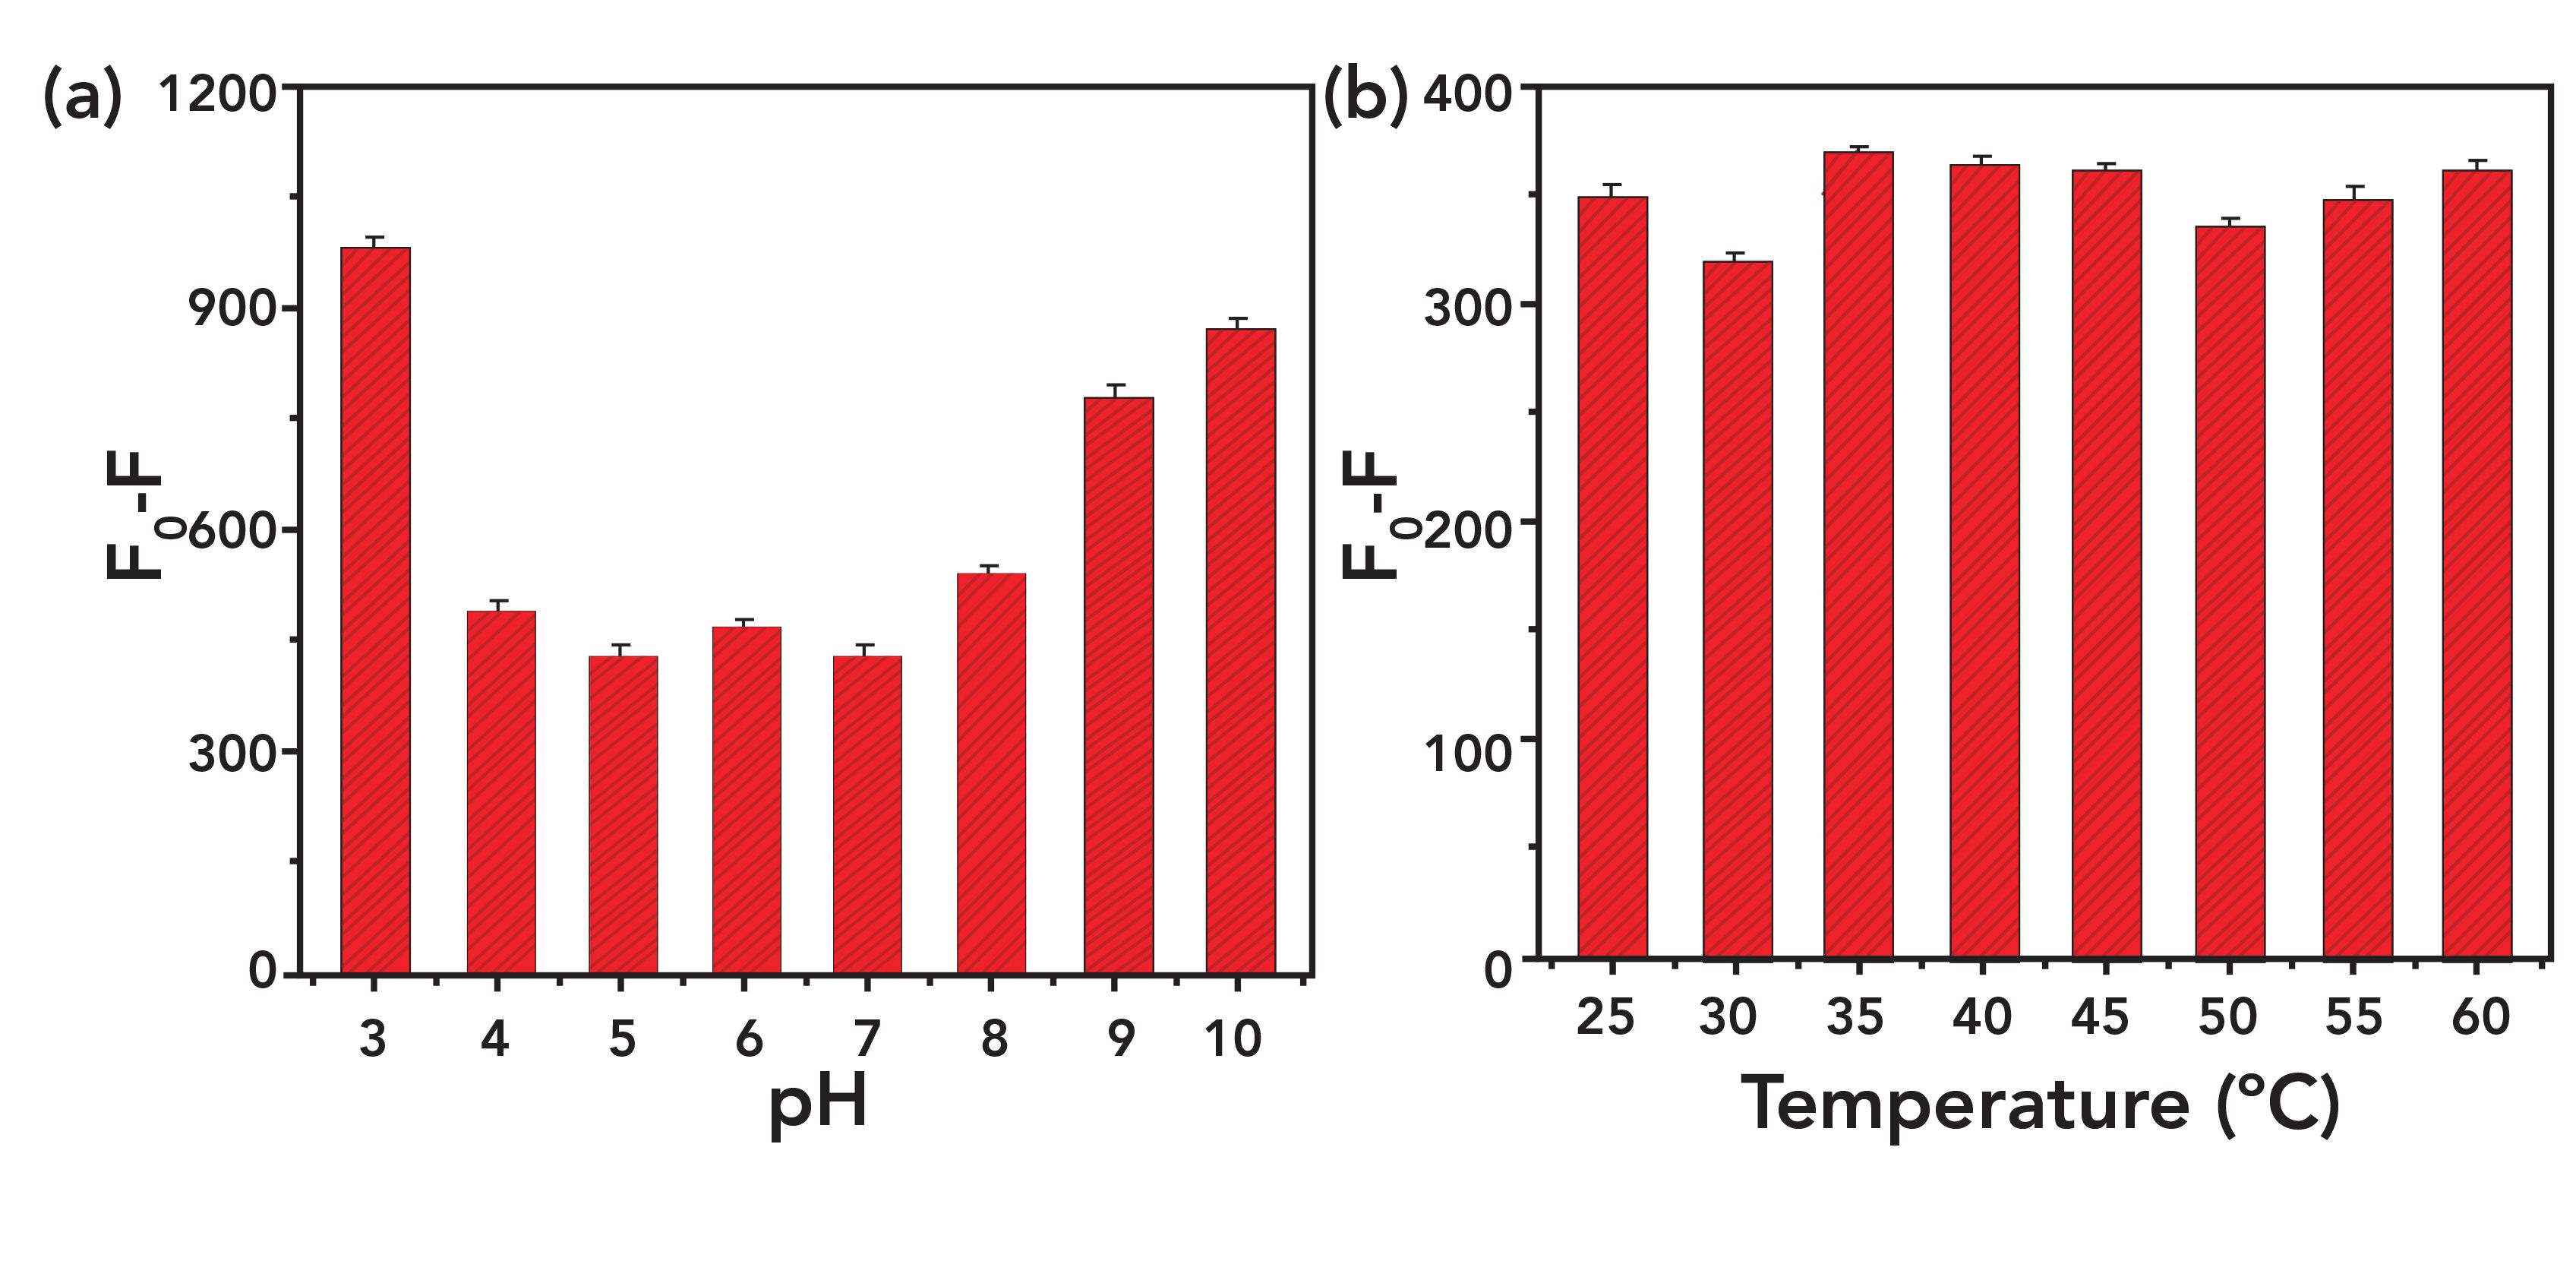
We attempted to modify the conditions of the detection system with the aim of accurately detecting nitrite. The fluorescence intensities of TA-CuNC solutions in the presence of nitrite over the pH range of 3.0–10.0 are shown in Figure 2a. The visible fluorescence quenching occurred in the range of 4.0–8.0, but the fluorescence quenching caused by nitrite can be lower under the extreme pH conditions (strong alkali and strong acid). Thus, TA-CuNCs are able to detect nitrite under mild pH conditions. As shown in Figure 2b, no evident difference in the fluorescence quenching was observed at different reaction temperatures. At room temperature, nitrite was immediately detected after the nitrite was added. Therefore, it can be concluded that the content of nitrite can be detected under mild conditions.
FIGURE 2: Fluorescence spectra of TA-CuNCs with nitrite under (a) different pH, and (b) temperature.
Nitrite Detection by TA-CuNCs
Figure 3 shows that TA-CuNCs had a maximum emission peak at 430 nm. After adding nitrite to the TA-CuNC solution, the fluorescence intensity was quenched completely. A slight red shift of the emission peak was also observed, suggesting that the size or micro-environmental changes surrounding the copper core of TA-CuNCs are associated with the nitrite interaction.
FIGURE 3: Fluorescence spectra of TA-CuNCs (0.5 mg/mL) at pH 3.0 measured before and after the addition of different amounts of the nitrite (the content of sample was from 0 to 200 μM). Inset image shows (L to R) maximum to minimum fluorescence relative to concentration increase of nitrite, respectively.
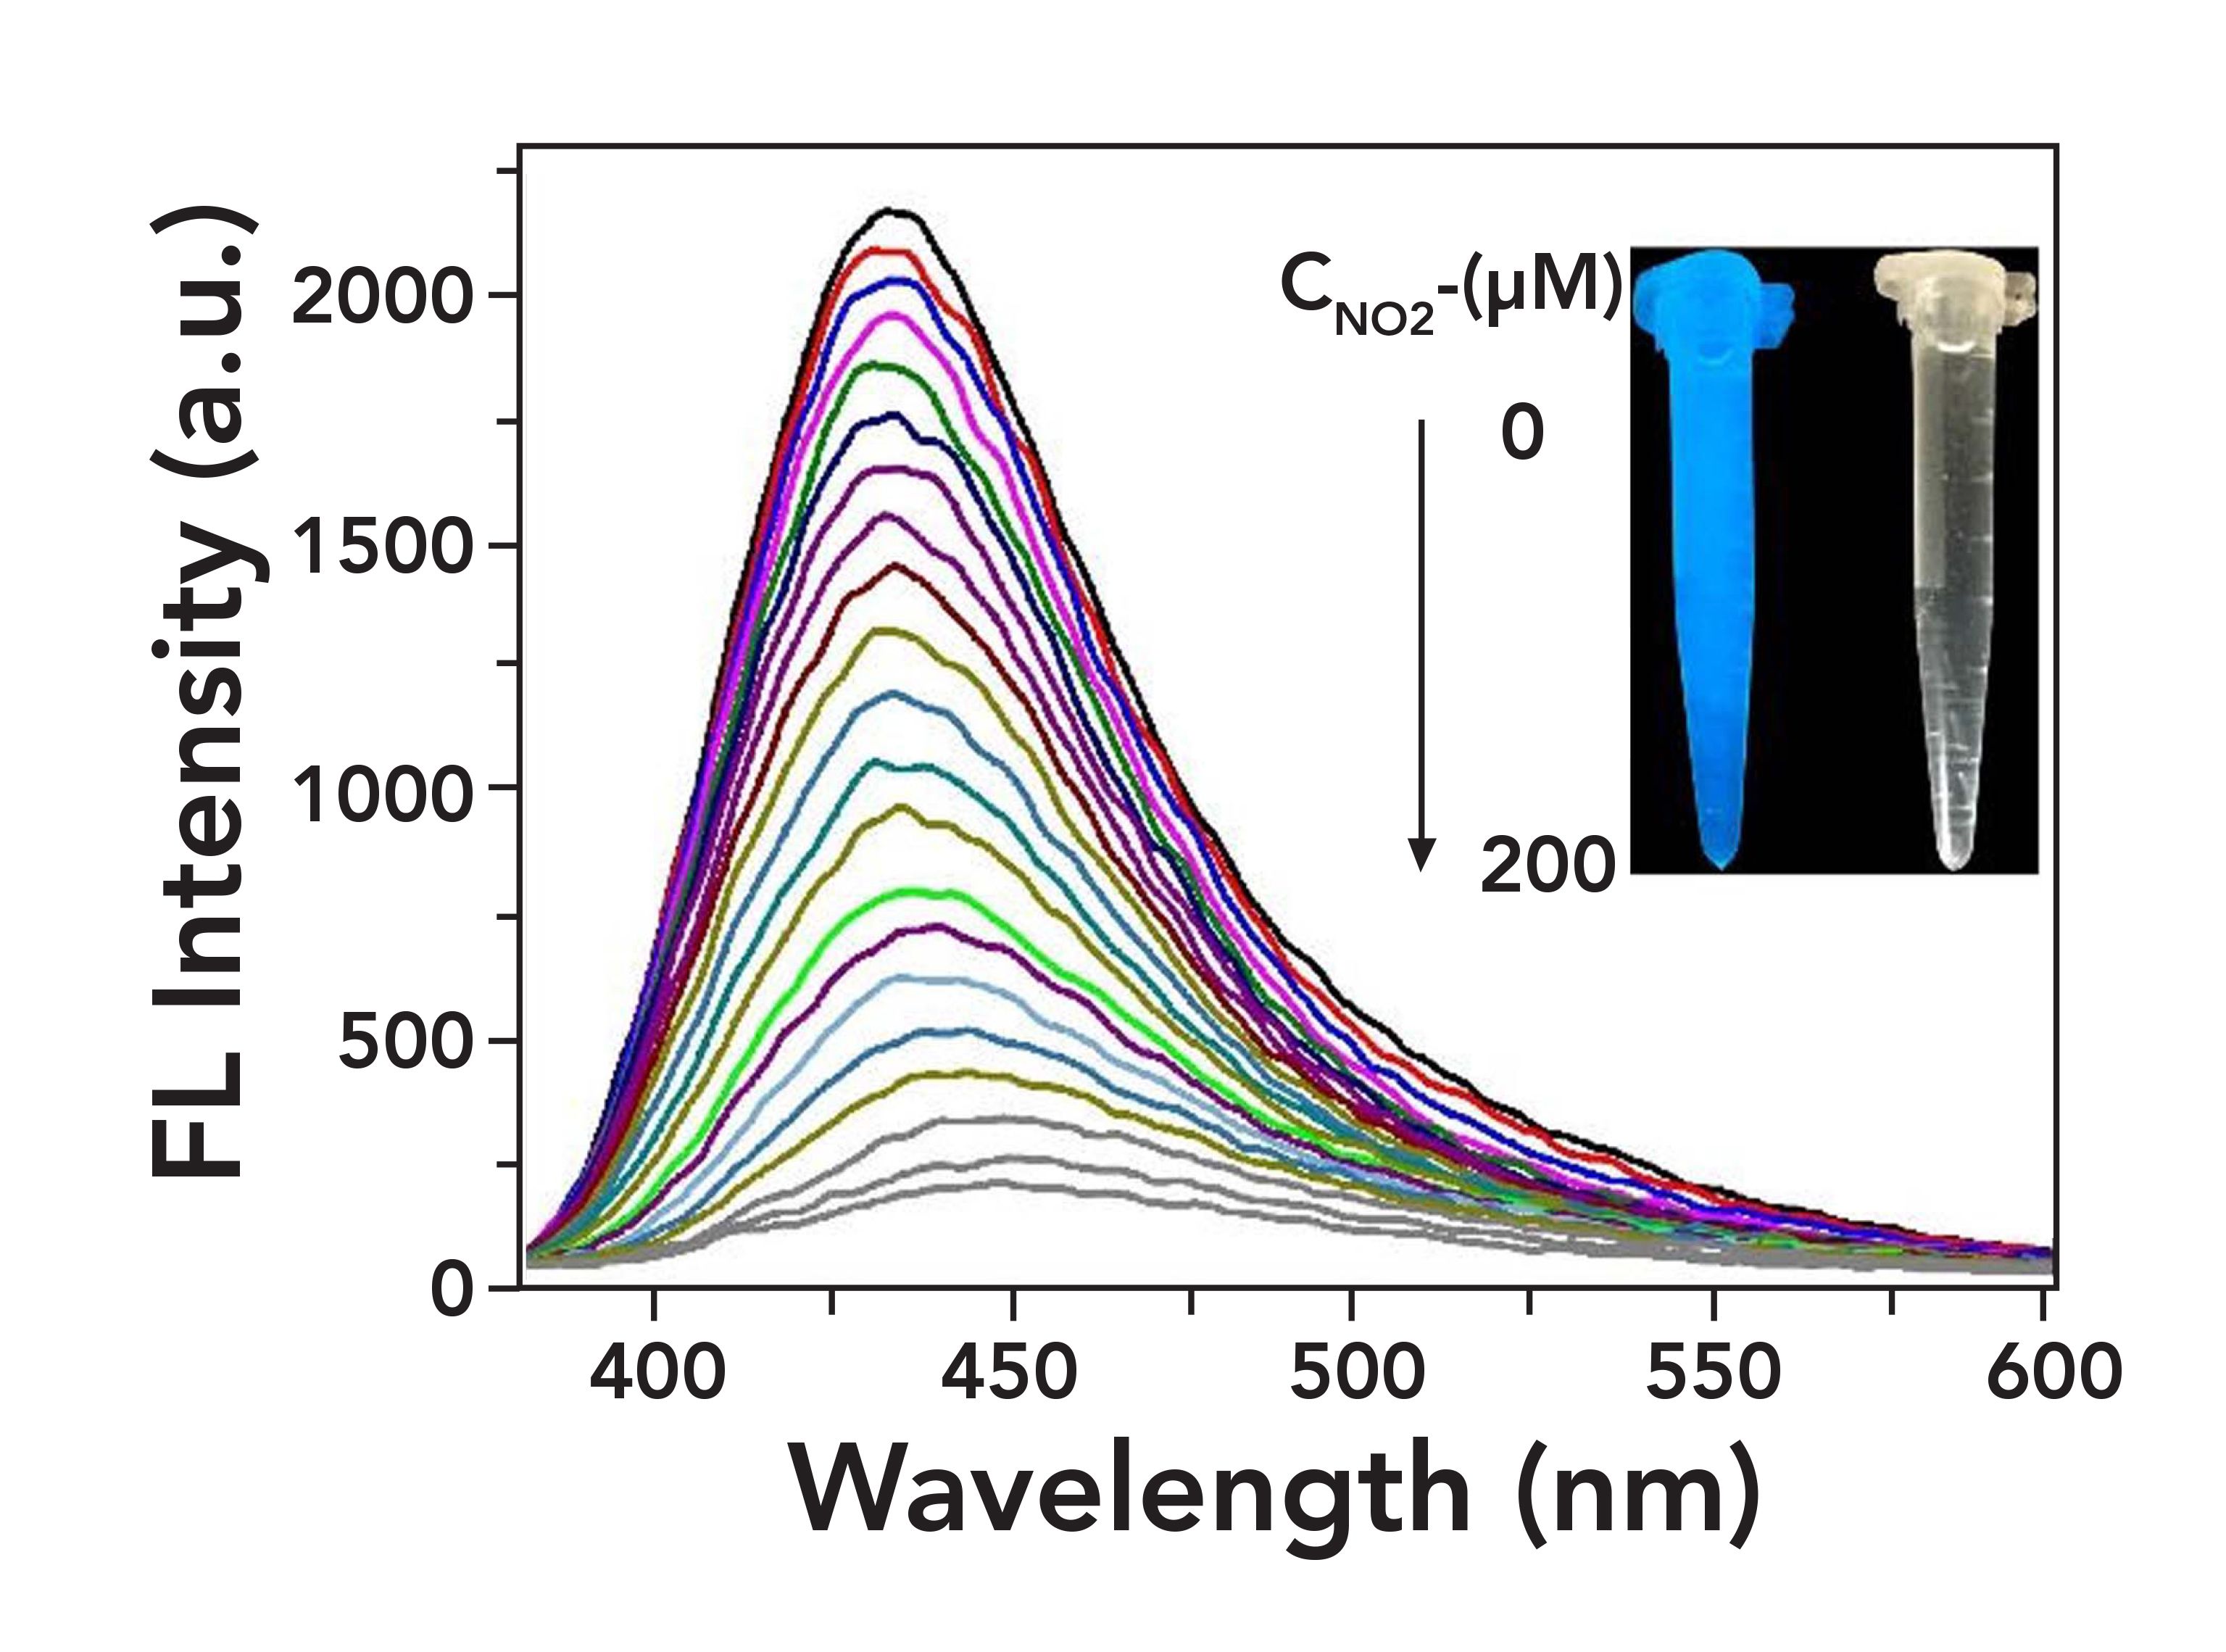
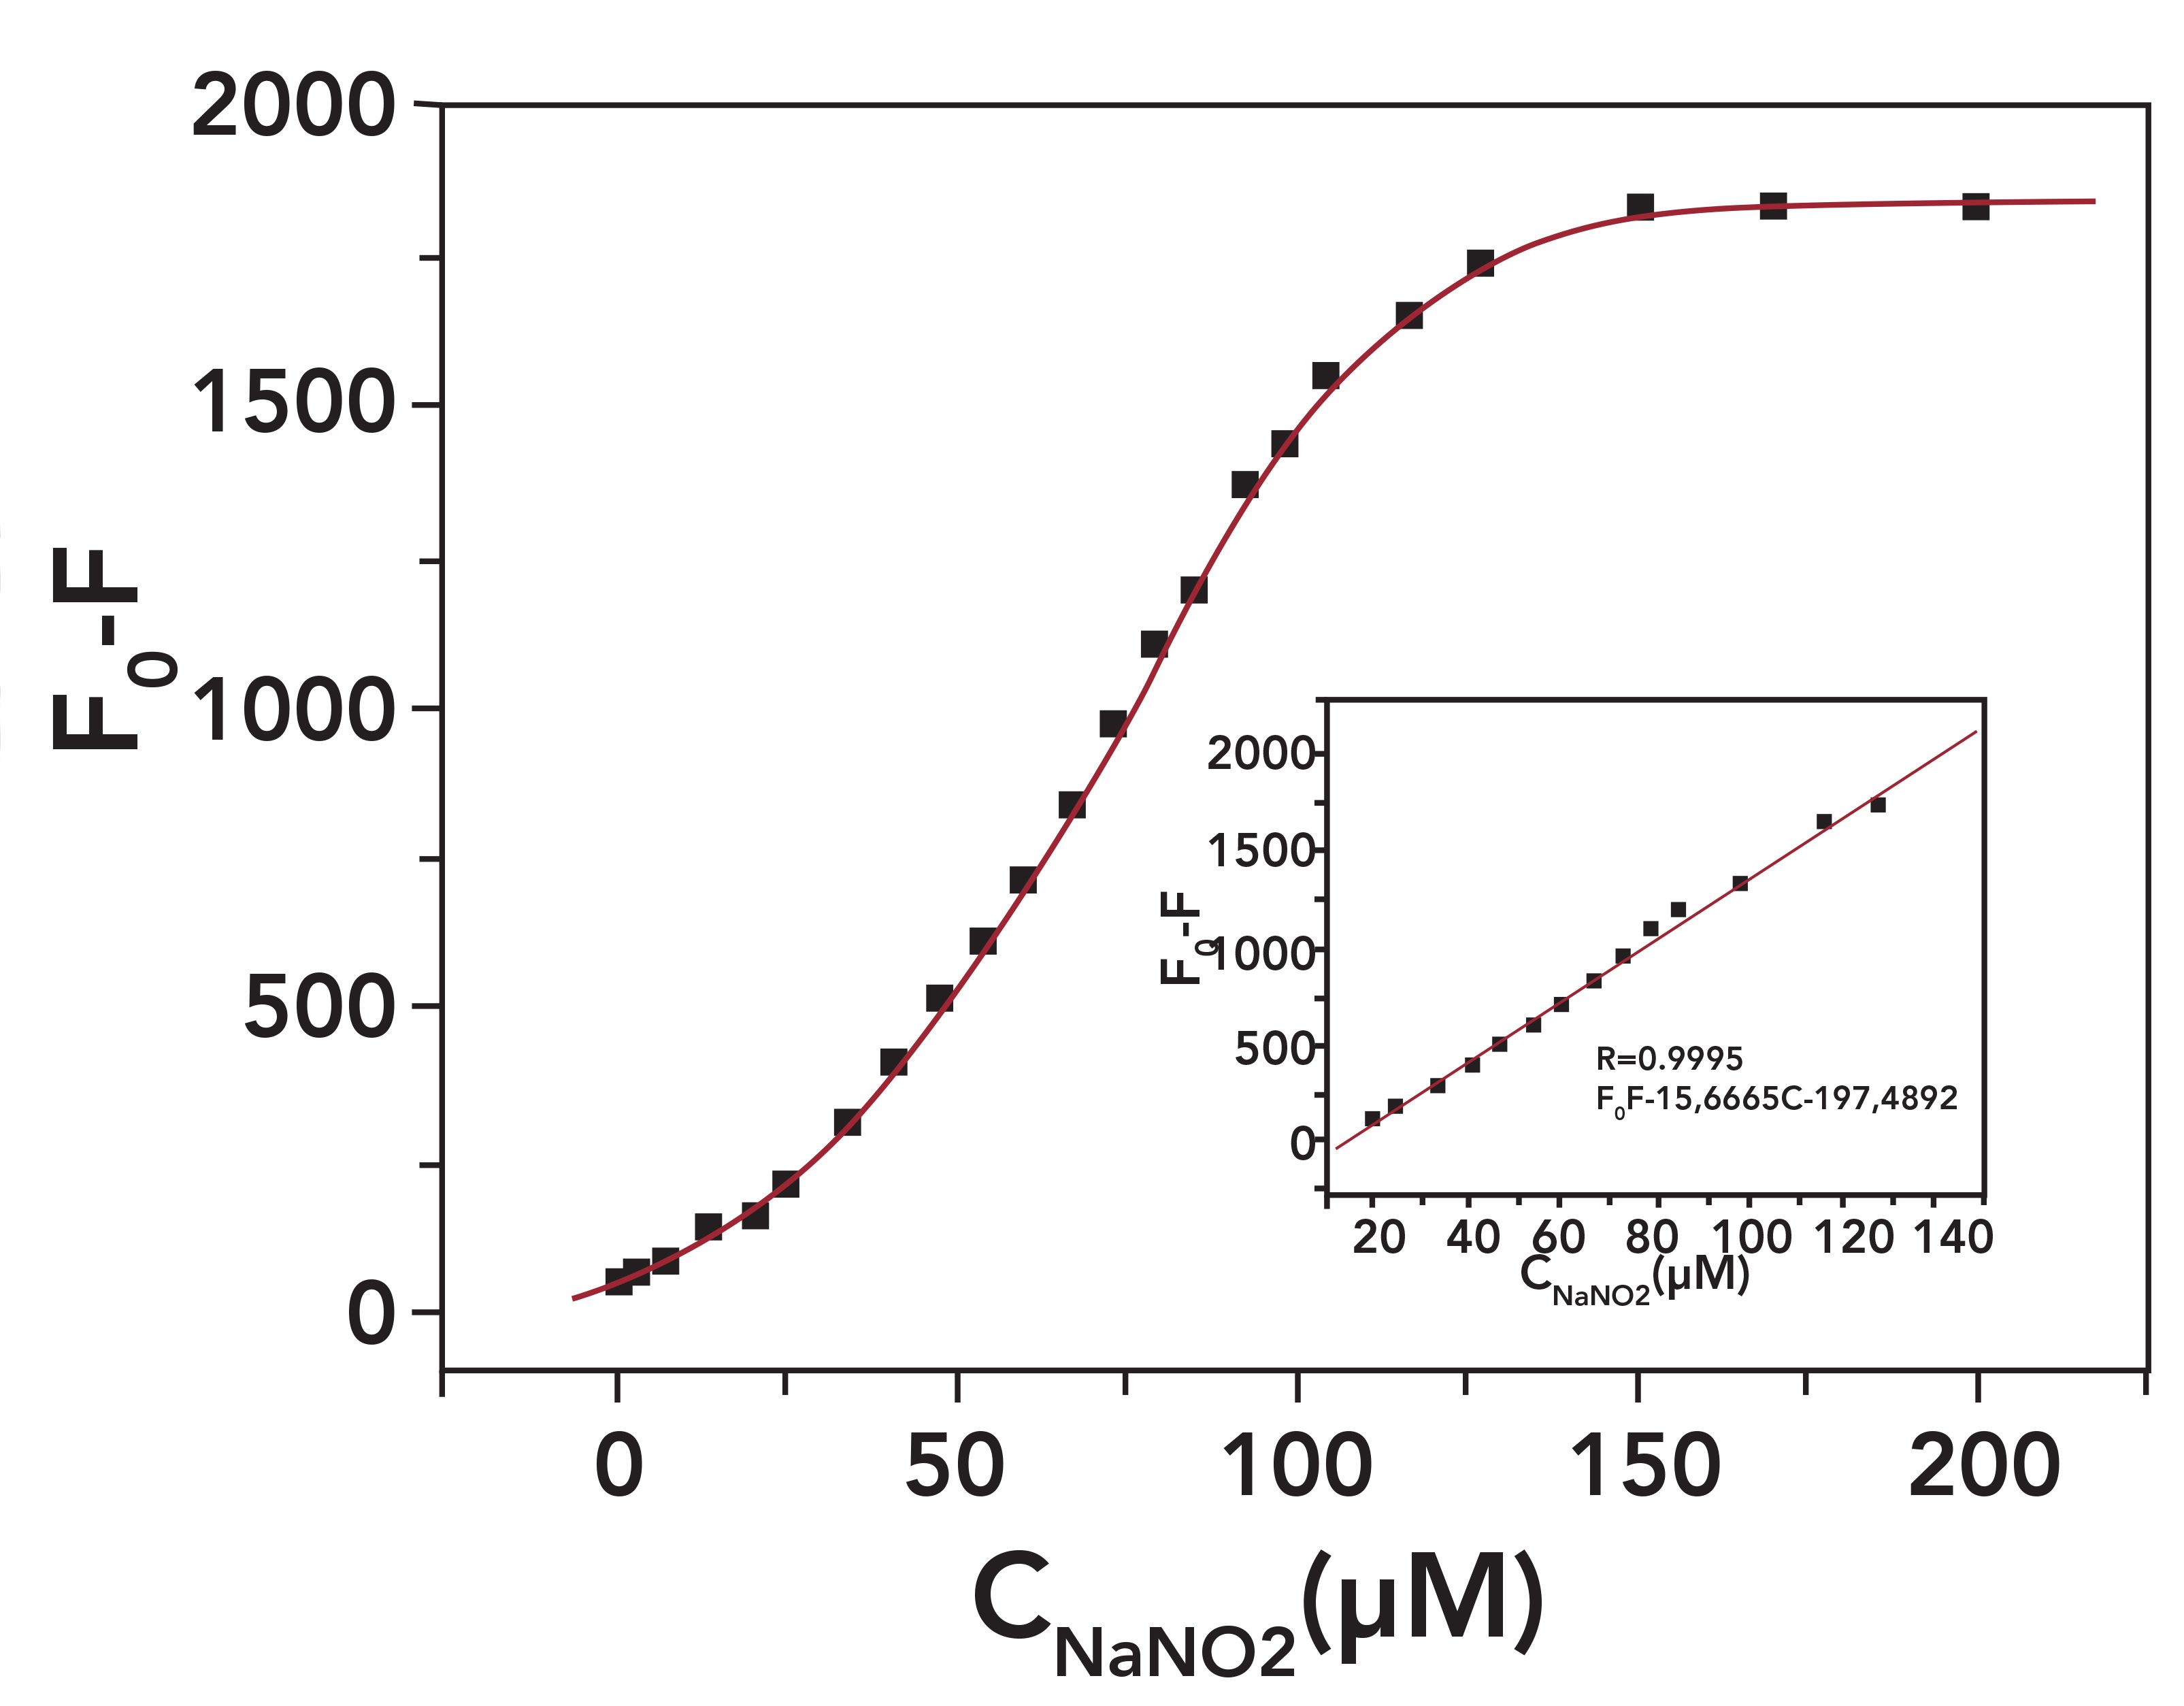
Figure 4 shows that the degree of fluorescence quenching could be gradually intensified with the increased addition of the nitrite ion. The calibration plot revealed a good linear relation between the (F0–F) of the system and nitrite concentration (Figure 4b). The regression equation was (F0–F) = 15.6665C – 197.4892, with a typical detectable nitrite concentration range of 20–100 μM. The limit of detection was calculated to be 40 nM for nitrite when TA-CuNCs were diluted to 0.02 mg/mL. The relative standard deviation was 2.4% obtained from five replicate detections of 50 μM nitrite, indicating good reproducibility of the method.
FIGURE 4: The relationship between F0-F and the concentration of nitrite. Inset shows linear range for the relationship between F0-F and the concentration of nitrite, from approximately 15 to 145 μM.
Interference Experiment
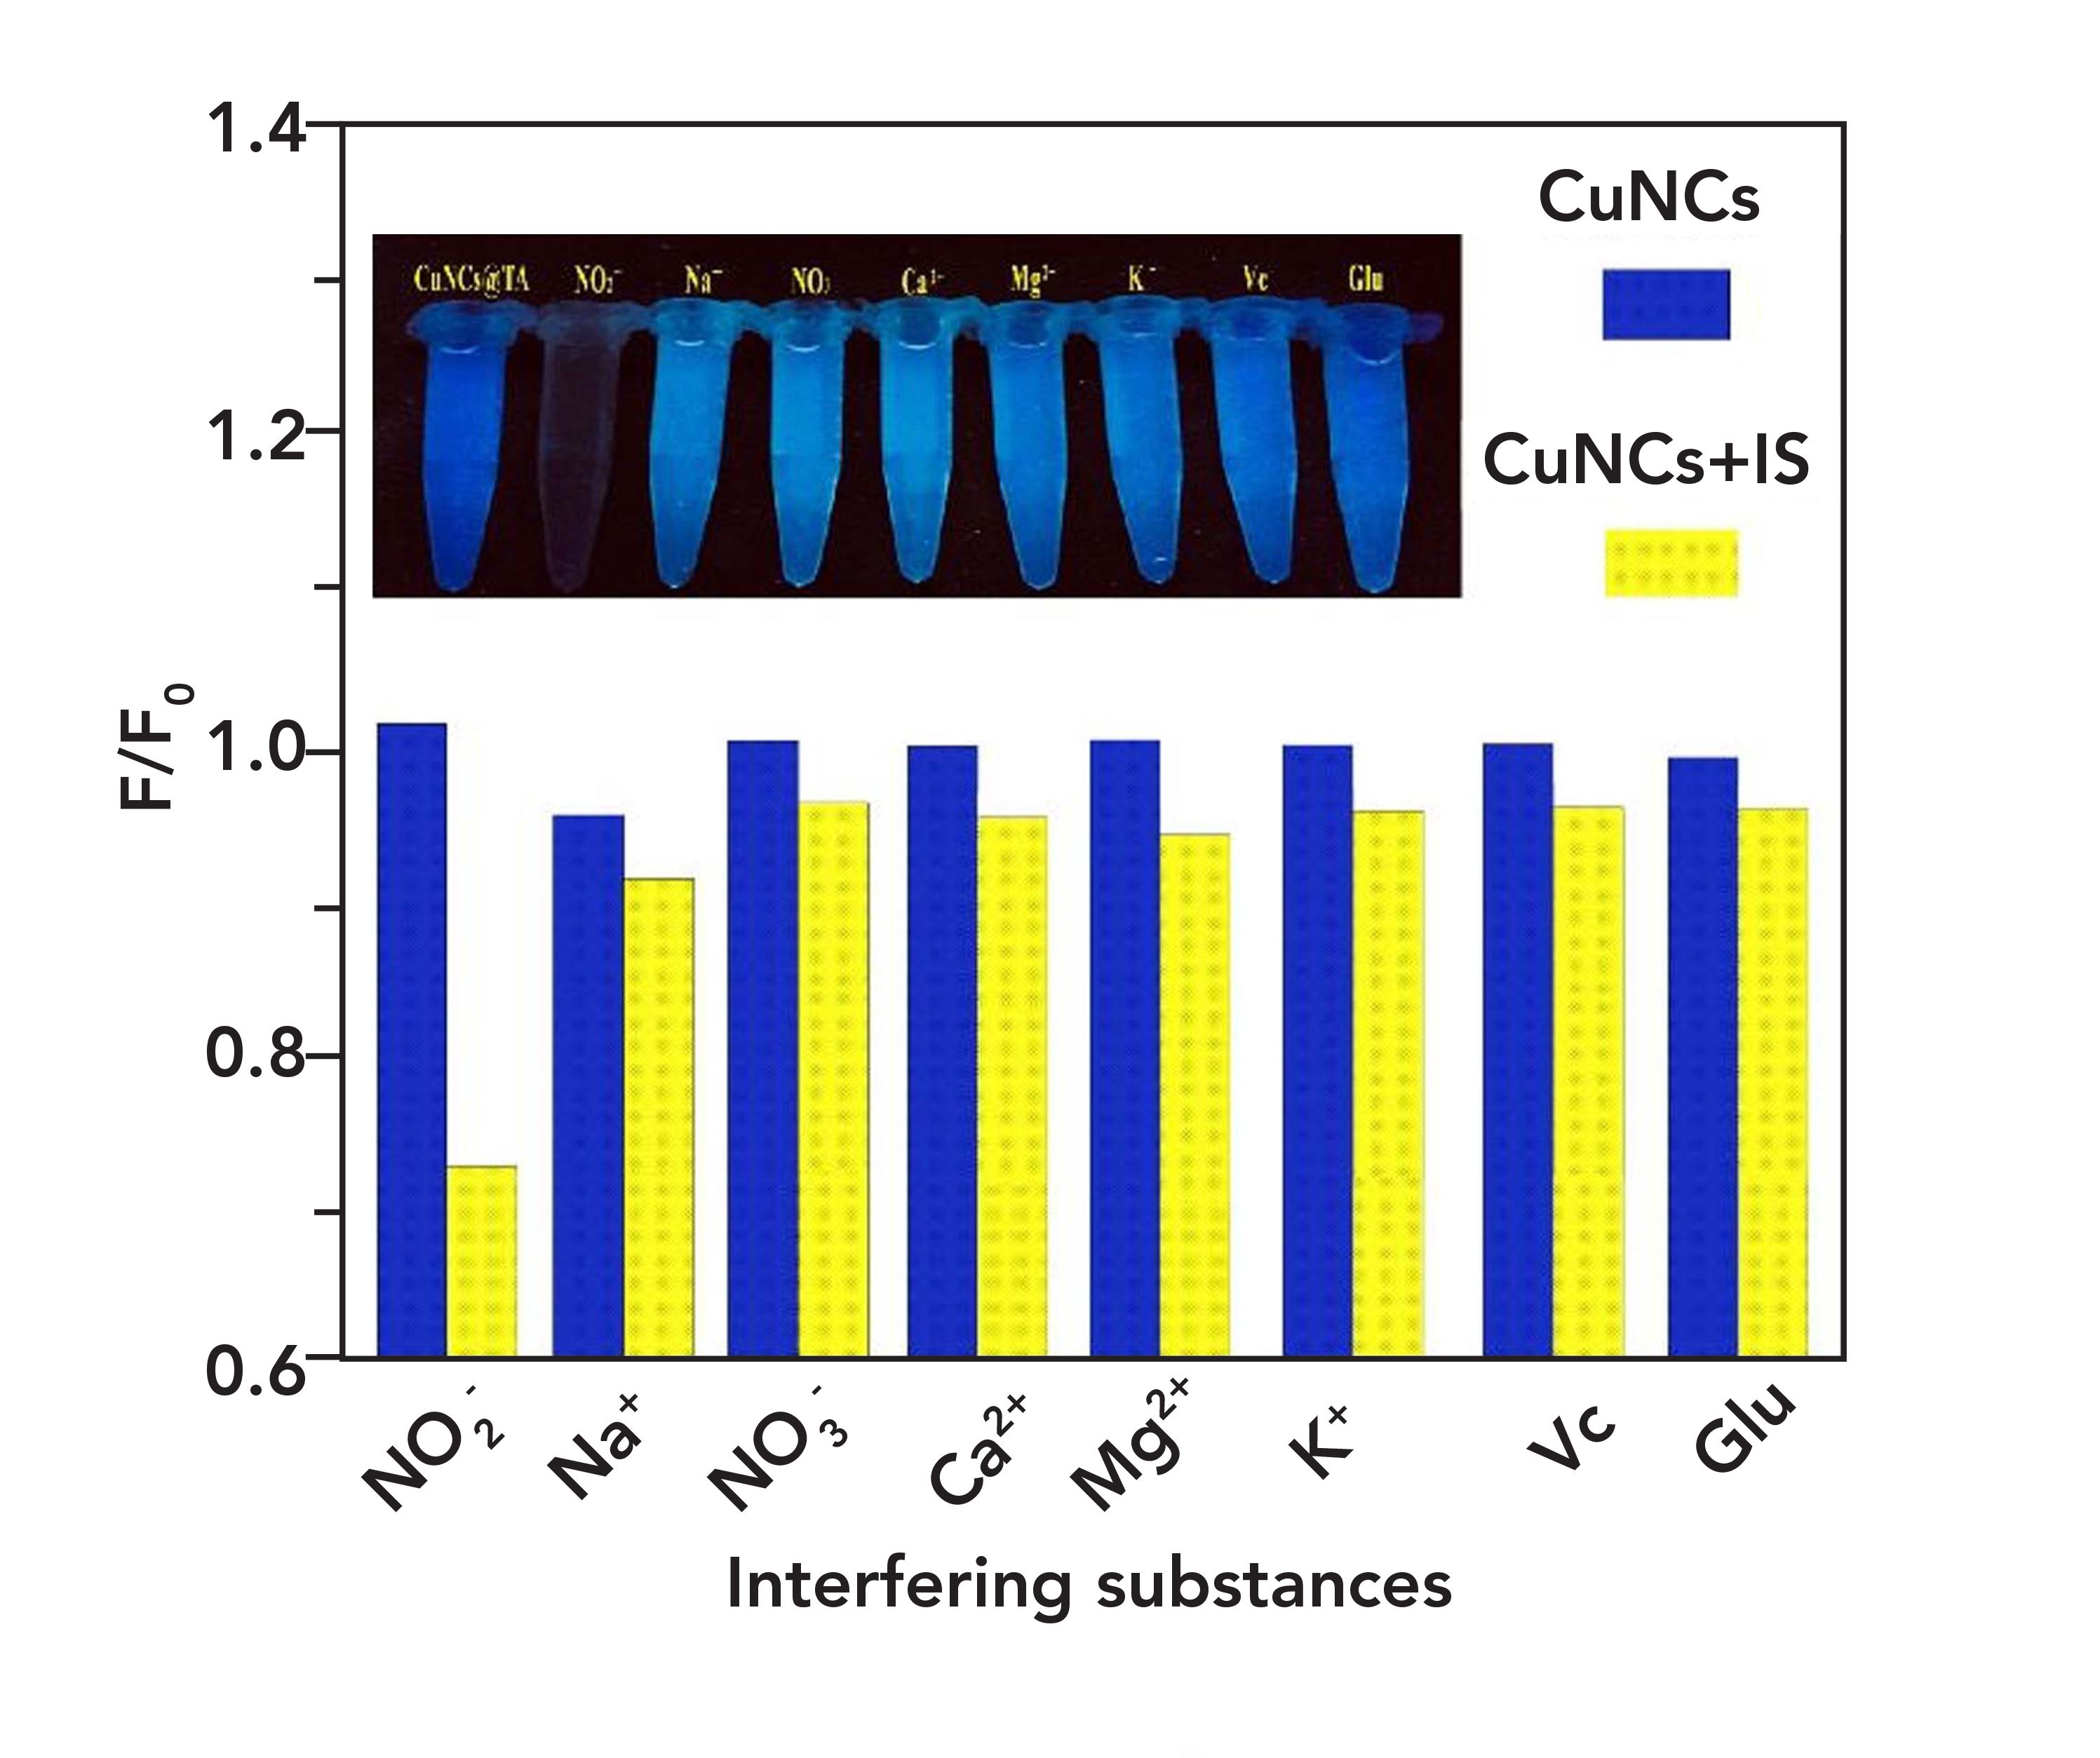
To test the selectivity of the developed method, we examined the influences of various metal ions and anions (the content of each substance was 50 μM) that may exist in sausage samples, including nitrate, magnesium, sodium, calcium, and potassium ions, as well as ascorbic and glutamic acids (Figure 5). The results indicate that all potentially interfering substances except nitrite had no obvious effect on the fluorescence changes of TA-CuNCs. Therefore, this fluorescence sensor exhibits good selectivity for nitrite and can be used to detect nitrite in real food and environmental samples.
FIGURE 5: The fluorescence intensity ratio (F/F0) of TA-CuNCs (0.5 mg/mL) in the presence of various interfering substances. Inset image shows corresponding vials of sample with respective interfering material.
Nitrite Detection in Sausage
To evaluate the practical application of TA-CuNCs as a fluorescence method for nitrite, the proposed technique was used to detect real samples. Sausage samples were analyzed after extraction and deproteinization. The Griess reagent method (UV-vis) for nitrite detection (28) was used to check the accuracy of the proposed method. The results of the two methods are listed in Table I. The fluorescence probe was found to have high accuracy, sensitivity, and precision, demonstrating the convenient and practical application of the proposed method for sensing nitrite analysis in real samples.

Fluorescence Response Mechanism
The fluorescence quenching process is actually a process by which the luminescence processes compete with each other to reduce the lifetime of the excited states of the luminescent molecules. Fluorescence quenching can be divided into static quenching and dynamic quenching, according to different quenching mechanisms. Dynamic quenching is produced by diffusion collision between the chromophore and quencher, during the fluorescence lifetime of the excited state. The quenching is caused by energy transfer or charge transfer. Static quenching is caused by a coordination reaction between the fluorescent molecules and fluorescent quencher molecules in the ground state, which results in a finite degree of binding. Structural complexes, which themselves cannot emit light, lead to fluorescence quenching of fluorescent molecules (29). To elucidate the mechanism of fluorescence quenching, the fluorescence temperature data were analyzed by the Stern-Volmer equation:
F0/F = 1 + Kqτ0[Q] = 1 + KSV[Q] [1]
where the fluorescence intensity of TA-CuNCs with or without nitrite is F0 or F, KSV is the dynamic quenching constant, Kq is quenching rate constant, and the fluorescent lifetime of TA-CuNCs is about 2.77 × 10⁻⁹ s (see Figure 1). The concentration of the quenching agent is marked as [Q], and F0/F-[Q] is plotted to calculate Kq and KSV at different temperatures (Figure 6 and Table II). There was a good linear relationship exhibited between F0/F and [Q]. Table II shows that the KSV value of TA-CuNCs and nitrite decreases with the increase of temperature, and the KSV is much smaller than the maximum diffusion collision quenching constant of biological macromolecules, which is 2.0 × 10¹⁰ L/mol x s. As a result, the possibility of dynamic quenching is increased, and the dissociation of the complexes formed often happens. Thus, the possibility of static quenching is reduced. It is more likely that the quenching of TA-CuNCs by nitrite ions involves a dynamic quenching process (30).
FIGURE 6: Stern-Volmer curves under different temperatures of TA-CuNCs (0.5 mg/mL) with nitrite.
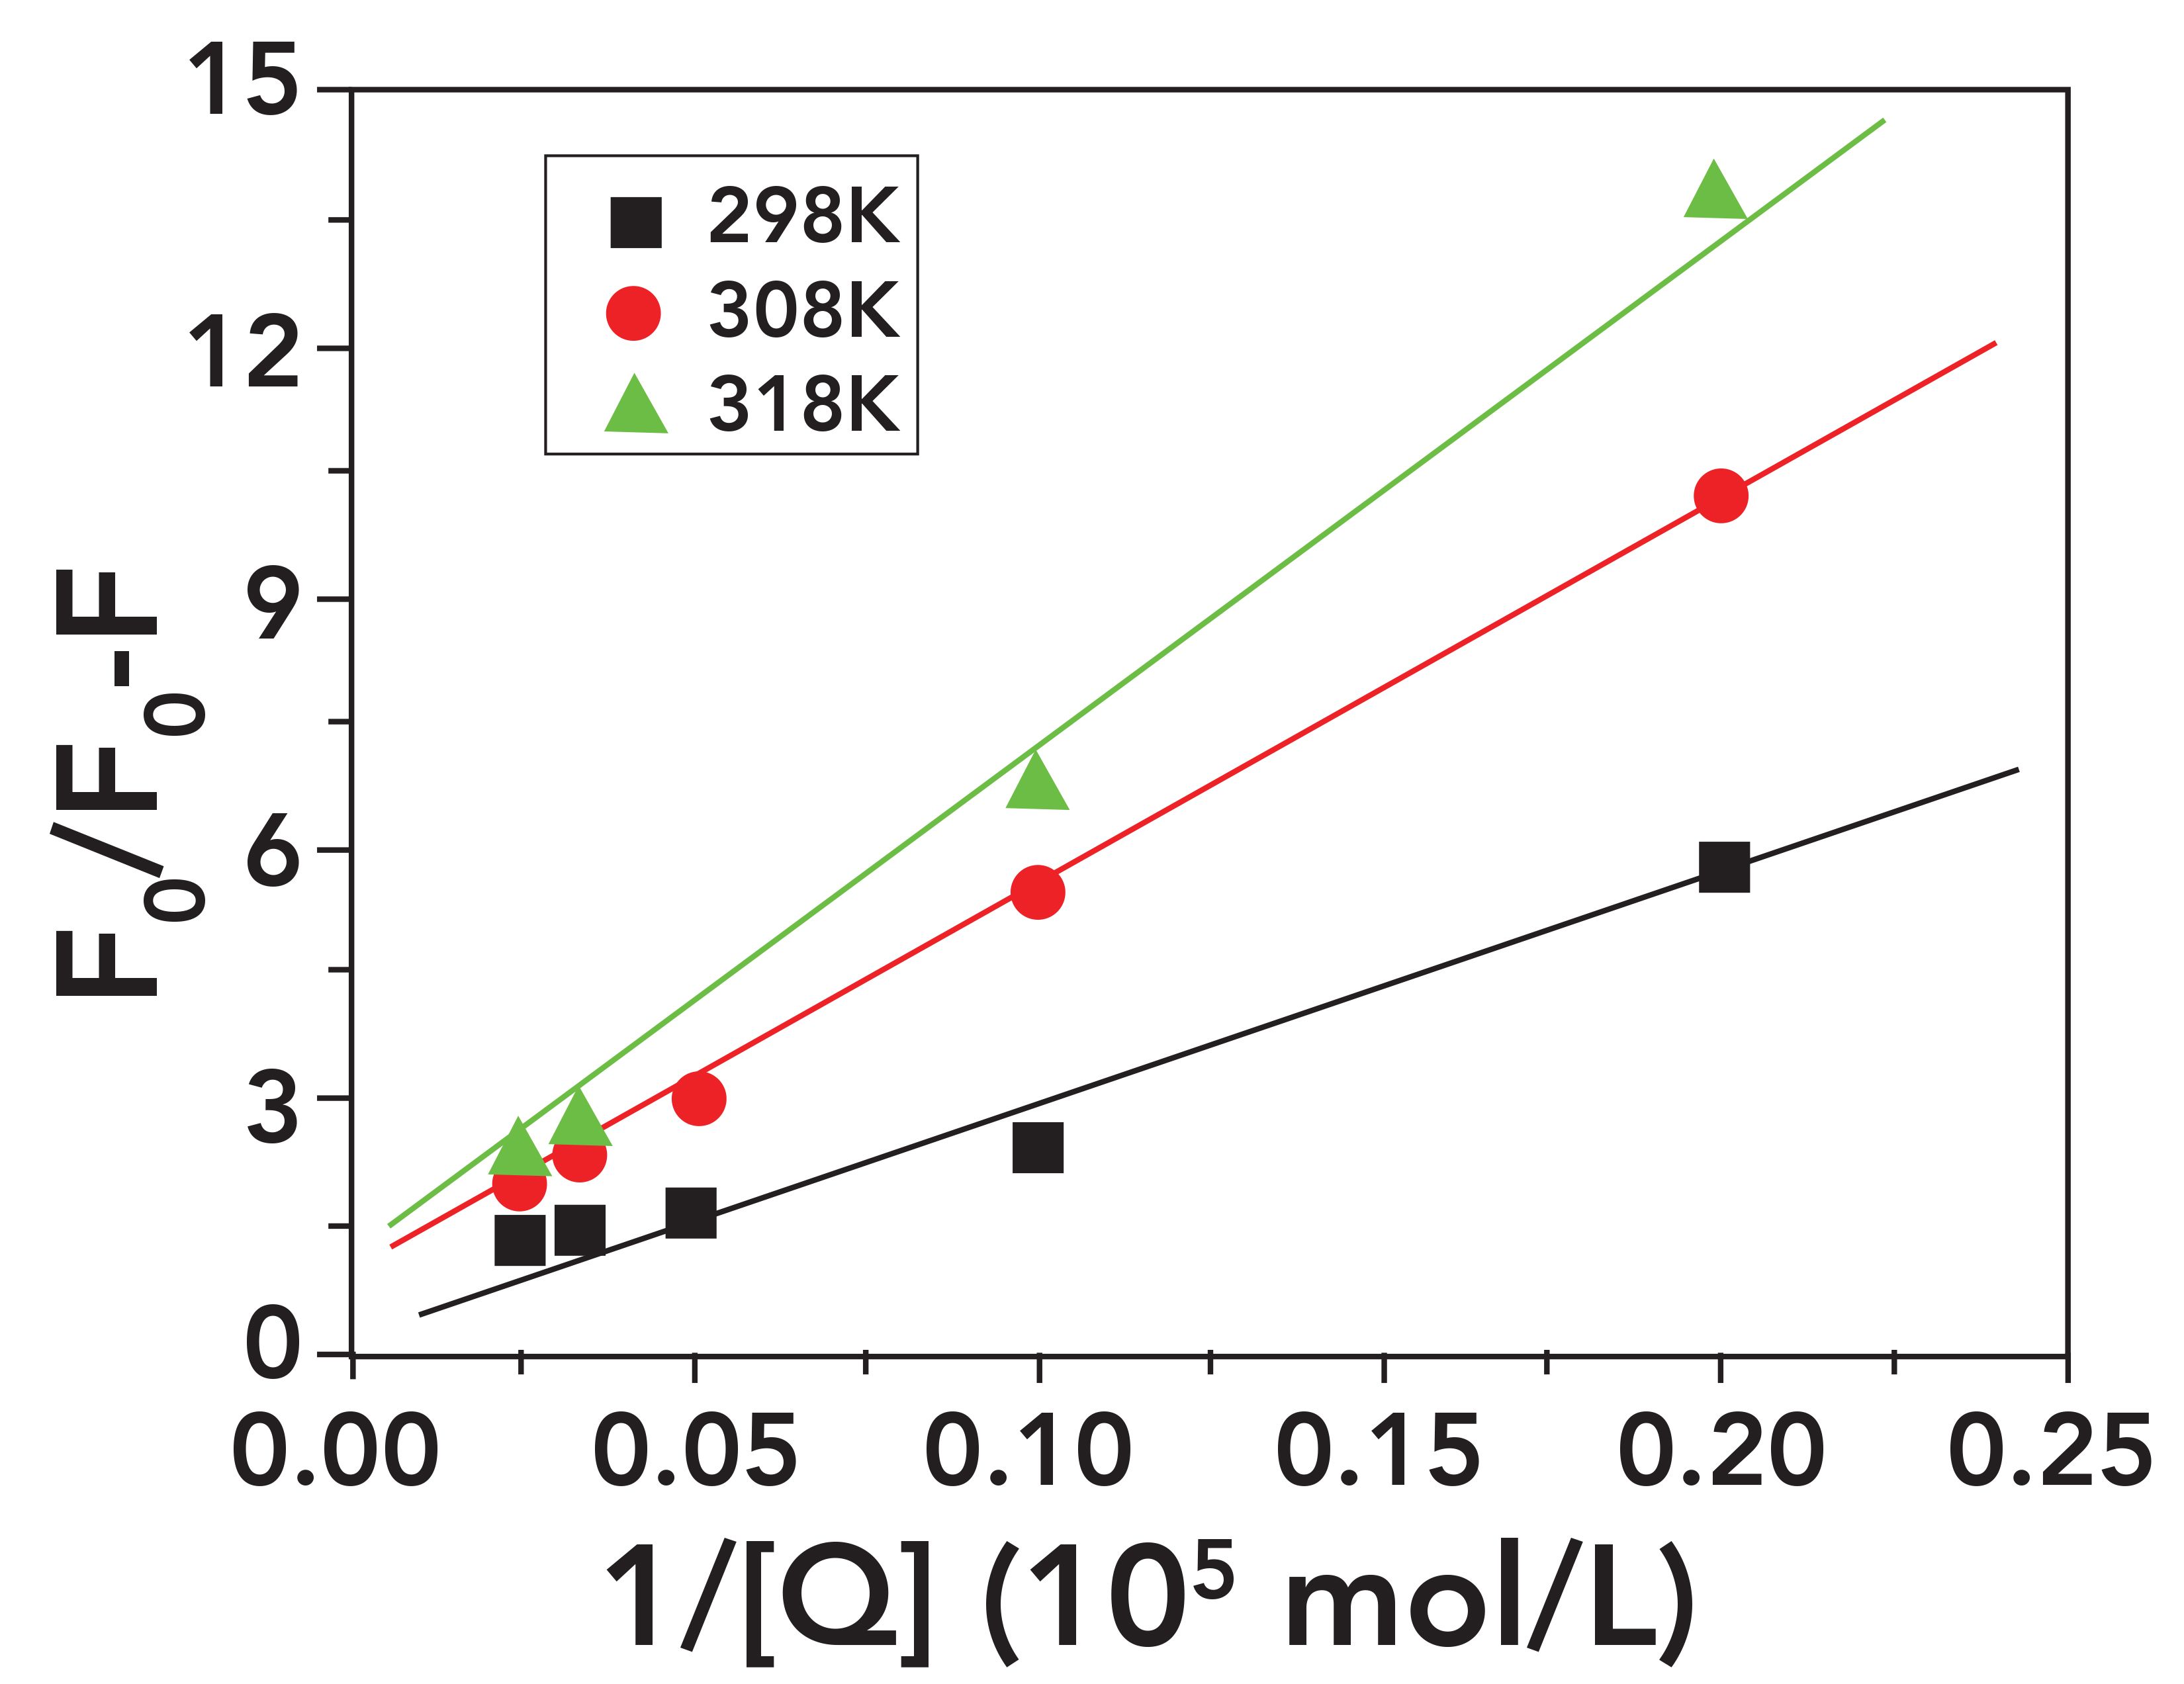
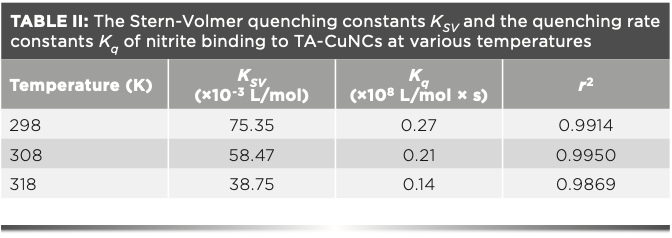
Figure 7 shows that there was a good linear relationship between F0/(F0-F) and 1/[Q] as a function of temperature. The effective quenching constant Ka can be calculated from the modified Stern-Volmer equation, which is displayed in equation 2:
F0/(F0-F) = 1/fa ∙ Ka∙ [Q] + 1/fa [2]
The thermodynamic parameters ΔH, ΔS, and ΔG can be calculated by equations 3 and 4:
lgKa=–∆H/2.303RT + ∆S/2.303R [3]
ΔG = ΔH – TΔS [4]
It can be seen from Table III that a good linear relationship exists, and that the Ka value decreases gradually with an increase in temperature. This trend is consistent with KSV, which is further consistent with a quenching process that belongs to dynamic quenching. The thermodynamic parameters are listed in Table III. ΔH < 0 and ΔS < 0 indicate that nitrite and TA-CuNCs are Van der Waals forces or hydrogen bonding forces (31,32).

Conclusions
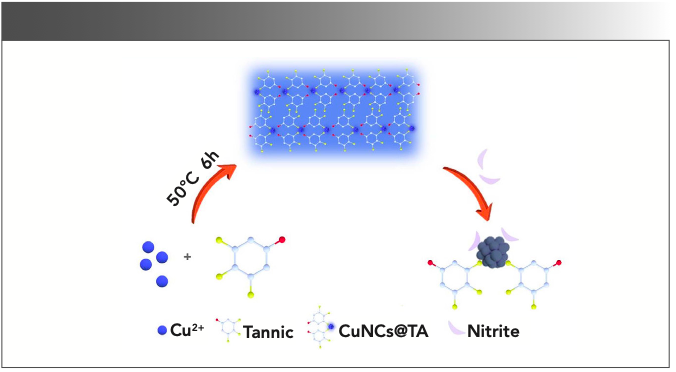
A quantitative and confirmatory method for the determination of trace levels of nitrite ion in sausage over a broad pH range was developed based on tannic acid-stabilized CuNCs (Scheme 1). In addition to the detailed exploration of the fluorescence quenching mechanism, the most efficient quenching of TA-CuNCs induced by nitrite was ascribed to a Van der Waals force or hydrogen bonding process. The methodology described was successfully utilized as a probe to detect nitrite ion in sausage, which was further confirmed using the Griess reagent method (UV-vis). The as-synthesized CuNCs are also suitable for future application in other foods because of their good sensitivity and low toxicity.
SCHEME 1: Schematic illustration of the fluorescence assay for nitrite using TA-CuNCs.
Acknowledgments
The present work was supported by the projects of NSFC (Nos. 21902058).
References
(1) M.J. Moorcroft, J. Davis, and R.G. Compton, Talanta 54(5), 785–803 (2001).
(2) M. Akyu̎z and Ş. Ata, Talanta 79(3), 900–904 (2009).
(3) K.O. Honikel, Meat Sci. 78(1-2), 68–76 (2008).
(4) H.J. Ahn, J.H. Kim, C. Jo, H.S. Yook, and M.W. Byun, J. Agr. Food Chem. 82(3), 465–468 (2003).
(5) United States Environmental Protection Agency, National Primary Drinking Water Regulations: Contaminant Specific Fact Sheets, Inorganic Chemicals (Consumer Version, Washington, DC, 2009).
(6) S. Moncada, R.M.J. Palmer, and EA. Higgs, Pharmacol. Rev. 43(2), 109–142 (1991).
(7) Y.T. Li, J.S. Whitaker, and C.L. McCarty, J. Chromatogr. A 1218(3), 476–483 (2011).
(8) L.J. He, K.G. Zhang, C.J. Wang, X.L. Luo, and S.S. Zhang, J. Chromatogr. A 1218(23), 3595–3600 (2011).
(9) H. Moshage, B. Kok, J.R. Huizenga, and P.L. Jansen, Clin. Chem. 41(6), 892–896 (1995).
(10) F.D. Betta, L. Vitali, R. Fett, and A.C.O. Costa, Talanta 122, 23–29 (2014).
(11) P. Wang, M.Y. Wang, F. Y. Zhou, G.H. Yang, L.L. Qu, and X.M. Miao, Electrochem. Commun. 81, 74–78 (2017).
(12) J. Wu, X. Wang, Y. T. Lin, Y. Z. Zheng, and J. M. Lin, Talanta 154, 73–79 (2016).
(13) B. Gu, L. Y. Huang, J.L. Hu, J.J. Liu, W. Su, X.L. Duan, H.T. Li, and S. Z. Yao, Talanta 152, 155–161 (2016).
(14) Y. M. Shen, Q.J. Zhang, X.H. Qian, and Y.J. Yang, Anal. Chem. 87(2), 1274–1280 (2015).
(15) C. Chen, Z.Q. Yuan, H.T. Chang, F.N. Lu, Z.H. Li, and C. Lu, Anal. Methods 8, 2628 (2016).
(16) Q.L. Yue, L.J. Sun, T.F. Shen, X.H. Gu, S.Q. Zhang, and J.F. Liu, J. Fluoresc. 23, 1313–1318 (2013).
(17) J. Feng, Y.L. Chen, Y.X. Han, J.J. Liu, S.D. Ma, H.G. Zhang, and X.G. Chen, ACS Omega 2(12), 9109–9117 (2017).
(18) A.L. Han, L. Xiong, S.J. Hao, Y.Y. Yanga, X. Li, G.Z. Fang, J.F. Liu, Y. Pei, and S. Wang, Anal. Chem. 90(15), 9060 (2018).
(19) N.D. Tan, J.H. Yin, Y.Q. Yuan, L. Meng, and N. Xu, B-Korean Chem. Soc. 39, 657 (2018).
(20) H.Y. Cao, Z.H. Chen, H.Z. Zheng, and Y.M. Huang, Biosens. Bioelectron. 62, 189–195 (2014).
(21) Q. Tang, T.T. Yang, and Y.M. Huang, Microchim. Acta 182, 2337–2343 (2015).
(22) H.B. Rao, W. Liu, Z.W. Lu, Y.Y. Wang, H.W. Ge, P. Zou, X.X. Wang, H. He, X.Y. Zeng, and Y.J. Wang, Microchim. Acta 183, 581–588 (2016).
(23) Q. Liu, Q. Lai, N. Li, and X.G. Su, Microchim. Acta 185, 182 (2018).
(24) R.S. Aparna, S.S. Syamchand, and S. George, J. Clust. Sci. 28, 2223–2238 (2017).
(25) C.M. Yu, J.W. Guo, and H.Y. Gu, Electroanal. 22(9), 1005–1011 (2010).
(26) H.Y. Cao, Z.H. Chen, H.Z. Zheng, and Y.M. Huang, Biosens. Bioelectron. 62, 189–195 (2014).
(27) X.L. Cao, X. Li, F.X. Liu, Y.N. Luo, and L.Y. Yu, Luminescence 33(5), 981 (2018).
(28) O. Ozdestan and A. Uren, J. Agr. Food Chem. 58(4), 2602–2608 (2010).
(29) T. Htun, J. Fluoresc. 14, 217–222 (2004).
(30) H.S. Geethanjali, D. Nagaraja, R.M. Melavanki, and R. A. Kusanur, J. Lumin. 167, 216–221 (2015).
(31) C.Q. Jiang, M.X. Gao, and X.Z. Meng, Spectrochim. Acta A 59(7), 1605–1610 (2003).
(32) D.P. Ross and S. Subramanian, Biochem. 20(11), 3096–3102 (1981).
Xueling Cao, Yageng Bai, Fei Li, and Xiaoyang Yu are with the College of Chemical and Pharmaceutical Engineering, at the Jilin Institute of Chemical Technology, in Jilin City, in the People’s Republic of China. Faxian Liu is with Jilin Petrochemical Company, in Jilin City, in the People’s Republic of China. Direct correspondence to: xueling-cao126@163.com ●
Smarter Sensors, Cleaner Earth Using AI and IoT for Pollution Monitoring
April 22nd 2025A global research team has detailed how smart sensors, artificial intelligence (AI), machine learning, and Internet of Things (IoT) technologies are transforming the detection and management of environmental pollutants. Their comprehensive review highlights how spectroscopy and sensor networks are now key tools in real-time pollution tracking.
New Study Reveals Insights into Phenol’s Behavior in Ice
April 16th 2025A new study published in Spectrochimica Acta Part A by Dominik Heger and colleagues at Masaryk University reveals that phenol's photophysical properties change significantly when frozen, potentially enabling its breakdown by sunlight in icy environments.
Real-Time Battery Health Tracking Using Fiber-Optic Sensors
April 9th 2025A new study by researchers from Palo Alto Research Center (PARC, a Xerox Company) and LG Chem Power presents a novel method for real-time battery monitoring using embedded fiber-optic sensors. This approach enhances state-of-charge (SOC) and state-of-health (SOH) estimations, potentially improving the efficiency and lifespan of lithium-ion batteries in electric vehicles (xEVs).
Smart Optical Sensors for Thermal Management in Electric Vehicles
April 8th 2025A recent review in Energies explores the latest advancements in sensor applications for electric vehicle (EV) thermal management systems. The study, authored by Anyu Cheng, Yi Xin, Hang Wu, Lixin Yang, and Banghuai Deng from Chongqing University of Posts and Telecommunications, along with industry partners, examines how advanced optical sensors improve the efficiency, safety, and longevity of EVs.