Spectral Subtraction
Mixture analysis by infrared (IR) spectroscopy can be difficult. Amongst the tools that simplifies the process is spectral subtraction. In spectral subtraction, the spectrum of a pure component is subtracted from the spectrum of a mixture, ideally removing the contribution of that component from the mixture. This allows peaks from other components to be seen easily and helps improve library search results. The proper way to perform spectral subtraction, and the pitfalls to avoid, are discussed in this article.
Perhaps the biggest practical problem with infrared (IR) spectroscopy is its struggle to determine the components in a mixture. Spectral subtraction is one of the tools we have in our arsenal to combat this problem. Spectral subtraction allows users to remove the spectral contribution of known components from a mixture spectrum so the spectra of unknown components can be seen more clearly. I discuss how subtractions work, the proper way to perform them, and the pitfalls to avoid.
The Thorny Problem of Mixture Analysis
Mixtures present a problem for IR spectroscopy because the more complicated the chemical composition of a sample, the more peaks there are in a spectrum and the more difficult it becomes to figure out what peaks belong to what molecules. One of the tools that is useful in mixture analysis is library searching, which we discussed in the last column (1). Another tool is spectral subtraction, which is discussed in this article.
Theory and Background
The purpose of spectral subtraction is to remove the contributions of known components from a mixture spectrum so that the peaks of other components can be seen more clearly. An example of the power of spectral subtraction is seen in Figure 1.
FIGURE 1: (a) The result of subtracting the spectrum of pure water from the spectrum of a water and glutamine mixture, (b) the reference spectrum of pure water, and (c) a mixture spectrum of glutamine dissolved in water.
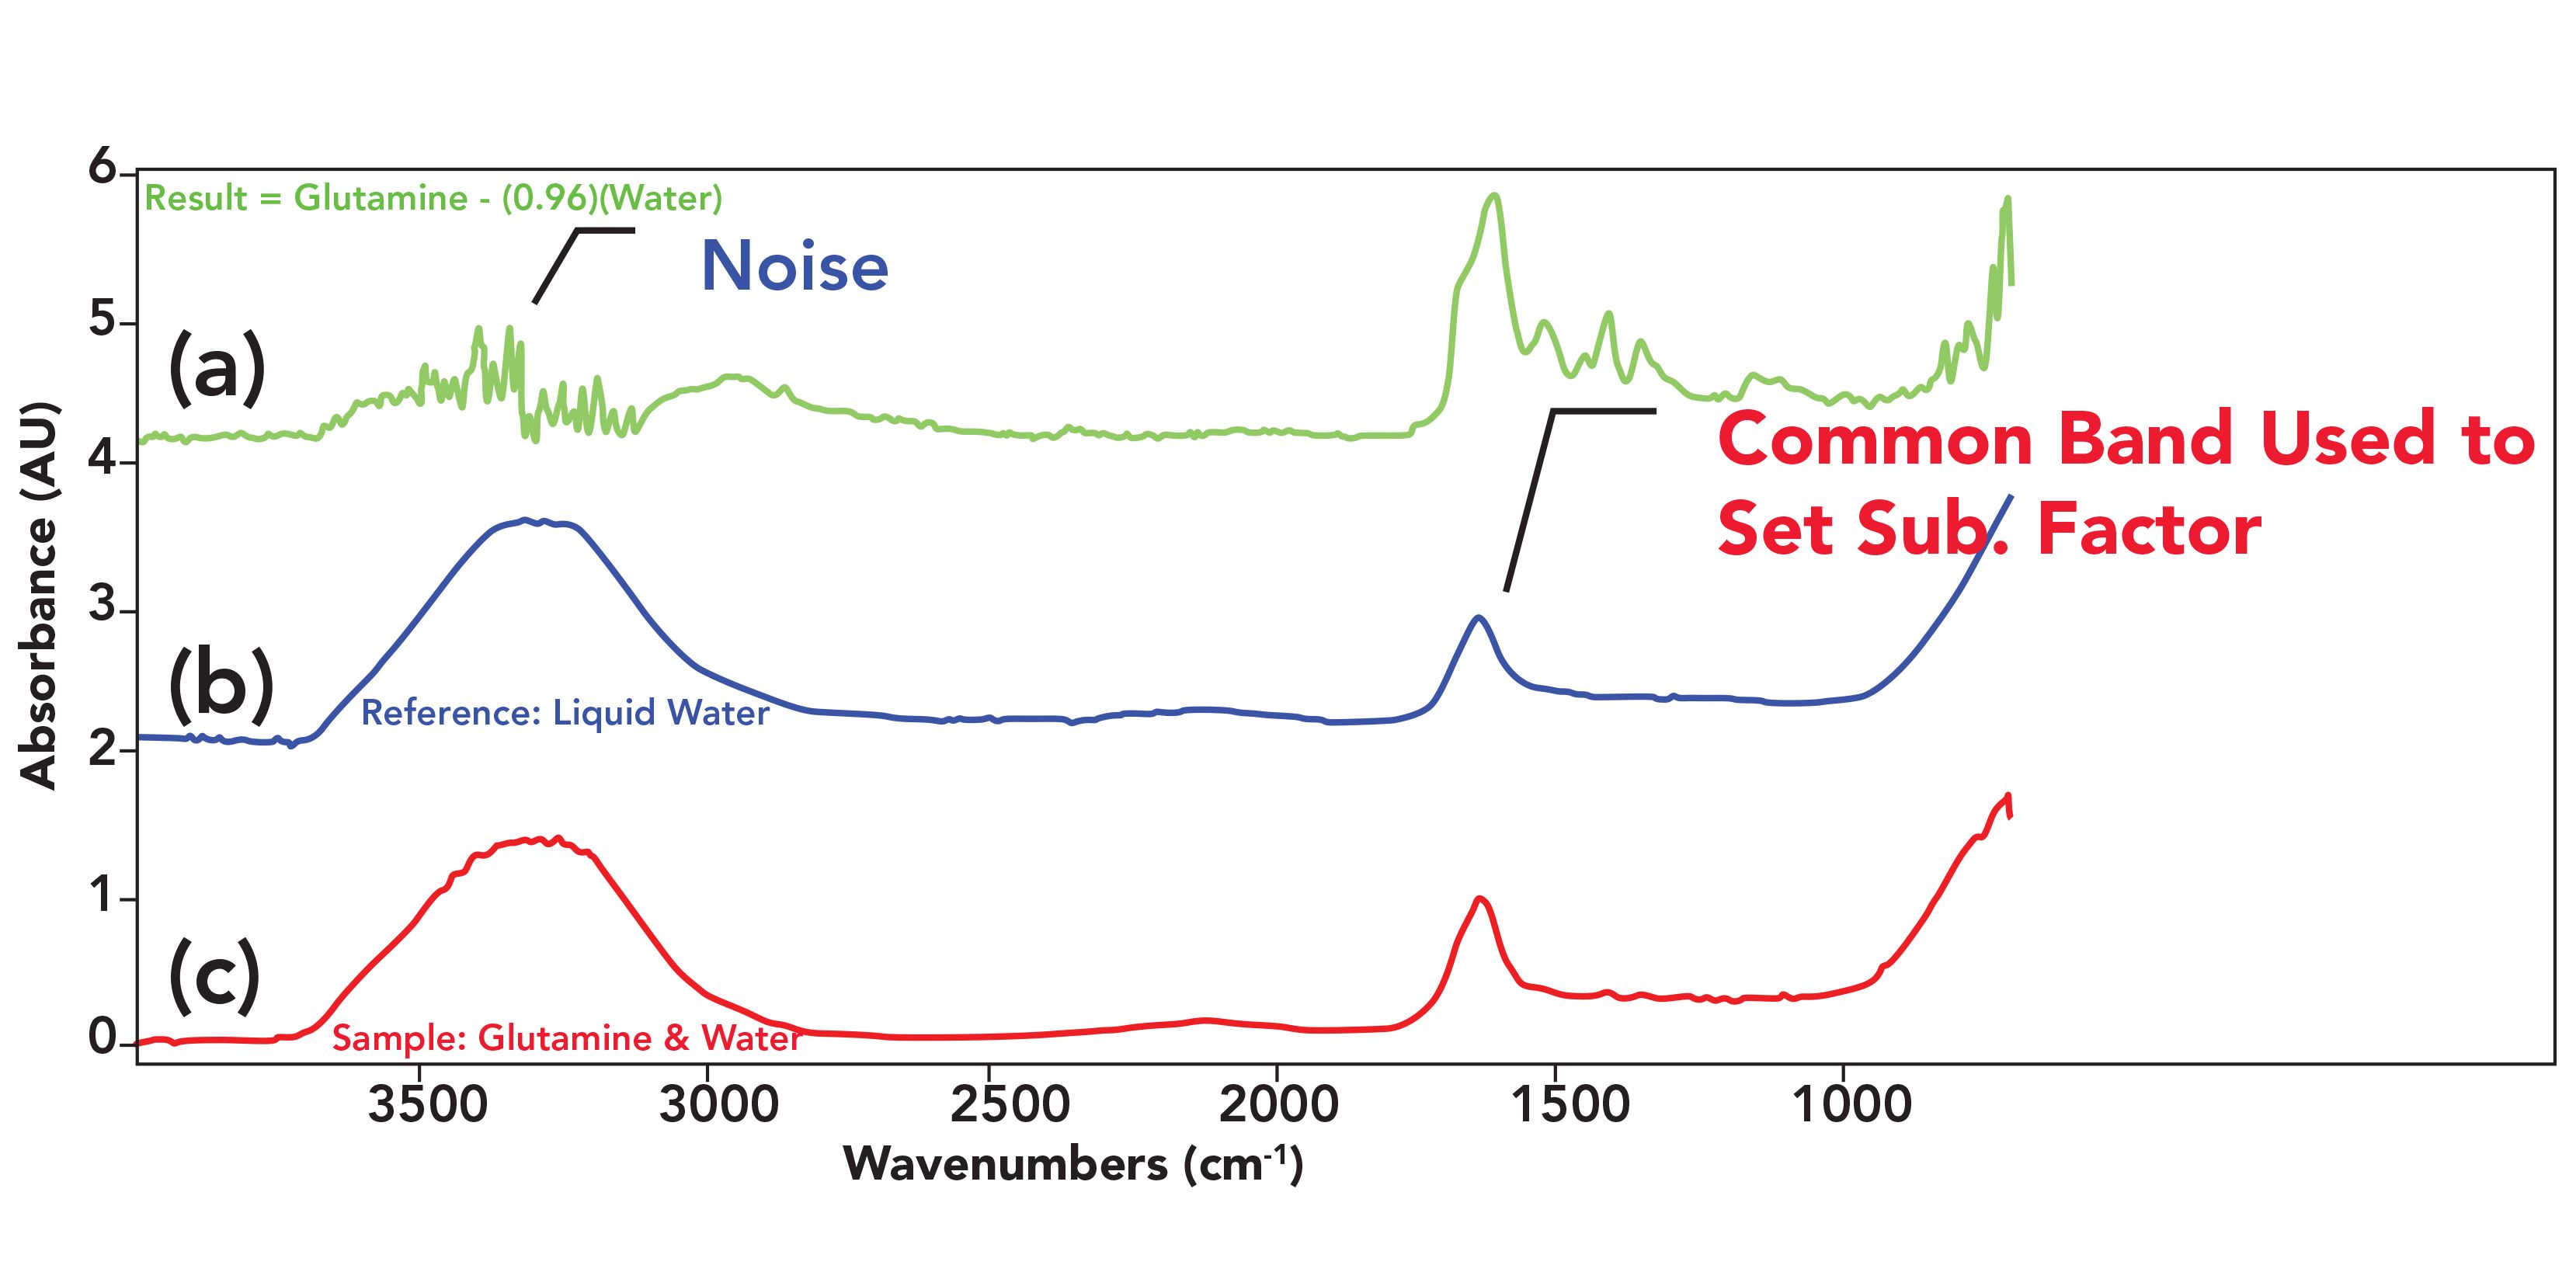
The bottom spectrum in Figure 1 is of glutamine, an amino acid, dissolved in water. The spectrum of pure water is in the middle of Figure 1. A comparison of these two spectra shows that the peaks from water dominate both spectra, and that the peaks from glutamine are difficult to see in the mixture spectrum. However, after performing a subtraction, the contribution of the water peaks was minimized, and there are clearly glutamine peaks in the 1600–1000 cm-1 range seen in the top spectrum in Figure 1. These peaks would help determining that glutamine is present if this were an unknown spectrum.
The algorithm behind spectral subtraction for this example is relatively sample as such:
(Glutamine + Water) – (Water) = Glutamine [1]
with the idea being that a spectrum of glutamine and water will produce a spectrum of glutamine once the spectrum of water is subtracted from it. In the parlance of spectral subtraction, in this example the mixture spectrum is called the sample spectrum and the water spectrum is called the reference spectrum. Generally, the reference spectrum is of a pure substance that we know is present in a mixture. In this case, identifying the presence of water was simple from the spectra. In other cases, the reference material can be identified via spectral interpretation (2), library searching (1), or other knowledge of the sample. The result of subtracting the reference spectrum from the sample spectrum is called the result spectrum. Thus, the general formula for spectral subtraction is:
Sample – Reference = Result [2]
When two spectra are subtracted, the absorbance (AU) of the reference spectrum at each wavenumber is subtracted from the absorbance of the sample spectrum at each wavenumber. For example, if the sample spectrum has an absorbance of 0.5 at 3000 cm-1, and the reference spectrum has an absorbance of 0.3 at this wavenumber, the result spectrum will have an absorbance of 0.2 at 3000 cm-1. You can think of a results spectrum as being a plot of the absorbance difference between two spectra versus wavenumber.
The spectral subtraction process assumes that the spectra used follow Beer’s law, which means there is a linear relationship between absorbance and concentration as such (3):
A = ɛlc [3]
where A is absorbance units (AU), ɛ is absorptivity, l is pathlength, and c represents concentration. If this relationship is not followed, the subtraction process may not go smoothly.
Subtraction Factor to the Rescue!
In a perfect universe, the peaks of the reference material would be identical in size and shape in the sample and reference spectra as seen to the left in Figure 2.
FIGURE 2: (a) Two peaks of the same size and width. These will subtract cleanly to give a flat line. (b) Two peaks of different size, when subtracted, will give a reference material peak in the result the size of the difference between the two.

In this situation where the two peaks being subtracted are perfect overlays, the result in this wavenumber region will be 0 absorbance units and appear as a flat line because absorbances in each spectrum are the same. This is how the contribution of the reference material is removed from the sample spectrum.
However, typically the size of the reference material peaks in the sample and reference spectra will be different as seen to the right in Figure 2. This is caused by differences in pathlength and concentration between the sample and reference (3). For example, the absorbance of pure water at 1630 cm-1 seen in Figure 1 is 1 AU, whereas the size of this peak in the sample spectrum seen in Figure 1 at this same wavenumber is 0.96 AU. This happened because a solute dilutes a solvent when a solution is made. In this case, the concentration of water in a glutamine–water solution is less than in pure water. This results in the water peaks being different sizes in the two spectra, similar to the situation to the right in Figure 2. In this case, when the subtraction is performed, there will be a peak from the reference material in the result equal in size to the difference in absorbance between the two spectra. In our glutamine–water example, the peak size at 1630 cm-1 in the result will be 0.96 − 1.0 = -0.04 AU.
It is rare for the reference peaks in the sample and reference spectra to be coincidentally the same size, which means the subtraction process will frequently produce unwanted reference peaks in the result spectrum. What can we do about this? Fortunately, we can make use of what is called a subtraction factor, or sometimes a scale factor, to solve this problem. The subtraction factor is a number that is multiplied by the absorbances in the reference spectrum to scale it so the reference peaks in the two spectra are the same size. In other words, use of a subtraction factor can take the unwanted situation seen to the right in Figure 2 and give us overlapped peaks as seen to the left in Figure 2.
Using the subtraction factor means the subtraction formula now looks like this:
(Sample) – (Subtraction Factor)(Reference) = Result [4]
and if you look closely in the upper left hand corner of Figure 1, you can see the formula that was used to calculate this subtraction result:
Result = (Glutamine + Water) – (0.96)(Water) [5]
where 0.96 is the subtraction factor. In this case, the absorbances in the water spectrum were multiplied by 0.96 to scale them so they matched the water absorbances in the sample spectrum.
Setting the Subtraction Factor Properly
It is the user’s job to set the subtraction factor properly. This is typically an interactive process using trial subtraction factors wit the result spectrum displayed for analysis. The subtraction factor may be changed via scroll bars, button clicks, or by typing in values. How does one know when the correct subtraction factor has been used? A simple example is shown in Figure 3.
FIGURE 3: (a) A reference peak in a sample spectrum with an absorbance of 0.13 AU. (b) A reference peak in a reference spectrum with a peak height of 0.065 AU. A subtraction factor of 2.0 would work best in this example.
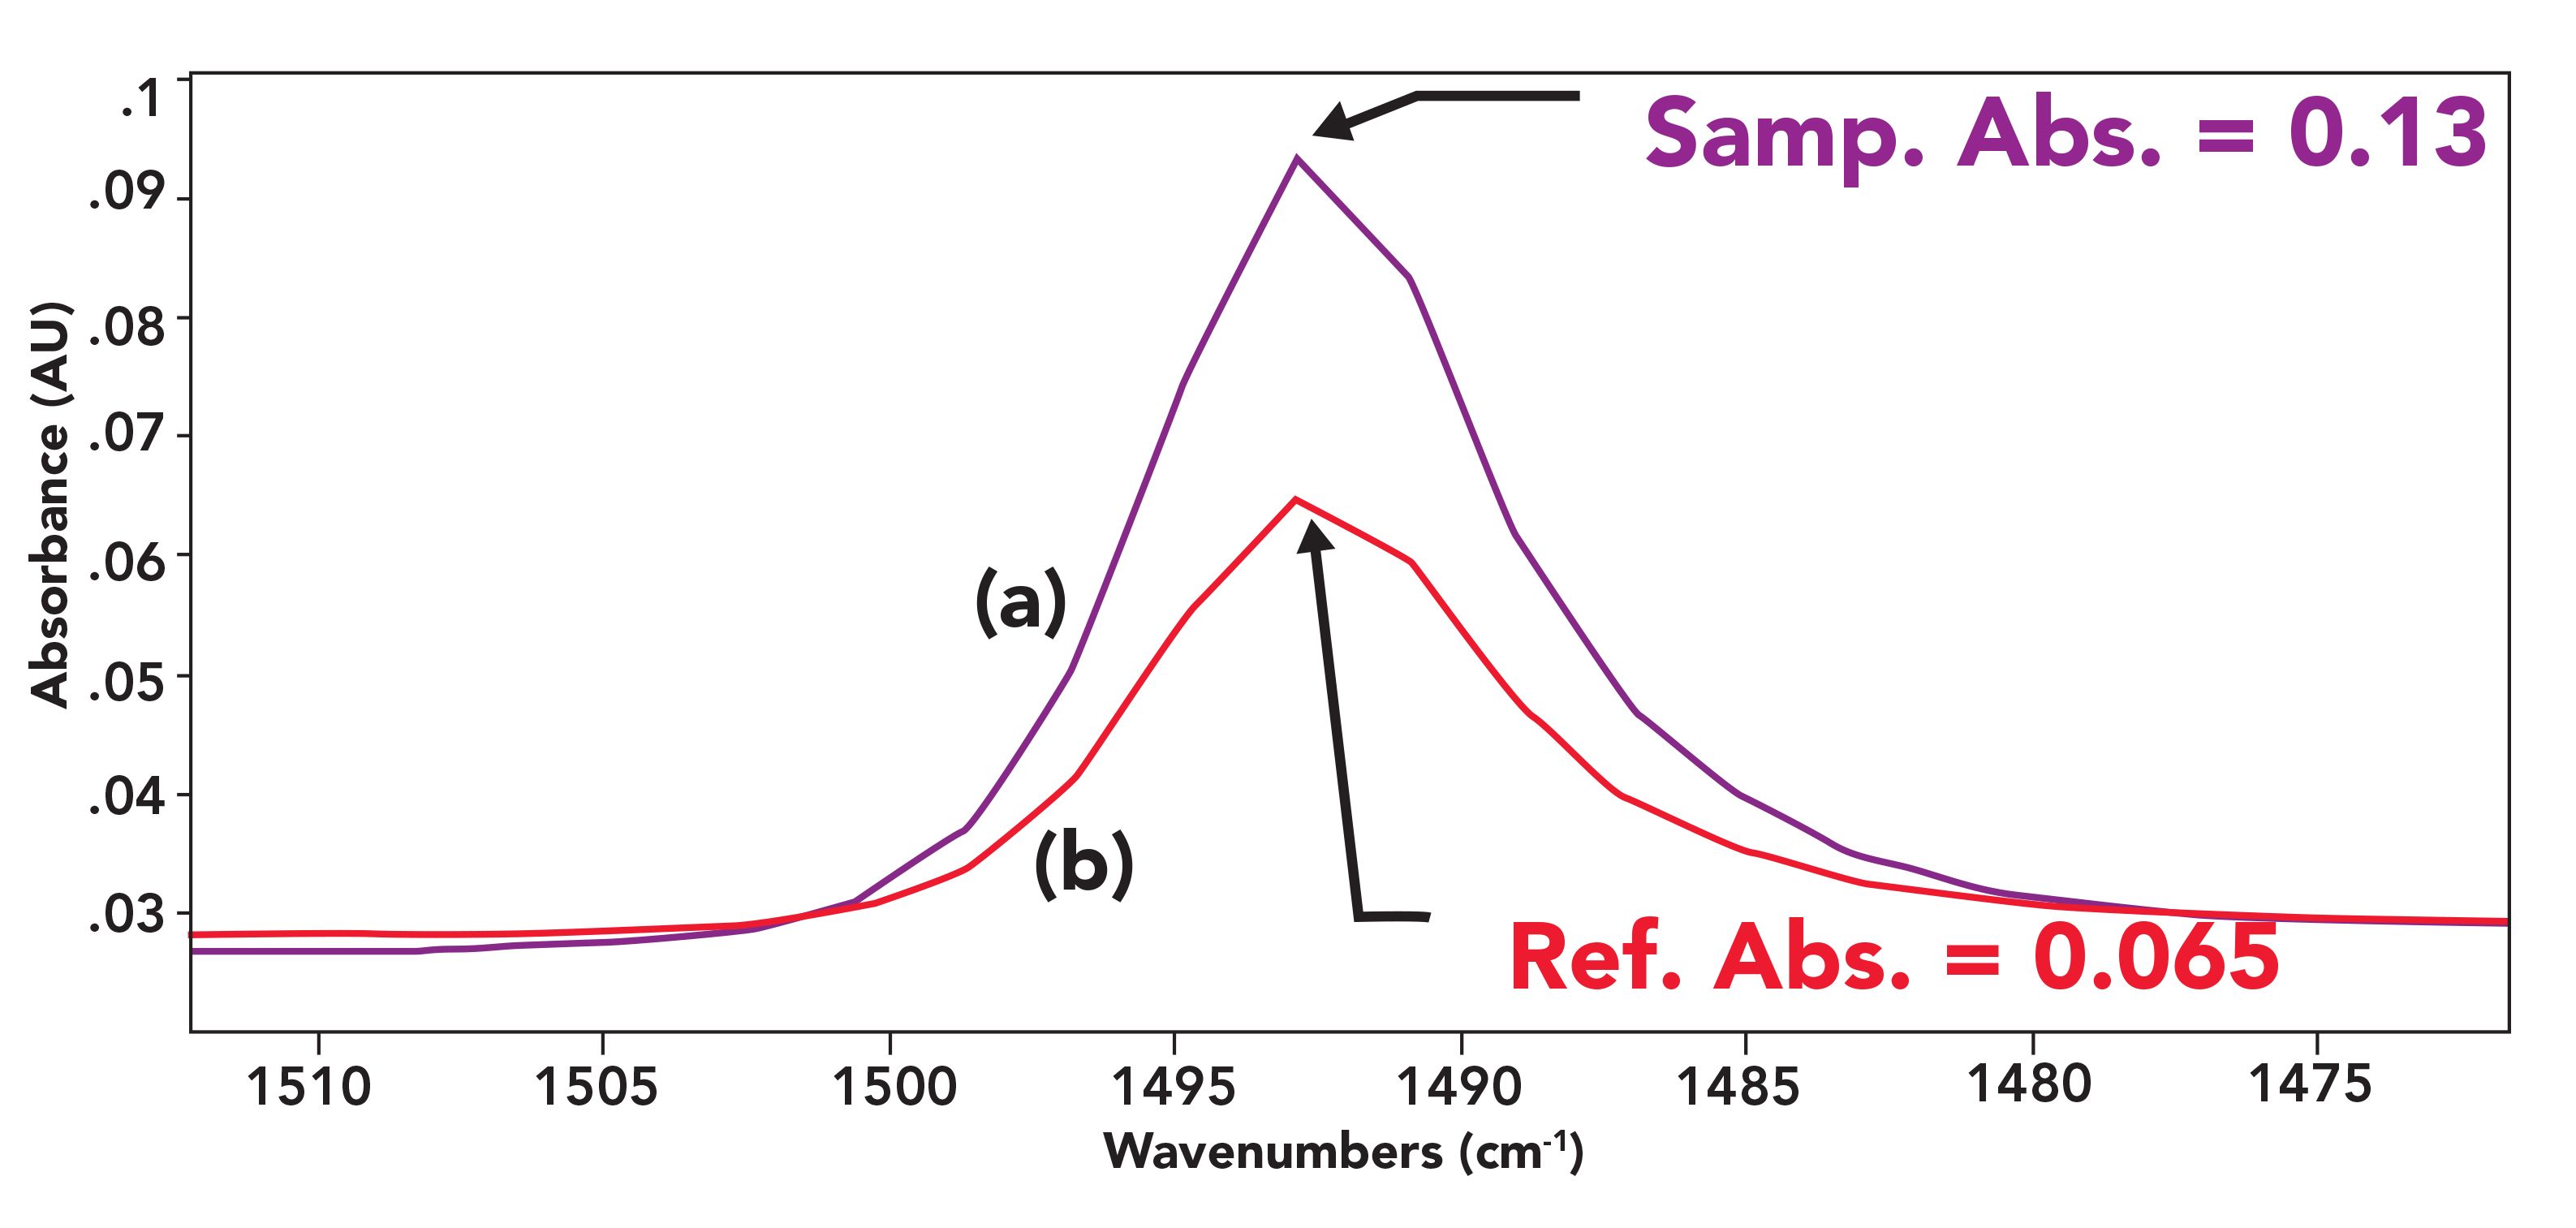
The bottom peak of Figure 3 is from a reference spectrum with a peak height of 0.065 AU, whereas the top spectrum is the same peak in the sample spectrum with a peak height of 0.13 AU. Using a subtraction factor of 2.0 would make the heights of the two peaks both equal to 0.13, and upon subtraction, the result would be 0.0 AU in this spectral region.
What criteria then should you use to set the subtraction factor?
- Compare the sample and reference spectra to each other, looking for peaks present in both spectra with heights of 0.8 AU or less. This is because in general peaks this size or smaller follow Beer’s law, whereas peaks bigger than this may not (3).
- Adjust the subtraction factor until the chosen reference peaks are flat with baseline, that is at 0.0 AU.
- Compare the reference spectrum to the result to identify any unsubtracted reference bands.
Note in this process that the sample is compared to the reference, the subtraction factor is set, and then the reference is compared to the result. As an example, the water spectrum at the bottom of Figure 1 was multiplied by a subtraction factor of 0.96, which was then subtracted from the sample spectrum to produce the result seen at the top of the figure. In Figure 1, the reference peak used was the water scissors vibration peak at 1630 cm-1 as indicated.
Generally, the best results are obtained with subtraction factors in the neighborhood of 1. If you need large positive or negative subtraction factor values for a subtraction to work, you should consider remeasuring the reference spectrum so its absorbances more closely match those of the reference material in the sample spectrum. What if there are multiple reference bands that can be subtracted? In this case, keep an eye on one or more of the peaks while adjusting the subtraction factor. Ideally, they will all go to 0.0 AU at the same factor. However, if this does not happen, you can use a subtraction factor that minimizes the absorbance of most of the reference peaks. If there is a specific spectral region of importance, choosing reference peaks in this region will optimize the result quality there.
The Goldilocks Effect
You may have heard the tale of Goldilocks and the Three Bears as a child (4). In one version of this tale, Goldilocks enters the Three Bears’ house while they are away (could she be charged with felony breaking and entering?). In short order, she tries three chairs, three bowls of porridge, and three beds, and in all cases declares the one in the middle is “just right” in terms of comfort, temperature, and hardness. Maybe Goldilocks was looking for balance in her life? This tendency for things in the middle to be just right is enshrined in an astronomy principle called the Goldilocks principle (5), where a planet that is at the right distance from its star to have a temperature conducive to the development of intelligent life is said to be in the “Goldilocks zone.”
An example of subtraction factors showing the Goldilocks effect, where the factors are too big, too small, and just right, is shown in Figure 4.
FIGURE 4: (a) Results spectrum where the subtraction factor of 0.5 is too small with reference bands pointing up. (b) A results spectrum where the subtraction of 1.8 is just right with reference bands flat with the baseline. (c) A results spectrum where the subtraction factor of 2.2 is too big with reference peaks pointing down. The reference spectrum was polystyrene.
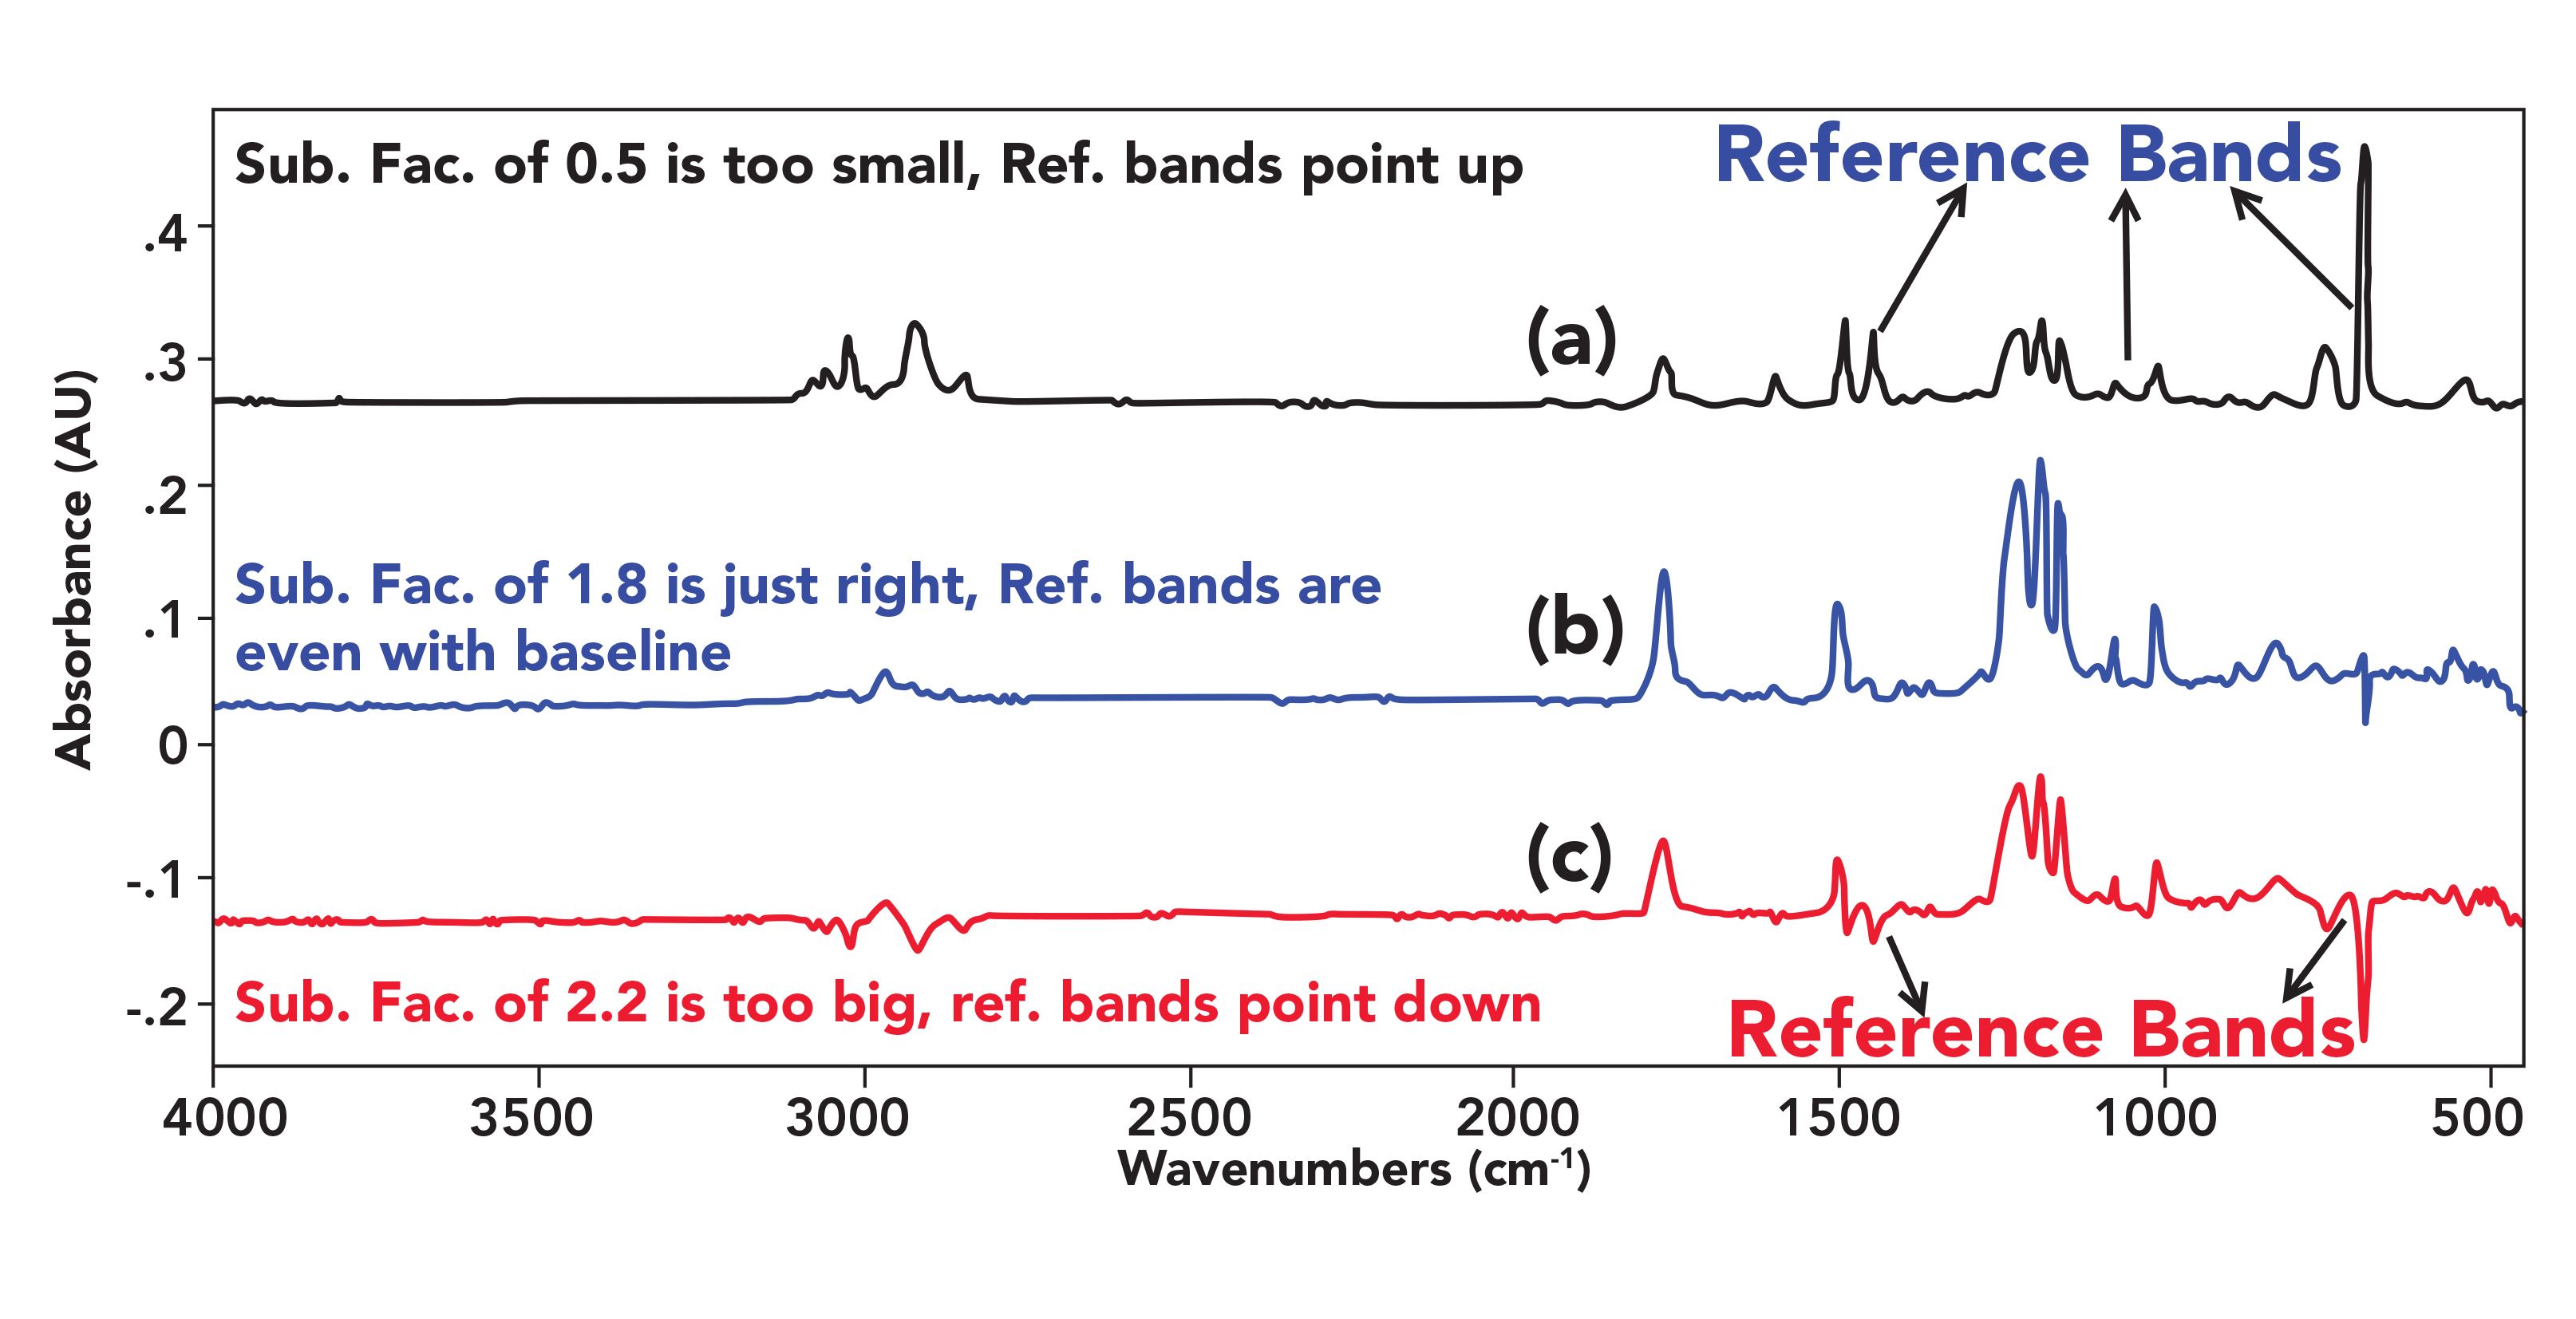
The spectra shown are the result of subtracting a reference spectrum of pure polystyrene from a spectrum of a mixture of polystyrene and another polymer. In the top spectrum, the subtraction factor of 0.5 is too small, resulting in reference peaks in the result pointing up. In the middle spectrum the subtraction factor was 1.8, which is just right because it gives reference peaks flat with the baseline in the result. In the bottom spectrum, the subtraction factor of 2.2 was too big, giving a result with reference peaks pointing down.
The lesson here is that it is incumbent upon the user to follow the process discussed above to set the subtraction properly to obtain the best results.
There’s More! It Even Works on Overlapped Peaks!!
We have established the utility of spectral subtraction for allowing us to analyze mixture spectra. But what about spectra where reference peaks overlap sample peaks? Spectral subtraction can work even in these cases as illustrated in Figure 5.
FIGURE 5: (a) The result after the reference bands have been successfully subtracted out, and (b) a spectrum with two examples of sample and reference bands overlapping.
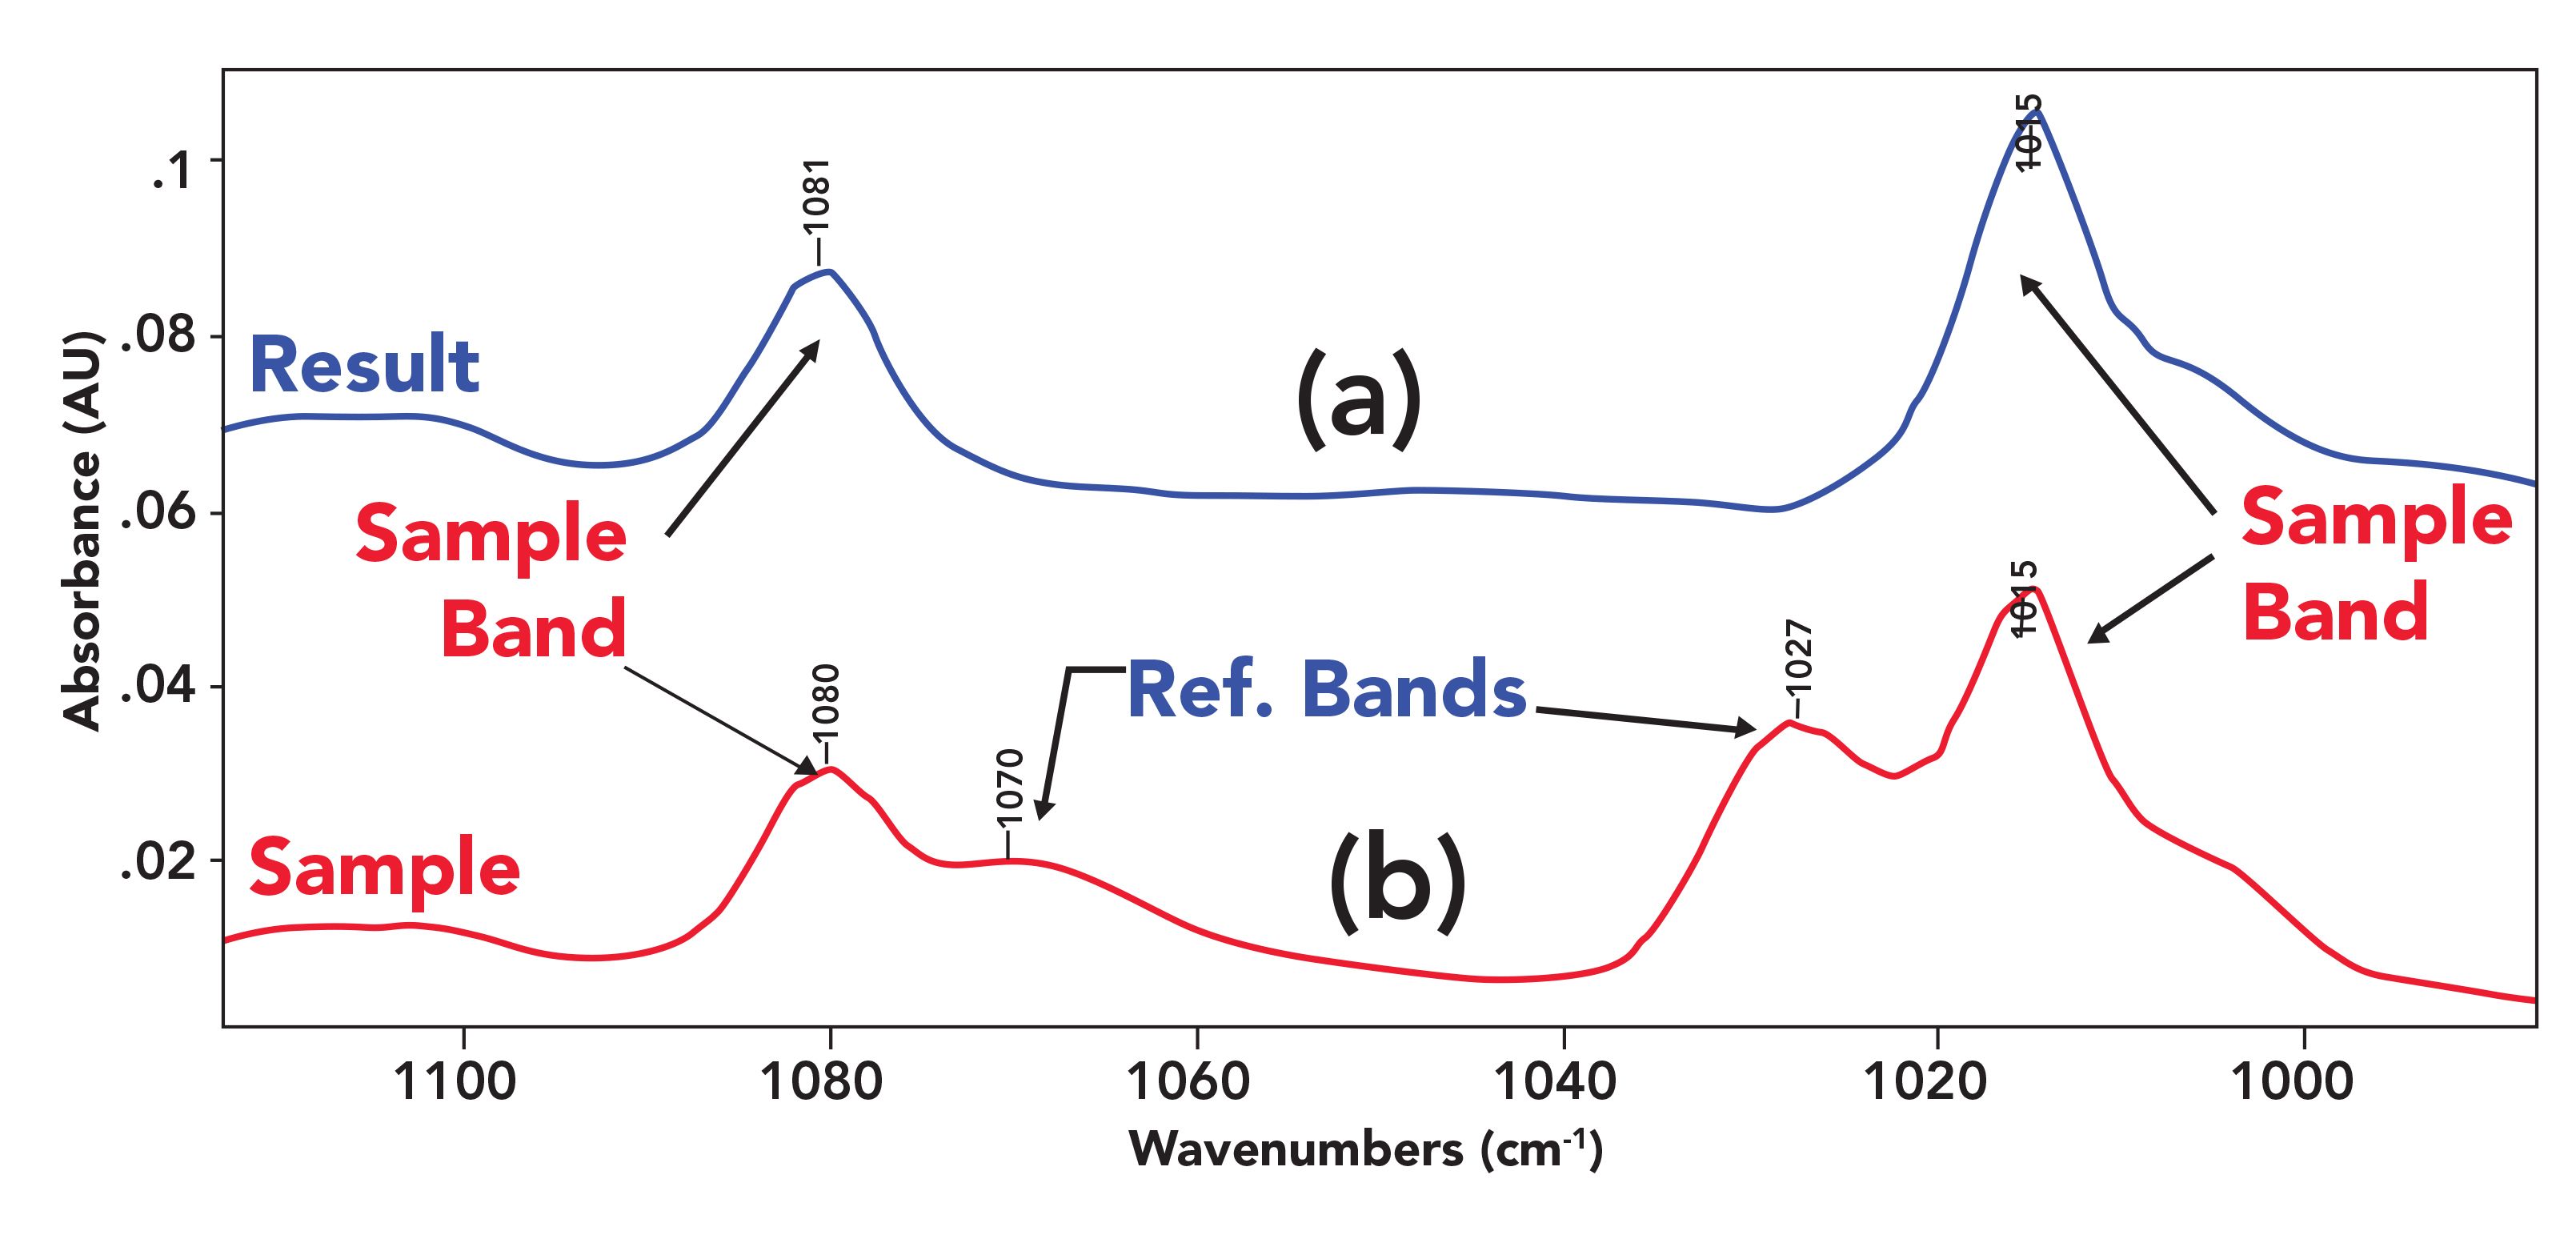
In the bottom spectrum of Figure 5, there are two sets of peaks where the sample and reference peaks overlap; specifically, 1081 and 1015 cm-1 are sample peaks, and 1070 and 1027 cm-1 are reference bands. In the top spectrum, the two reference bands in this spectral region have been successfully subtracted out, leaving the sample peaks clearly visible and mostly unaffected.
Subtraction Artifacts
A problem with performing a subtraction is that the result will have more spectral noise in it than either the sample or reference spectra, as seen at the top of Figure 1. This means that you should only subtract spectra with a good signal-to-noise ratio so as to minimize the noise in the subtraction result. How to optimize spectral quality in IR spectroscopy is discussed in my book on Fourier transform infrared (FT-IR) spectroscopy (6). Subtraction results also suffer from two types of artifacts, unsubtracted reference bands and derivatives.
Unsubtracted Reference Bands
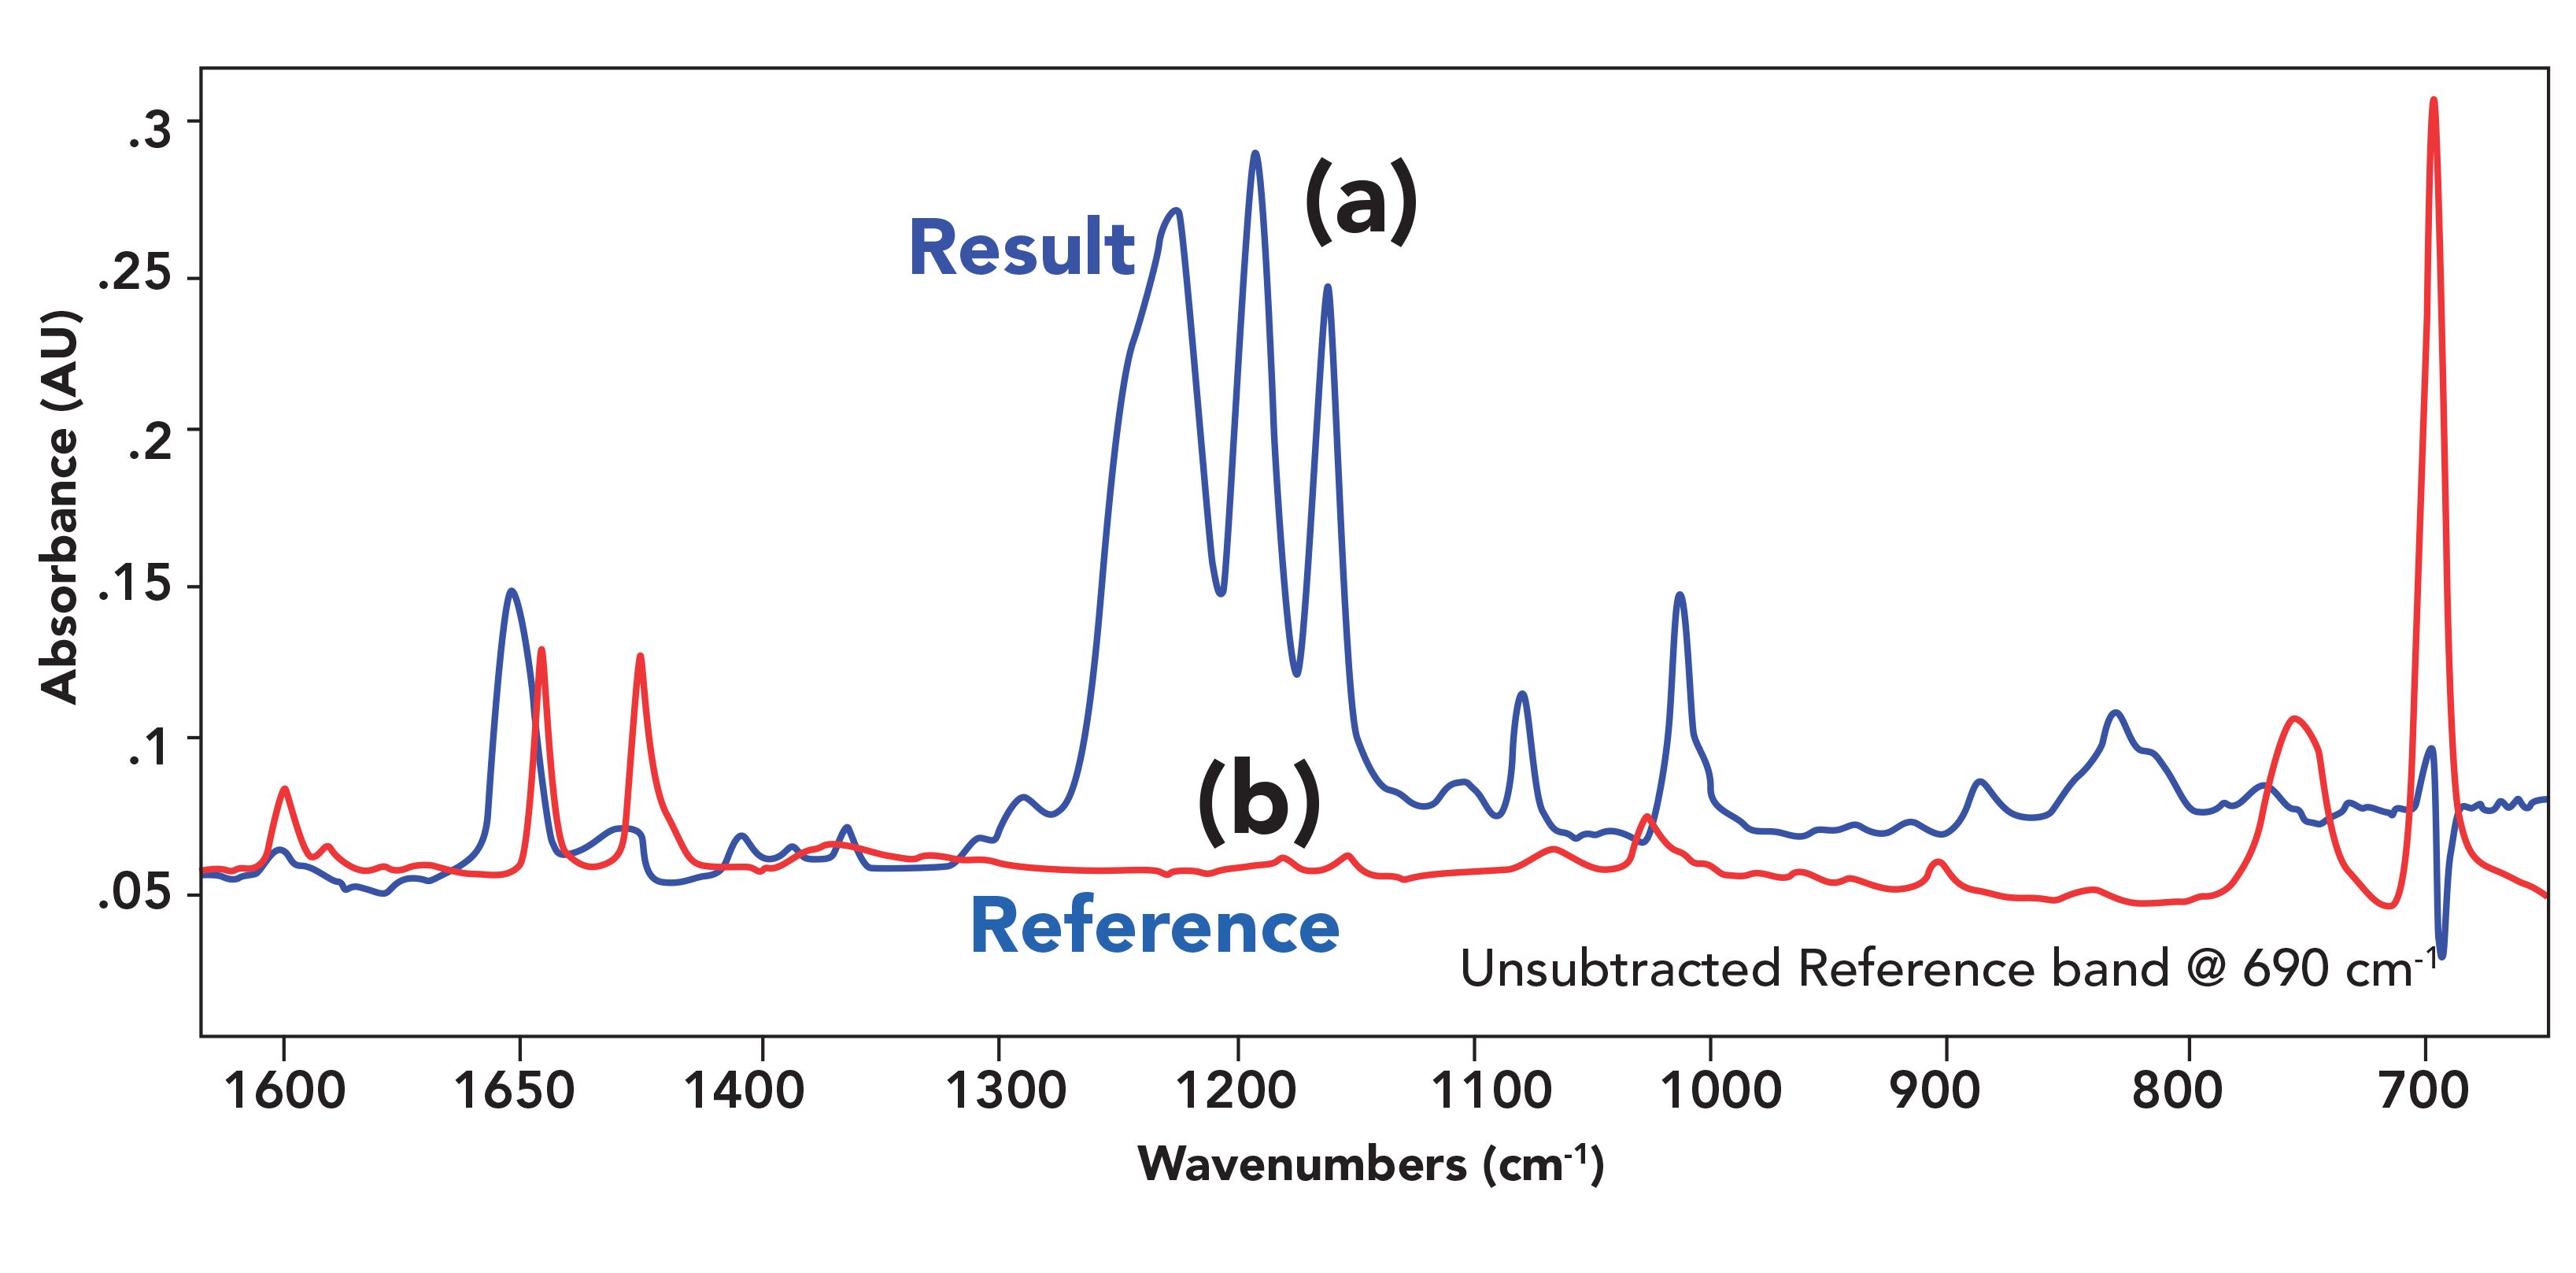
An example of an unsubtracted reference band is seen in Figure 6 at 690 cm-1.
Unsubtracted reference bands occur when the peaks being subtracted do not follow Beer’s law (3). This is a problem for larger peaks, which is why ideally only peaks at 0.8 AU or less should be used to set the subtraction factor. We spot unsubtracted reference bands by comparing the result and reference spectra to each other and note where there are common peaks as seen in Figure 6. Unfortunately, we cannot force a spectrum to follow Beer’s law, so the only way to deal with unsubtracted reference bands is to learn to recognize and ignore them.
FIGURE 6: (a) A subtraction result with an unsubtracted reference band at 690 cm-1, and (b) A portion of a reference spectrum of polystyrene.
Derivative Shaped Bands
An example of a derivative shaped band is seen in Figure 7.
FIGURE 7: (a) A sample spectrum of a solution of Sepharose in water, (b) a reference spectrum of pure liquid water, and (c) their subtraction result.
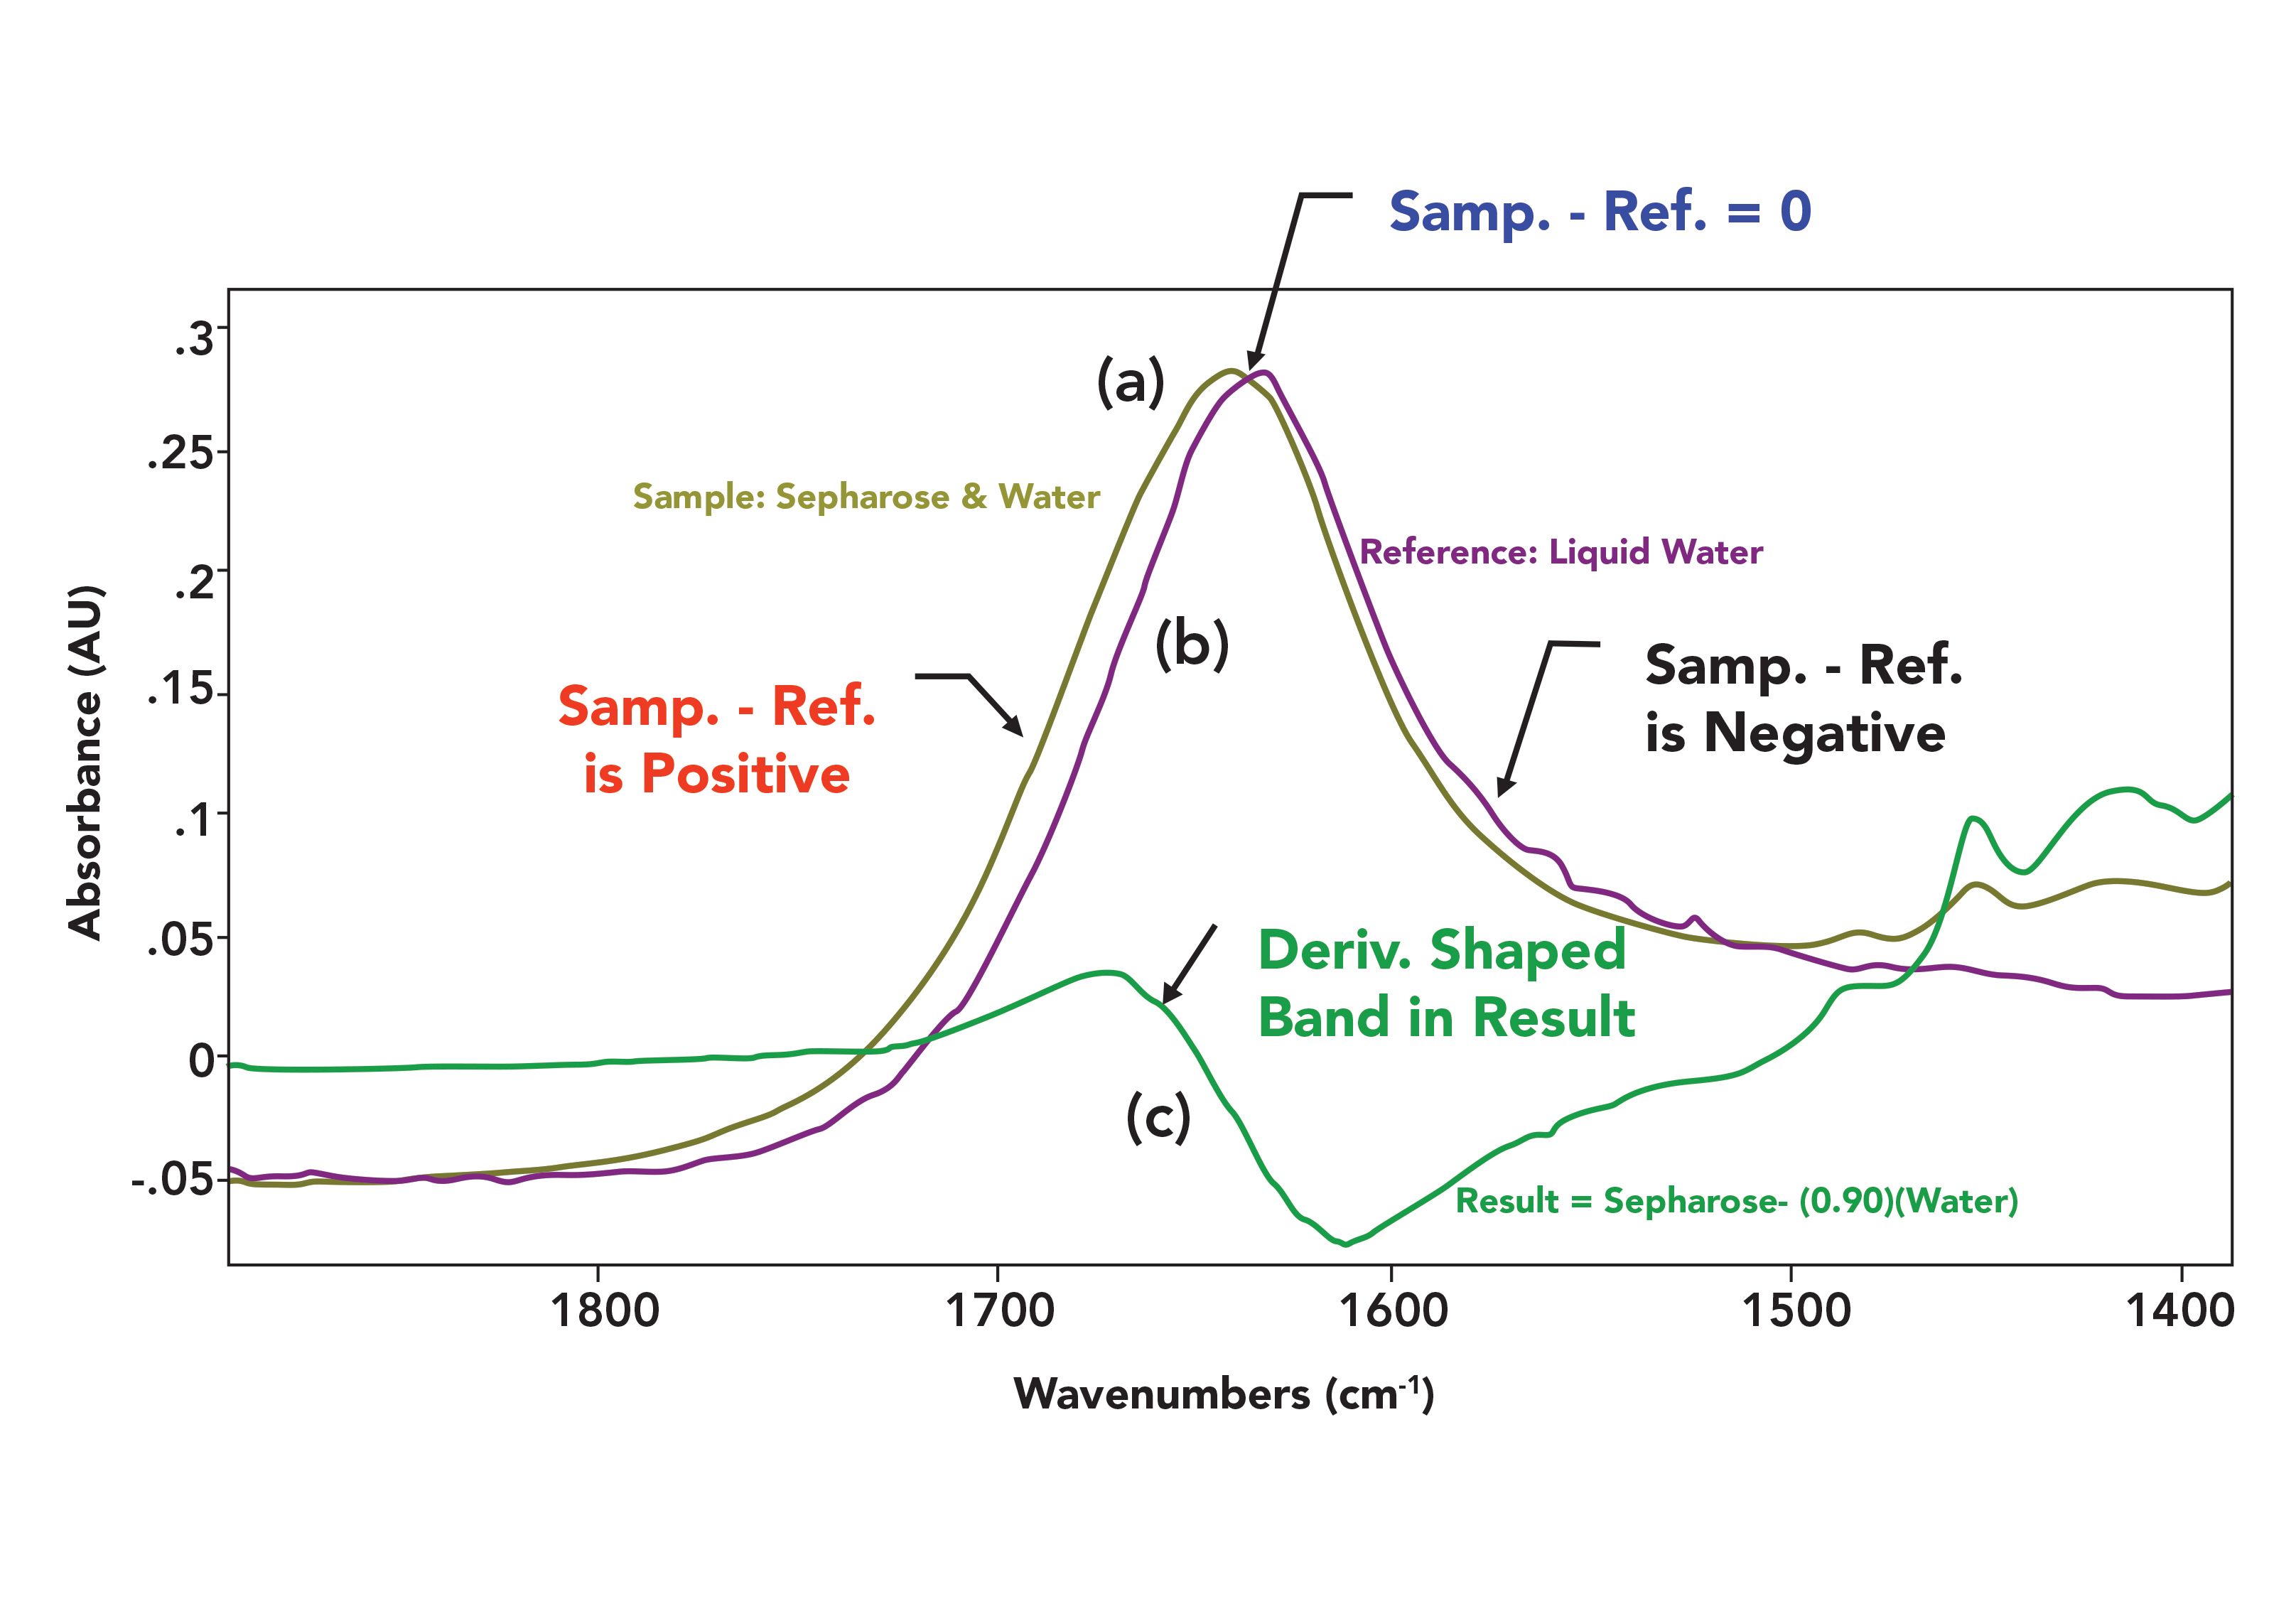
The sample spectrum is of the material Sepharose dissolved in water. The reference spectrum is of pure liquid water. Note that in its pure form there is a water peak at 1630 cm-1, but in the spectrum of the sepharose solution, this water peak has shifted to higher wavenumber and now appears at about 1640 cm-1. Why does water have different peak positions in these cases? It is because of what I call the dirty little secret of infrared spectroscopy, that spectral features are matrix-sensitive. That is, changes in variables such as temperature, pressure, pH, and composition can impact spectral appearance because the absorptivity is sensitive to these variables (3). In Figure 7, the interaction of the sepharose molecules with the water causes water’s peak position to shift.
Note in Figure 7 that to the left, the absorbances of the mixture are greater than those of the reference. Thus, the subtraction result is positive, giving a positive lobe in the result spectrum seen in the bottom of the figure. At the point indicated where the two spectra cross, they have the same absorbance, hence the subtraction result at this wavenumber is 0.0 AU. Lastly, to the right the sample absorbances are smaller than the reference absorbances, which is why there is a negative lobe in the result. Thus, the result goes above zero, crosses zero, and then goes below zero-which what the first derivative of an absorbance peak looks like (6). Hence, the term derivative shaped band is used to describe these features in subtraction results. Because the matrix effects that cause peak shifts cannot be avoided, there is nothing that can be done about derivative-shaped peaks except learning to recognize and ignore them.
Is Spectral Subtraction Legitimate?
I frequently teach spectral subtraction to forensic scientists. Their concern, born of experience dealing with clever defense attorneys, is that since the subtraction factor is a user adjustable parameter, it can be arbitrarily set to obtain whatever results are desired. In other words, is spectral subtraction scientifically legitimate?
The way I rebut this is to point out that the sample spectrum contains contributions from the reference material and other components. When performed properly, the reference material peaks will be absent from the result spectrum, allowing users to more clearly see that which was already present in the spectrum. For this reason, spectral subtraction is scientifically legitimate. Of course, the magic words here are “...when performed properly.” However, now that you have read this column, you now know how to use spectral subtraction properly.
Conclusions
Spectral subtraction is a useful and legitimate way of allowing users to analyze mixture spectra. The process involves subtracting a reference spectrum of a pure material present in a sample from the spectrum of a mixture to obtain a result spectrum. Typically, a subtraction factor is multiplied times the reference spectra absorbances to compensate for differences in reference material peak heights between sample and reference spectra, improving subtraction results. How to properly set the subtraction factor was discussed. We also showed that subtraction works well on overlapped peaks. Subtraction results suffer from increased noise, unsubtracted reference bands, and derivative shaped peaks. There is not much to be done about these except to learn to recognize them and ignore them.
References
(1) B.C. Smith, Spectroscopy 36(3), 24–27 (2021).
(2) B.C. Smith, Infrared Spectral Interpretation: A Systematic Approach (CRC Press, Boca Raton, Florida, 1999).
(3) B.C. Smith, Quantitative Spectroscopy: Theory and Practice (Elsevier, Boston, Massachusetts, 2002).
(4) Goldilocks and the Three Bears - Wikipedia
(5) Goldilocks principle - Wikipedia
(6) B.C. Smith, Fundamentals of Fourier Transform Infrared Spectroscopy, 2nd Edition, (CRC Press, Boca Raton, Florida, 2011).
Brian C. Smith, PhD, is the founder and CEO of Big Sur Scientific, a maker of portable mid-infrared cannabis analyzers. He has over 30 years experience as an industrial infrared spectroscopist, has published numerous peer-reviewed papers, and has written three books on spectroscopy. As a trainer, he has helped thousands of people around the world improve their infrared analyses. In addition to writing for Spectroscopy, Dr. Smith writes a regular column for its sister publication Cannabis Science and Technology and sits on its editorial board. He earned his PhD in physical chemistry from Dartmouth College. He can be reached at: SpectroscopyEdit@MMHGroup.com ●


AI Shakes Up Spectroscopy as New Tools Reveal the Secret Life of Molecules
April 14th 2025A leading-edge review led by researchers at Oak Ridge National Laboratory and MIT explores how artificial intelligence is revolutionizing the study of molecular vibrations and phonon dynamics. From infrared and Raman spectroscopy to neutron and X-ray scattering, AI is transforming how scientists interpret vibrational spectra and predict material behaviors.
Real-Time Battery Health Tracking Using Fiber-Optic Sensors
April 9th 2025A new study by researchers from Palo Alto Research Center (PARC, a Xerox Company) and LG Chem Power presents a novel method for real-time battery monitoring using embedded fiber-optic sensors. This approach enhances state-of-charge (SOC) and state-of-health (SOH) estimations, potentially improving the efficiency and lifespan of lithium-ion batteries in electric vehicles (xEVs).
New Study Provides Insights into Chiral Smectic Phases
March 31st 2025Researchers from the Institute of Nuclear Physics Polish Academy of Sciences have unveiled new insights into the molecular arrangement of the 7HH6 compound’s smectic phases using X-ray diffraction (XRD) and infrared (IR) spectroscopy.