A Fingerprint in a Fingerprint: A Raman Spectral Analysis of Pharmaceutical Ingredients
The fingerprint region in mid-infrared (IR) and Raman spectroscopy, typically between 300 to 1900 cm-1, is used to characterize molecules by utilizing their vibrational and rotational changes in this region. In this study, a smaller subset of this Raman spectral region was evaluated for its significance in characterizing pharmaceutical products. This narrower region from 1550 to 1900 cm-1 in the Raman spectrum will further be defined as the “fingerprint in the fingerprint” region. A spectral evaluation was conducted on active pharmaceutical ingredients (APIs) in prescription drugs, over-the-counter drugs, and pharmaceutical drug products. Qualitative and quantitative analysis was performed on these products to gain an understanding of this spectral region. The qualitative results showed no Raman spectral signals in this region for any of the common excipients. Additionally, all APIs evaluated had unique Raman vibrations and spectral signals in this region. This data indicates that the 1550–1900 cm-1 Raman spectral region is ideal for API identity testing. Furthermore, the data indicate the potential of this spectral region for differentiation and classification of API content in different strengths of a given drug product.
The fingerprint region, typically between 300–1900 cm-1 in Raman spectroscopy, is often used for identification or authentication testing of raw materials, excipients, and active pharmaceutical ingredients (APIs) in drug products for quality control (QC) release testing. It is also used for forensic applications, such as screening suspect or counterfeit products (1). The “fingerprint in the fingerprint” is a specific spectral region (1550–1900 cm-1) in Raman spectroscopy that can be used for the identity testing of pharmaceutical products, especially APIs. This narrower spectral region can strengthen the Raman capabilities of identity testing by providing the enhanced specificity needed to identify APIs in a drug product. In this spectral region, Raman signals from a variety of prescription and over-the-counter APIs are present, whereas many pharmaceutical excipients do not have Raman signals in this region. This observation leads to the conclusion that this spectral region in Raman spectroscopy is a valuable tool that could be utilized for pharmaceutical qualitative and quantitative testing, such as identity, assay, and content uniformity.
Prior to advancements in infrared (IR) and Raman vibrational spectroscopy, identity testing of pharmaceutical products was performed via chromatography. The most widely used technique for quantitative analyses is high performance liquid chromatography (HPLC), but HPLC is typically used to quantify APIs in drug products rather than excipients (2). Monitoring excipients can be beneficial, especially when it affects quality elements like dissolution (2). Chromatography also has limitations like extensive sample preparation and long analysis times. IR spectroscopy is an alternative for chromatography techniques and is commonly used for identity testing, structural elucidation, and quantitation (3). IR spectroscopy is cost efficient, has shorter analysis times, and requires little or no sample preparation when compared to HPLC. Additionally, IR spectroscopy has high spectral resolution and good signal-to-noise (S/N) ratios, which make it an effective technique for identity testing of pharmaceutical ingredients.
Raman spectroscopy is another analytical technique that can be used for identity testing in the pharmaceutical industry. This nondestructive technique requires almost no sample preparation, provides short analysis times, and enables easy operation (4). A variety of materials can be analyzed via Raman spectroscopy such as solid dosage products, bulk products, or aqueous solutions. Solid dosage formulations are more commonly evaluated via Raman spectroscopy as opposed to aqueous solutions. However, water has a weak Raman signal that does allow for analyzing biological products if needed (4). New advancements in portable Raman spectroscopy also allows for bulk products to be tested directly through their respective packaging, such as plastic liners in drums containing raw materials or excipients or blister packs for drug products. The rapid identification of drug products (5), active ingredients, and excipients are all available using Raman spectroscopy and are being accepted more widely in the pharmaceutical industry.
In this article, the “fingerprint in the fingerprint” (1550–1900 cm-1) spectral region in Raman spectroscopy is explored for both prescription and over-the-counter solid dosage forms. A solid dosage product is a powder, capsule, or tablet that contains an API and a range of excipients at varying levels (2). This narrow spectral region can be used for identification and may even be used for assay or content uniformity monitoring, which are critical quality attributes for pharmaceutical products (6). The purpose of this study is to show the importance of this spectral fingerprint region in Raman spectroscopy, and how it can be leveraged for pharmaceutical applications.
Experimental
Raman Instrumentation
Raman spectra were collected using a Thermo Nicolet NXR 6700 FT-Raman spectrometer with a microstage attachment. The microstage was replaced with a 180 reflectance attachment for the quantitative analysis experiments. A 1064-nm laser source was focused on each sample and a laser power of approximately 0.5 W and 1.0 W were used for the microstage and 180 reflectance attachments, respectively. The scattered light was transferred through the interferometer and bench optics before being collected by an indium gallium arsenide (InGaAs) detector. The Raman signals were collected at a spectral resolution of 4 cm-1 and at a spectral range of 150–3700 cm-1. Spectral calibration was performed via the Thermo ValPro qualification system, which qualifies the spectrometer, sampling module, and analysis software for use.
Software
Omnic spectral software (version 9.8) was used to analyze the acquired Raman data. Unscrambler (version 10.4) was used for principal component analysis (PCA) modeling. Preprocessing for the PCA modeling included standard normal variate (SNV) transformation and a first derivative transformation, which was followed by a second order polynomial fit with nine-point smoothing.
Reference Products
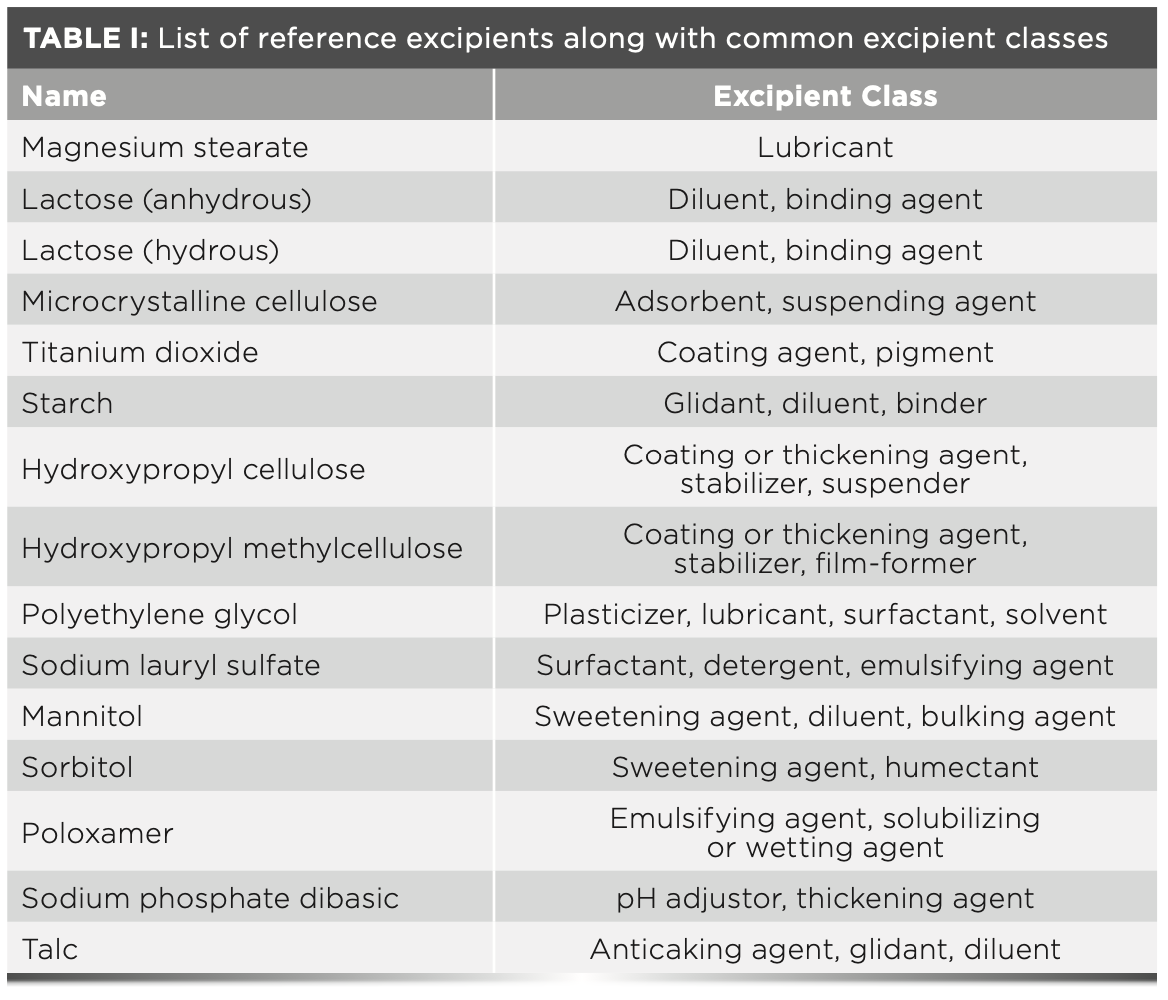
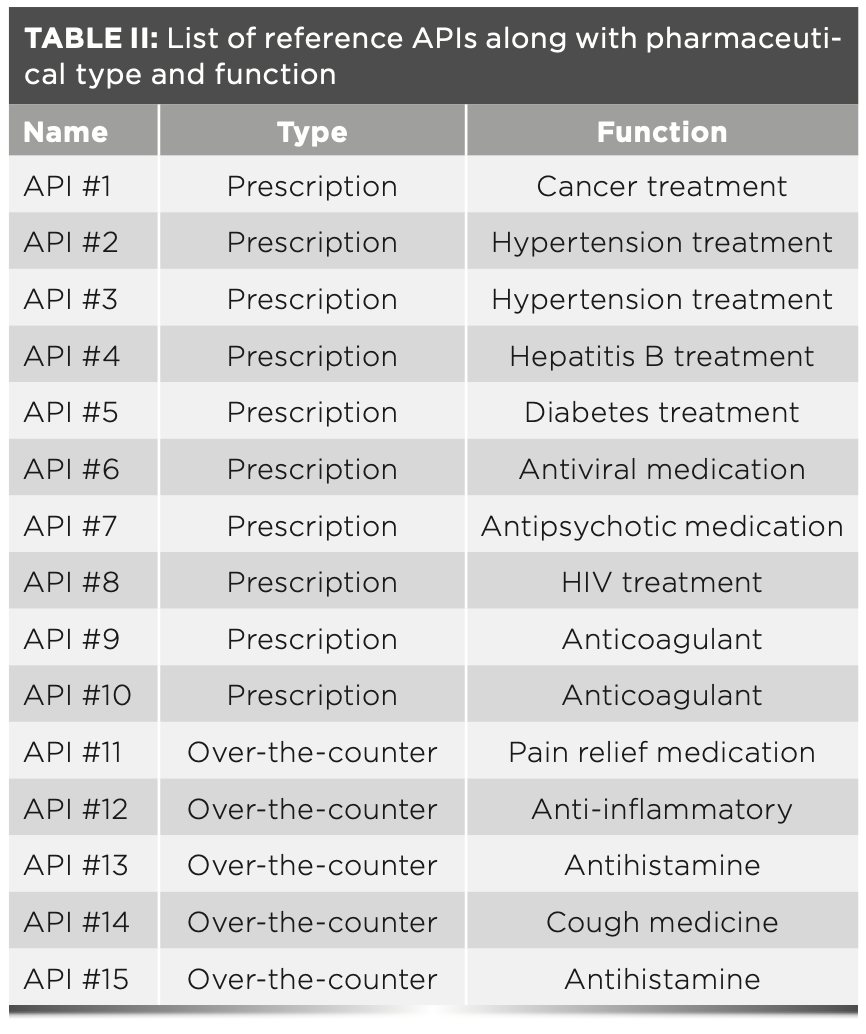
Table I lists the 15 reference excipients evaluated in this article along with their common excipient class. All reference excipients were chosen from the Thermo Scientific Pharmaceutical Excipients FT-Raman library database. This library contains 300 Raman spectra collected on materials which have passed the United States Pharmacopoeia (USP) compendium methodology testing for identity and purity (7). Table II lists the 15 reference APIs evaluated in this article along with their respective drug product categories and functions. The APIs selected ranged from prescription to over-the-counter medications, which are used to treat a variety of health concerns. They are all small molecules and are not the drug substances used in protein-based biologics products. The API spectra were collected in our laboratory via the parameters outlined in the Raman instrumentation section of this article.
Results and Discussion
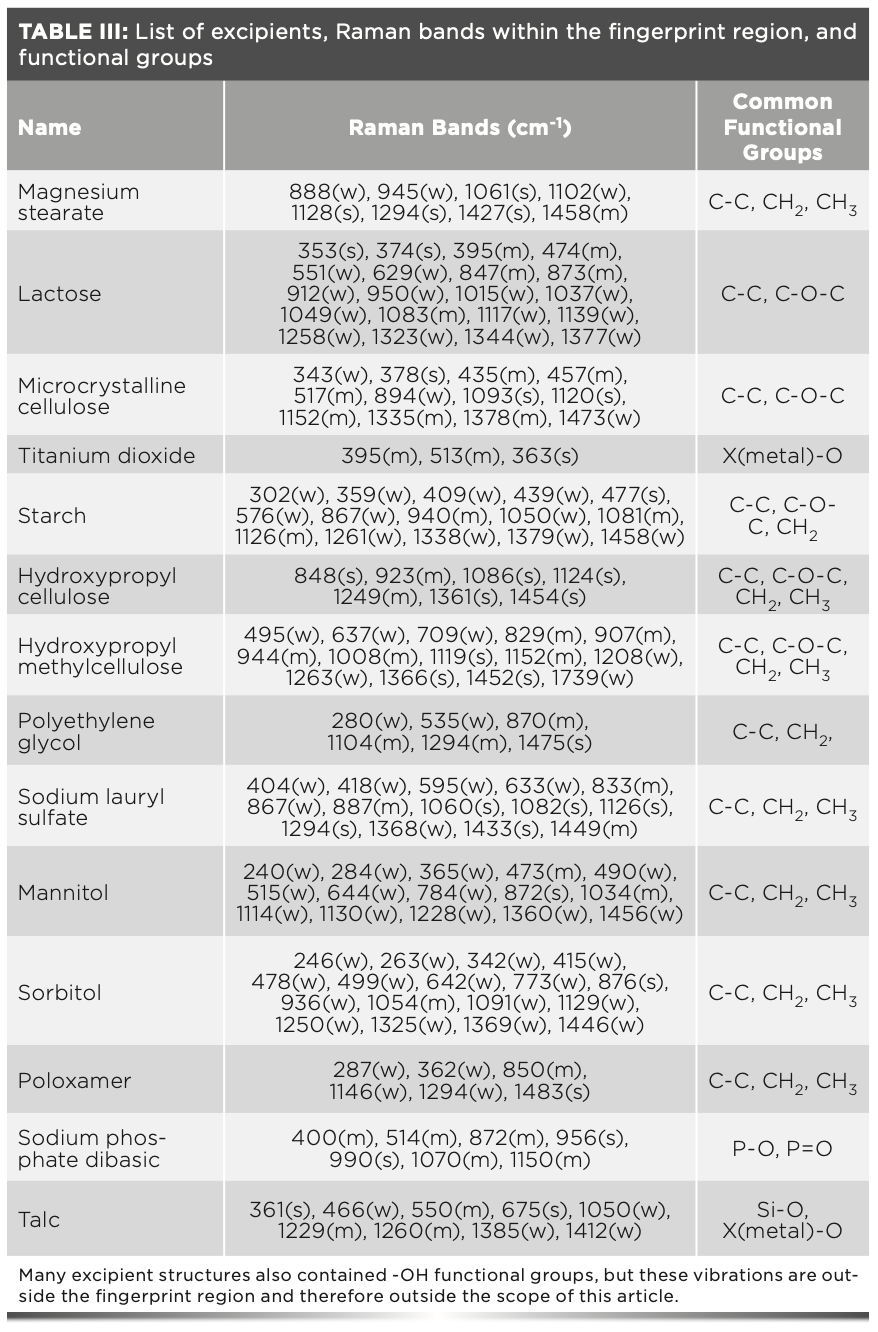
The following results are classified into two categories: 1) excipients and 2) APIs. The excipients outlined in Table I were chosen based on the most common inactive ingredients listed in the formulations for 30 reviewed drug products. The APIs outlined in Table II were chosen by selecting a variety of both prescription and over-the-counter medications with a range of functions. Raman data for each category are listed; the Raman band assignments are listed in the literature (8,9).
Pharmaceutical Excipients
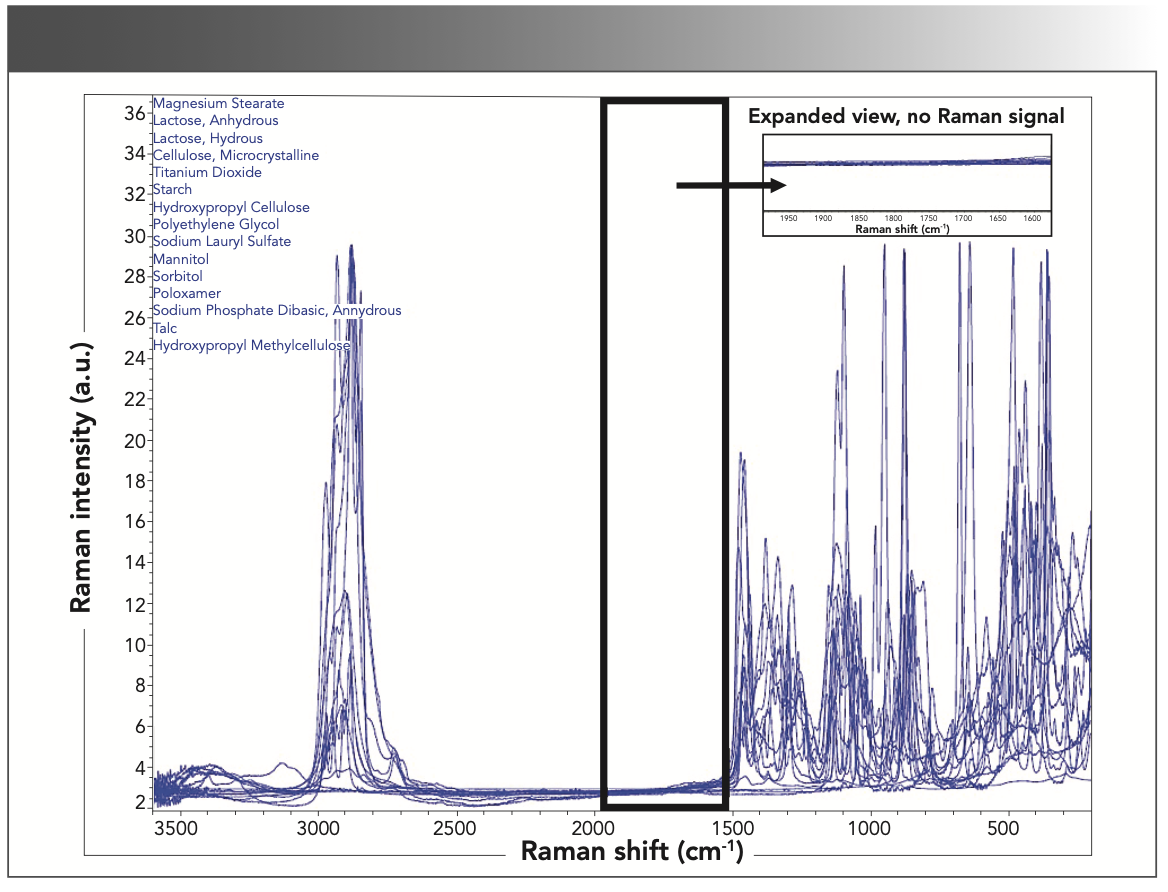
The first group of compounds analyzed were pharmaceutical excipients. These inactive ingredients have a range of functions in drug product formulations including lubricants, coating compounds, emulsifying agents, absorbents, and diluents. Magnesium stearate was the most common excipient observed. Magnesium stearate is used as a lubricant in tablet and capsule formulations and has strong Raman bands at 1061 cm-1, 1128 cm-1, 1294 cm-1, and 1437 cm-1. These bands can all be assigned to C-C stretching vibrations, both asymmetric and symmetric and CH2 and CH3 deformation (8). The most common coating excipient observed was titanium dioxide. Titanium dioxide is used as a coating agent, whitener, and pigment in pharmaceutical products. Raman bands are observed at 636 cm-1 and 513 cm-1, which correlate to TiO2 bending and stretching vibrations, respectively (8). Another used excipient was lactose. Lactose is widely used as a binding agent or diluent in tablet and capsule formulations. Lactose also has a variety of Raman bands that can all be assigned to C-C, C-O, and C-H bond vibrations (8). The Raman spectra (Figure 1) of the 15 common excipients evaluated in this study, and the corresponding Raman band assignments are outlined in Table III. All 15 excipients did not have any Raman signals in the defined 1550–1900 cm-1 spectral fingerprint region.
FIGURE 1: Overlapping Raman spectra of 15 common excipients, with the 1550–1900 cm-1 spectral region highlighted.
Active Pharmaceutical Ingredients (APIs)
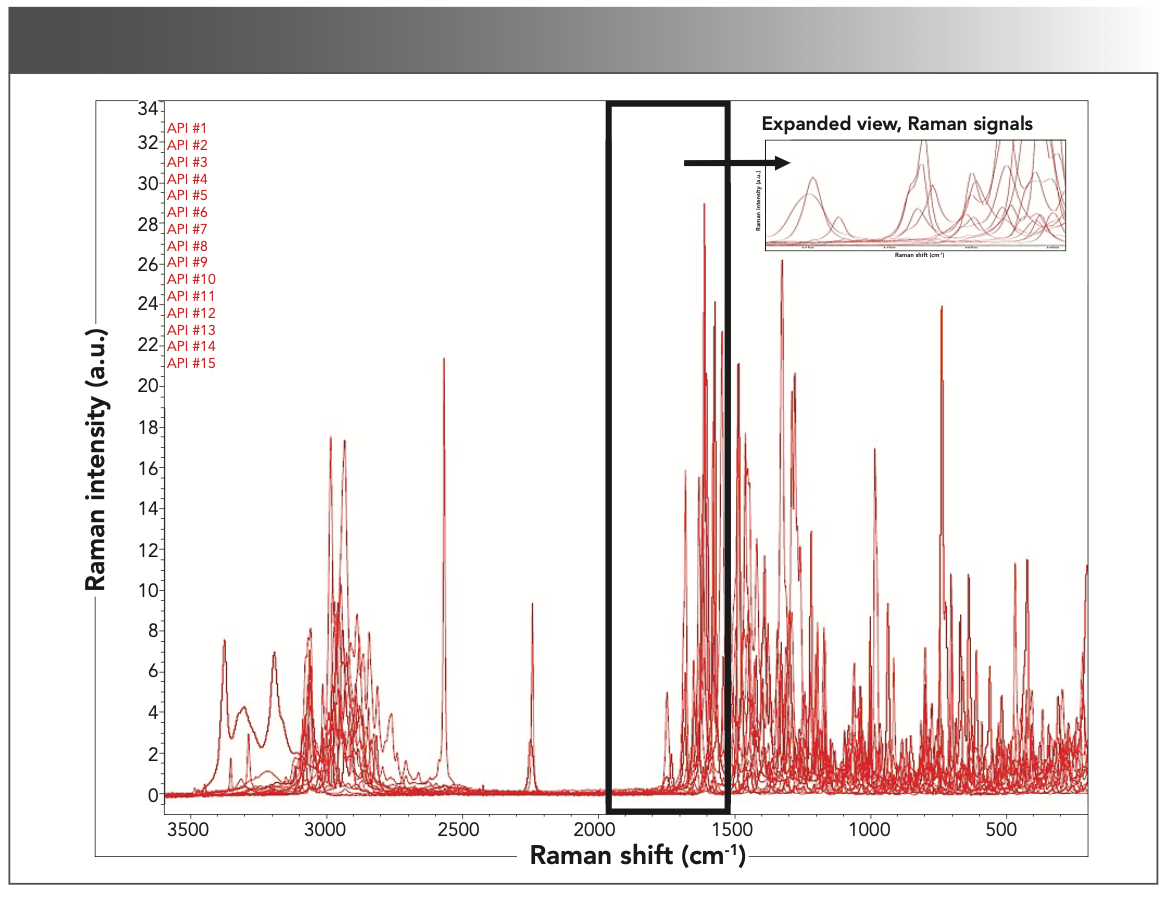
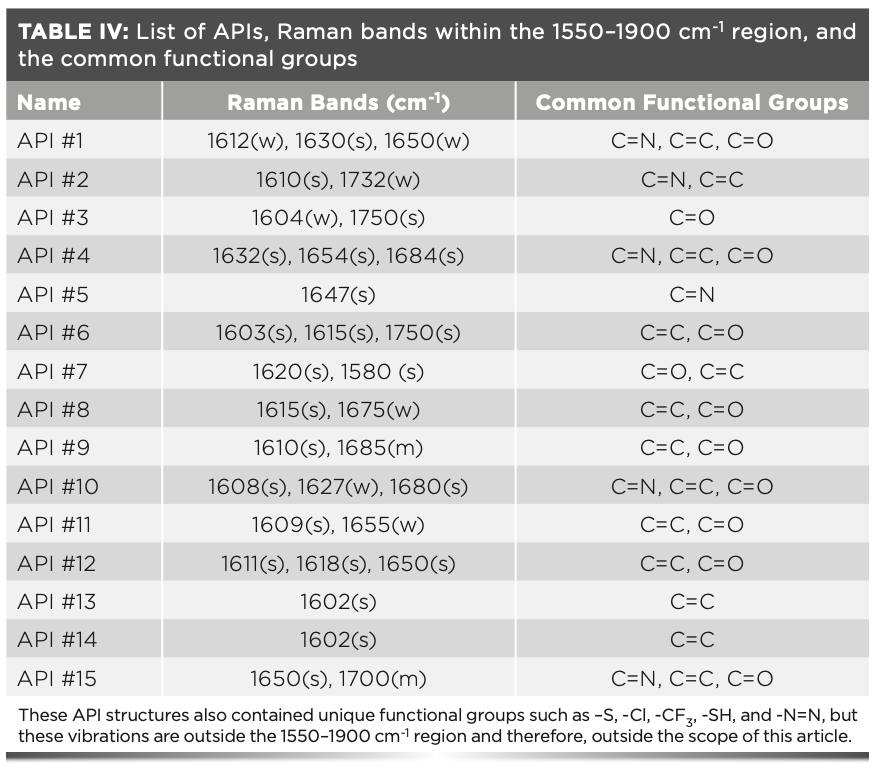
The second group of compounds analyzed were APIs. These active ingredients are used in a variety of drug products, which range from cancer and diabetes treatments to over-the-counter pain relievers and antihistamines. All these drug products have most of the common excipients listed in Table III. The main spectral differences between these compounds and excipients is that the APIs have Raman vibrations located within the 1550–1900 cm-1 region. Some functional groups that correlate to API peaks within this narrow region are C=N vibrations (1610–1680 cm-1), C=O vibrations (1680–1820 cm-1), and N=N vibrations observed at approximately 1580 cm-1. These Raman signals are uniquely typical for APIs and are not present in common excipients. Additionally, it was noted that API #4 had a strong Raman signal at approximately 2250 cm-1 that correlates to a C≡N stretching vibrational mode. All 15 active ingredients analyzed in this article had unique Raman signals in the defined 1550–1900 cm-1 spectral fingerprint region. The Raman spectra (Figure 2) and corresponding Raman band assignments (Table IV) are outlined below.
FIGURE 2: Overlapping Raman spectra of 15 common APIs, with the 1550– 1900 cm-1 spectral region highlighted.
Comparison of Pharmaceutical Ingredients
The following spectra in Figures 3 and 4 compare the Raman signals within the 1550–1900 cm-1 region for both excipients and APIs. As previously mentioned, the 15 excipients analyzed did not have Raman signals within this range whereas the 15 APIs analyzed did, which is an important characteristic of the 1550–1900 cm-1 spectral region because the only Raman signals residing in this region are from the APIs. There are no interferences from the excipients in this region; therefore, they can be leveraged for API identity testing in a drug product. The differences in Raman signals between the two groups of compounds are because a variety of factors such as structure, functional groups, and types of bond or group vibrations. Most excipients, with the exception of a few, were comprised of carbon, oxygen, and hydrogen. The APIs had more complex structures and comprised of additional elements such as nitrogen, phosphorus, and halogens. Figure 3 shows an overlay of the Raman spectra from the 15 excipients and 15 APIs in 1550–1900 cm-1 region.
FIGURE 3: Overlapping Raman spectra of the excipients and the APIs in 1550– 1900 cm-1 spectral region.
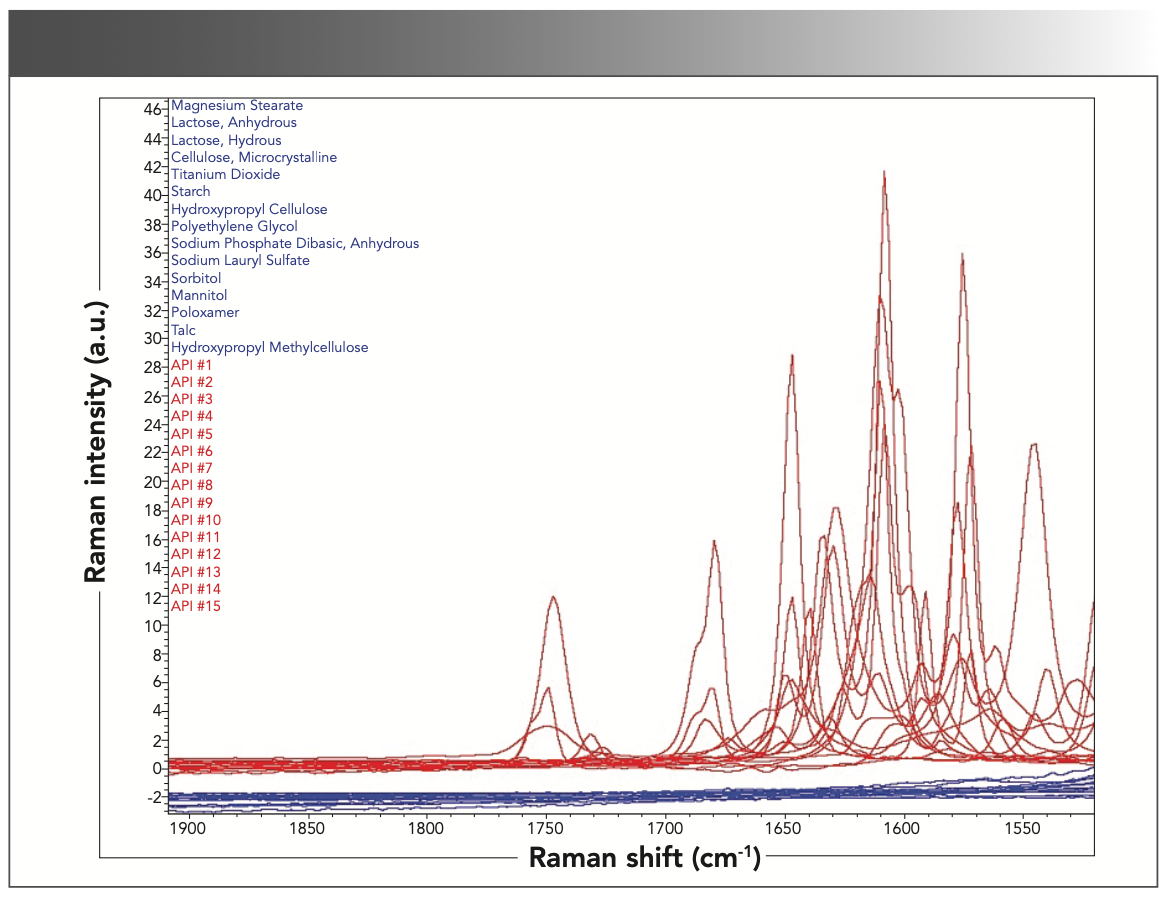
FIGURE 4: Overlapping Raman spectra of excipients and drug products in the 1550–1900 cm-1 spectral region.
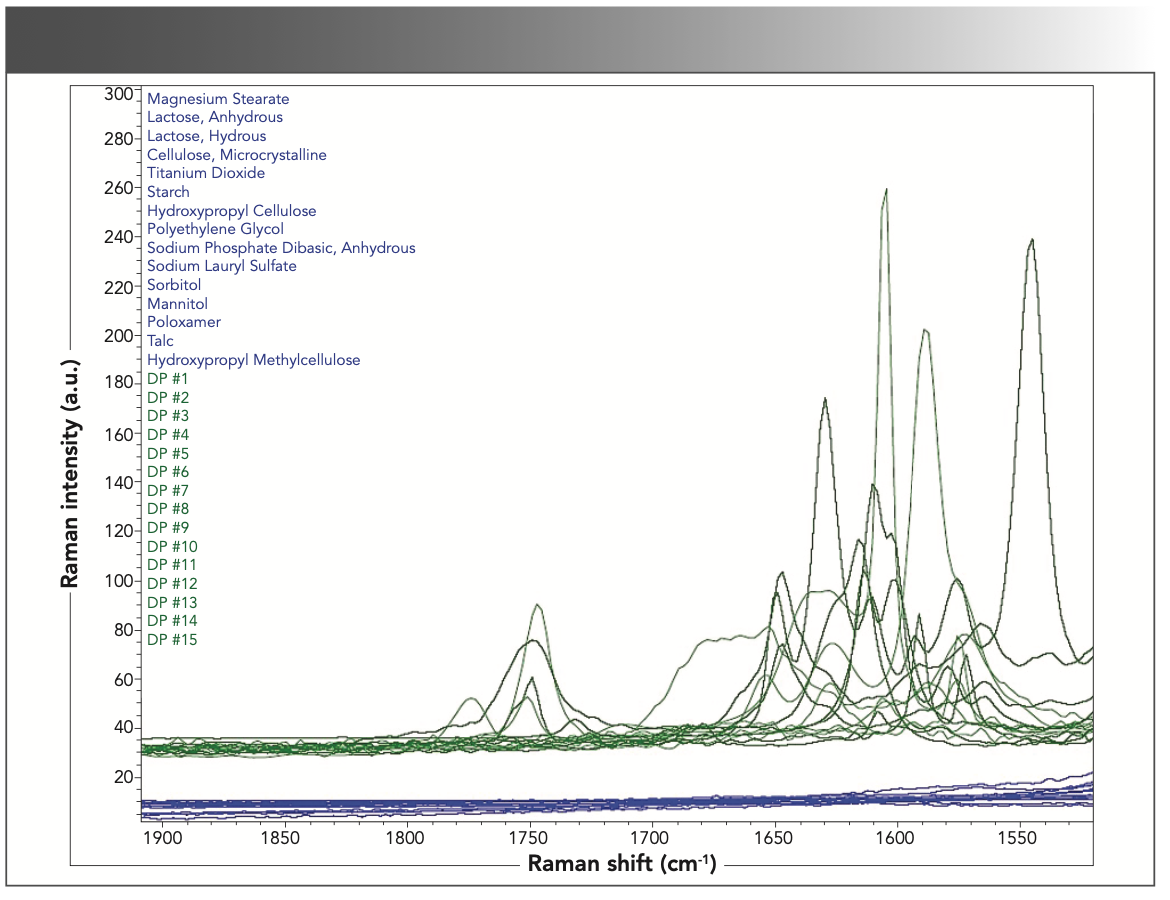
The 1550–1900 cm-1 spectral region can also be used for the identification of drug products. Like Figure 3, an overlay of 15 drug products and excipients in this region show that the primary Raman signals are from the APIs rather than the excipients. Figure 4 shows the drug products and excipients highlighted in this region. The overlays show that there is no additional interference upon formulation of the product and that the Raman spectra can identify the API component in a complex drug product mixture, which can be used for more quantitative analyses such as monitoring content uniformity and assay.
Quantitative Analysis
As stated above, the “fingerprint in the fingerprint” region in Raman spectroscopy can also be used for quantitative analyses such as assay or content uniformity for drug products (14). Content uniformity is a standard pharmaceutical test to ensure the API content in solid dosage products have the correct amount of API across a given manufactured drug product batch (10). A similar approach to the excipient and API evaluation was conducted using FT-Raman surface scattering measurements on pharmaceutical drug products. Additionally, PCA mathematical modeling was used in this article to differentiate and classify the API content in different strengths for a given drug product (13).
As shown in Figure 5, Raman data was collected on three different strengths of a pharmaceutical solid dosage drug product (5, 10, and 15 mg) and all three strengths have a total tablet weight of 95 mg. The total API weight (w/w) in these three strengths are 5.2, 10.5, and 15.8%, respectively. The 5 and 10 mg tablets are rectangular in shape, whereas the 15 mg tablet is round. In spite of the differences in shape, it was observed that as the tablet strength increased from 5 mg to 15 mg, the intensity of the API peaks also increased between 1550–1700 cm-1. This spectral intensity variability was further studied using PCA. The combination of spectroscopy and discriminate analysis, such as PCA, is a powerful tool that can be leveraged for classifying various types of medication strengths. Multivariate modeling, such as PCA, uses multiple response variables as opposed to a univariate approach, which only uses one variable. The multivariate approach does not follow a specific signal response such as concentration in Beer’s Law. For this work, PCA modeling was conducted on the “fingerprint in the fingerprint” region to determine if the 5, 10, and 15 mg tablet strengths could be differentiated. The PCA results shown in Figure 6 show a clear separation between the three tablet strengths, yielding a definitive classification of tablet strengths in this region. For this study, 90 Raman spectra were collected for the PCA modeling where 30 Raman spectra were collected for each tablet strength (10 scans per tablet). The PCA loadings plot for PC-1 is also shown in Figure 6. The loadings plot indicates that the majority of the spectral variability used to separate the three strengths along PC-1 are from the API peaks at 1580 cm-1 and 1620 cm-1. These peaks are mainly because of aromatic ring modes, C=O and C=C vibrations.
FIGURE 5: Overlapping Raman spectra that shows an increasing API intensity with increasing tablet strength (blue moving to red colored spectra).
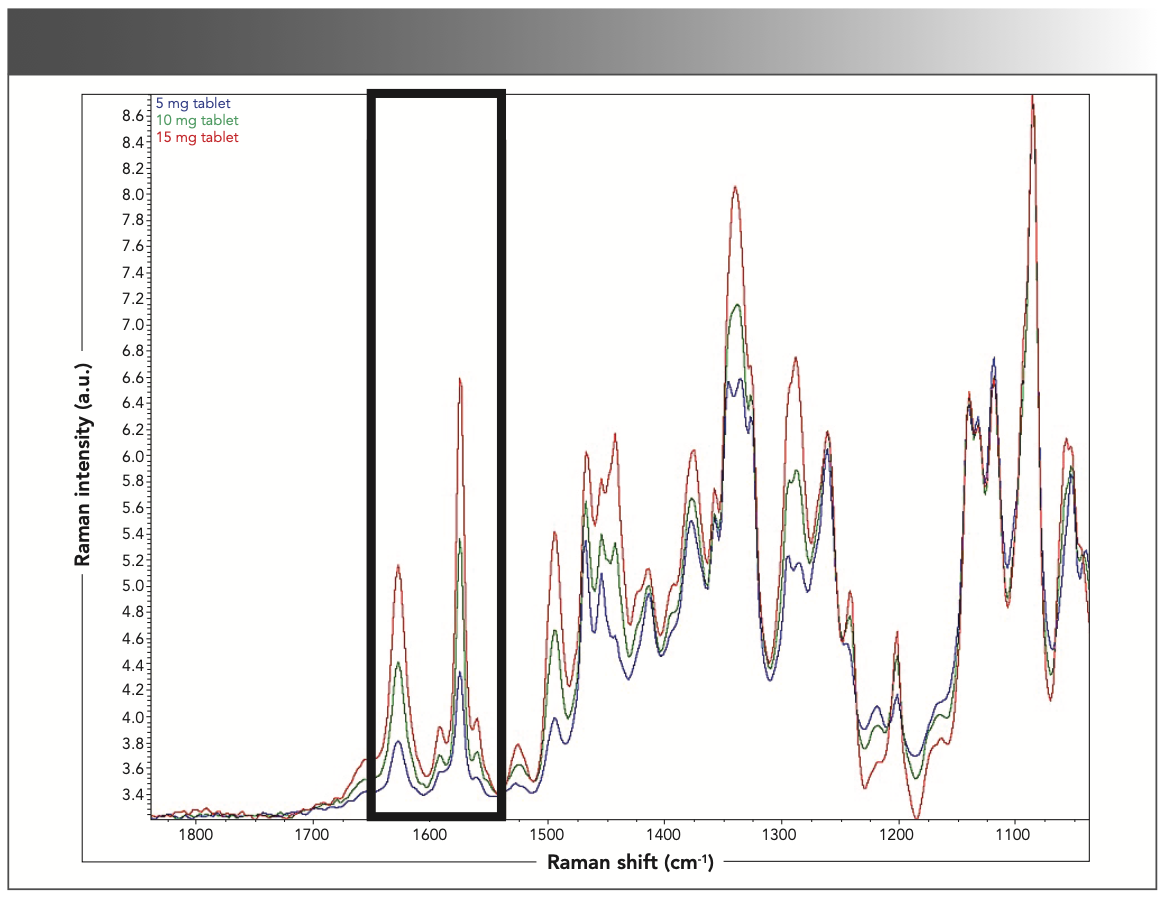
FIGURE 6: (a) PCA scores, and (b) loadings plots for the “fingerprint in the fingerprint” spectral region for PC-1 (37%). Axis labels for (b) are Raman shift (cm-1) for x-axis, and the loadings amplitude for the y-axis.
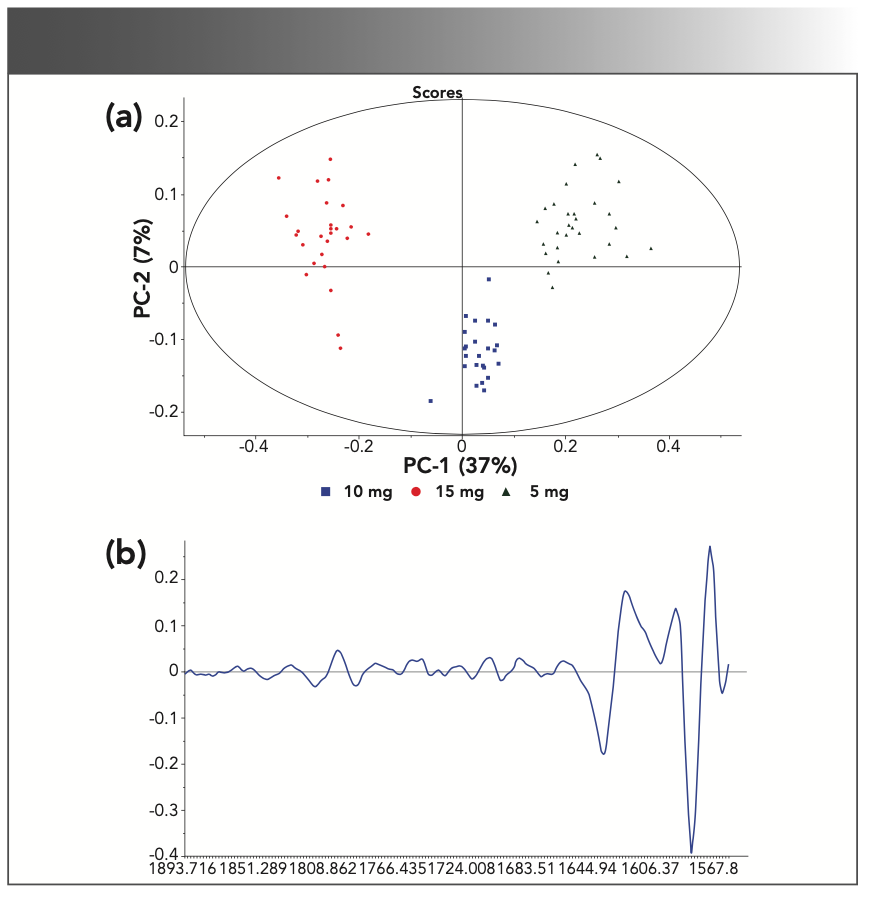
These results demonstrate the possibility of quantitative classification of pharmaceutical products using the conventional Raman techniques utilized in this work, and the importance of the “fingerprint in the fingerprint” for both qualitative and quantitative classifications. Although the results show definitive promise and potential for broad pharmaceutical utilization, traditional surface scattering Raman techniques do pose some limitations to accurate quantitative analyses such as content uniformity.
Mitigating some of these limitations, transmission Raman is a technique that has typically been used for quantitative analyses as opposed to conventional backscatter Raman. Transmission Raman requires limited or even no sample preparation, is nondestructive, and enables rapid analysis times (11). It can be applied during both the manufacturing and finished product stages. In this technique, a spectrometer measures a larger volume of the sample and the Raman signal is transmitted and diffused throughout the body of the sample (10). The transmittance through the sample results in a representative measurement and high efficiency (12).
Despite some of the limitations, these results clearly indicate that conventional FT-Raman spectroscopy could be utilized as a potential alternative for content uniformity testing typically performed by HPLC. Additionally, mathematical models such as partial least squares (PLS) regression can also be used to increase the accuracy of quantitative analyses like assay and content uniformity. However, PLS modeling is out of the scope of this article.
Conclusion
The aim of this study was to show the significance of a smaller spectral region of the Raman spectrum, defined as the “fingerprint in the fingerprint,” when evaluating pharmaceutical products. A spectral evaluation was conducted on a myriad of common excipients, APIs, and drug products. Qualitative and quantitative analysis was performed on these products to gain understanding of this spectral region. The qualitative results showed no Raman spectral signals in this region for any of the common excipients outlined in this article. Additionally, all APIs as well as drug products evaluated had unique spectral signal in this region. These data indicate that the 1550–1900 cm-1 Raman spectral region is ideal and can be leveraged for API identity testing because there are no interferences from common inactive ingredients. Furthermore, the data indicate that this spectral region can also be used to differentiate and classify the content of API in different strengths of a given drug product, which was shown in the mathematical modelling. Holistically, this work has demonstrated the vast potential of Raman spectroscopy to be utilized for both qualitative and quantitative analyses in the pharmaceutical industry, as well as the importance of the ~1550–1900 cm-1 spectral region, the “fingerprint in the fingerprint.”
Acknowledgments
The authors would like to thank Bristol Myers Squibb and their colleagues from the Global Quality Analytical Science & Technology Forensics team for their support.
References
(1) J. Peters, A. Luczak, V. Ganesh, E. Park, and R. Kalyanaraman, Am. Pharm. Rev. 19, 46–51 (2016).
(2) J. Griffen, A. Owen, and P. Matousek, J. Pharm. Biomed. Anal. 115, 227–282 (2015).
(3) E. Mojica, J. Zapata, J. Vedad, R. Desamero, and Z. Dai, in Raman Spectroscopy in the Undergrad Curriculum (ACS Symposium Series, vol. 1305, 2018), pp. 69–91.
(4) P. Kalantri, R. Somani, and D. Makhija, Der Chemica Sinica 1(1), 1–12 (2010).
(5) B. Handzo, A. Luczak, S. Huffman, J. Peters, and R. Kalyanaraman, Am. Pharm. Rev. 23, 38–43 (2020).
(6) Y. Xie and N. Cauchon, Am. Pharm. Rev. 15(2), 1–6 (2012).
(7) “Pharmaceutical Excipients FT-Raman Library”, Thermo Scientific (Waltham, Maryland, 2007).
(8) M. Veij. P. Vandenabeele, and T. Beer, J. Raman. Spectrosc. 40, 297–307 (2009).
(9) “Raman Data & Analysis: Raman Spectroscopy for Analysis and Monitoring Application Note”, Horiba Scientific (Edison, New Jersey, 2021).
(10) K. Frano, J. Maticchio, and D. Yang, Spectroscopy 33(11), 17–23 (2018).
(11) D. Andrews, K. Geentjens, et. al, J. Pharm. Innov. 13, 121–132 (2018).
(12) Y. Li, B. Igne, J. Drennen III, and C. Anderson, Int. J. Pharmaceutics 498, 318–325 (2016).
(13) R. Kalyanaraman, G. Dobler, and M. Ribick, Am. Pharm. Rev. 13, 38–45 (2010).
(14) M. Abu Bakkar, et al, Spectrochimica. 245, 118900 (2021).
Brittany Handzo, Jeremy Peters, and Ravi Kalyanaraman are with the Forensics and Innovative Technology (FIT) department at Bristol Myers Squibb in New Brunswick, New Jersey. Ravi Kalyanaraman will be chairing a session on Pharmaceutical Forensics at the upcoming 2022 SciX Conference in Cincinnati, Ohio (October 2–7). Direct correspondence to: ravi.kalyanaraman@bms.com.●
AI-Powered SERS Spectroscopy Breakthrough Boosts Safety of Medicinal Food Products
April 16th 2025A new deep learning-enhanced spectroscopic platform—SERSome—developed by researchers in China and Finland, identifies medicinal and edible homologs (MEHs) with 98% accuracy. This innovation could revolutionize safety and quality control in the growing MEH market.
New Raman Spectroscopy Method Enhances Real-Time Monitoring Across Fermentation Processes
April 15th 2025Researchers at Delft University of Technology have developed a novel method using single compound spectra to enhance the transferability and accuracy of Raman spectroscopy models for real-time fermentation monitoring.
Nanometer-Scale Studies Using Tip Enhanced Raman Spectroscopy
February 8th 2013Volker Deckert, the winner of the 2013 Charles Mann Award, is advancing the use of tip enhanced Raman spectroscopy (TERS) to push the lateral resolution of vibrational spectroscopy well below the Abbe limit, to achieve single-molecule sensitivity. Because the tip can be moved with sub-nanometer precision, structural information with unmatched spatial resolution can be achieved without the need of specific labels.