A MATLAB Application for Calculation of Cell Pathlength in Absorption Transmission Infrared Spectroscopy
Reliable quantitative FT-IR measurements require that the pathlength be known to within 1%. Pathlength estimations based on nominal spacer thickness are not reliable and require that the actual pathlength be measured for accurate data. We demonstrate how.
Fourier transform infrared spectroscopy (FT-IR) is an established technique for the qualitative determination of organic structure. Absorption infrared spectroscopy can be employed quantitatively using Beer’s law. However, reliable quantitative analysis requires that the pathlength is known within 1%. Calculations based on nominal spacer thickness are not sufficient for accurate work, due to variances in cell assembly and thermal expansion. The “interference pattern” method provides an accurate determination of cell pathlength, but requires plotting of empty cell spectra and counting of the fringes. This work provides a MATLAB application with a graphical user interface implementing an interactive plot where the user selects the spectral region for the calculation. Then, the program automatically computes the cell pathlength, providing a rapid determination of pathlength for practitioners.
Absorption infrared (IR) spectroscopy is an established instrumental method for qualitative determination of molecular functionality via characteristic bond resonance frequencies and absorbance intensities. Modern IR spectrophotometers utilizing Fourier transforms allow for fast and efficient data collection. This technological advance has enhanced the utility of IR spectroscopy, making it an expedient method for qualitative as well as quantitative measurements.
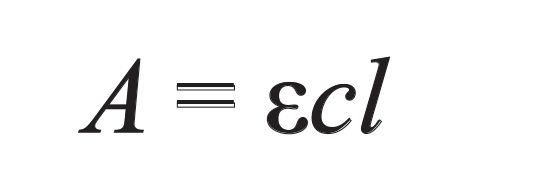
Vibrational excitation occurs when chemical bonds absorb photons whose frequency matches that of the bond. For this excitation to be IR-active, the magnitude of the dipole moment vector must change with oscillation. In absorption spectroscopy, the fraction of incident light absorbed by the sample at a specific wavelength is proportional to the concentration of absorbing molecules in the optical path, as described by the Beer-Lambert law
[1]

where ϵ is the molar attenuation coefficient (known as the molar extinction coefficient in older literature), c is the concentration of the chromophore, and l is the pathlength. Provided that the molar attenuation coefficient and pathlength are known, the formula can be rearranged, allowing for concentration to be calculated from an absorbance peak height or area. Harris (1) provides in-depth discussion of the interplay of concentration, pathlength, and intensity.
Cell pathlength is typically set using lead or Teflon spacers sandwiched between two salt plate windows. According to Meloan (2), quantitative reliability of IR measurements necessitates that the pathlength must be known within 1%. Because cells are often disassembled for cleaning and polishing of windows, the pathlength can vary upon reassembly relative to calibrations and the nominal spacer dimensions provided by the manufacturers are not adequate for quantification. Since cell pathlength may change due to thermal expansion (3), in-situ measurements provide the most reliable pathlength (4). The pathlength should be calculated during calibration, followed by determination of the attenuation coefficient based on the known concentration and absorbance measurement:
[2]

If the cell is reassembled, the pathlengthlsample should be measured before the sample is loaded, and then the concentration is determined using:
[3]

Pathlength Measurement Using the Interference Pattern
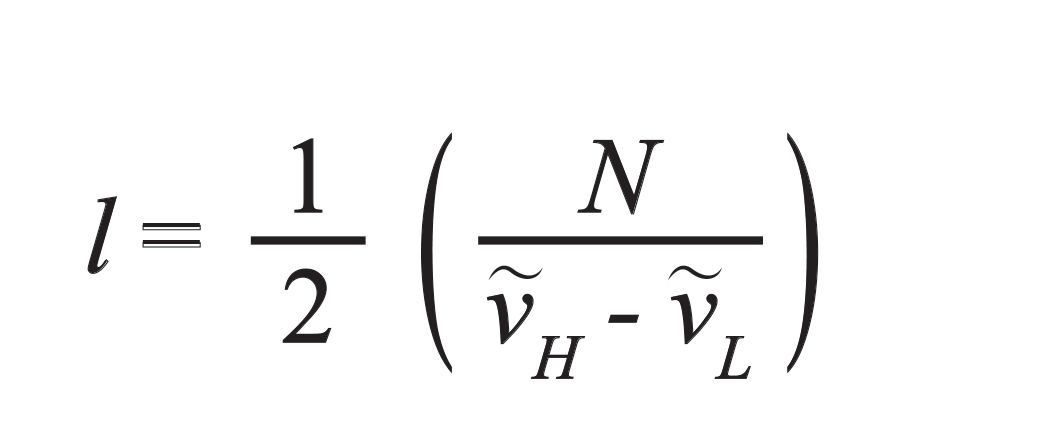
When the cell is empty, the refractive indices are significantly different for the salt plate windows and the inert gas (such as nitrogen) in the sample cell. Thus, a measurable amount of the irradiating light is internally twice reflected at the gas-salt interfaces within the cell before exiting on the detector side. Constructive and destructive interference occurs between the irradiating light and internally reflected light at all wavelengths. Maximum intensities are observed when the wavelength of light exiting the cell is an integer multiple of twice the cell pathlength. Likewise, minima in intensity occur when the wavelengths of exiting light are half integer multiples of twice the cell pathlength. Wavelengths lying between half and full integer multiples give rise to intermediate absorbance intensities. The resulting spectrum is comprised of successive oscillations known as an interference pattern, which allows for the pathlength to be calculated from the span of several adjacent minima using Equation 4:
[4]

where l is the cell pathlength in centimeters, N is the number of cycles (fringes), and ν̃H and ν ̃L are the high and low wavenumbers selected for the calculation (4).
The Pathlength Application
The application can be run on any operating system where MATLAB is installed. No additional MATLAB toolboxes are required. The code is developed for absorption spectroscopy. Before scanning the empty cell, a background scan should be collected to remove environmental effects. The cell should be clean, and the windows free of surface imperfections or clouding. Next, the empty cell should be scanned, ideally with a dry inert gas in the sample space, and the instrument output should be saved in a .csv format, with the first column containing wavenumbers and the second column containing absorbance or percent transmittance. The app will disregard any lines in the file containing text.An example .csv file is provided at the link that appears in the Appendix section of this article.
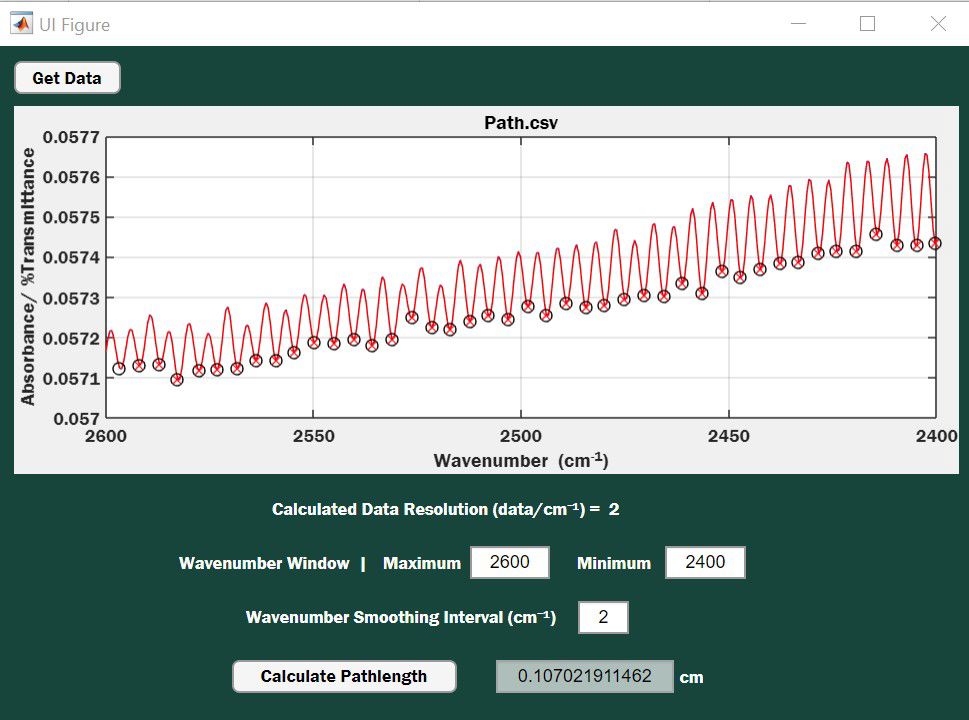
A screenshot of the application graphical user interface is shown in Figure 1. The empty cell spectrum is loaded by clicking the Get Data button, which opens a standard file browser allowing the practitioner to select the empty cell .csv file. After the file has loaded, the file name will be displayed as the title of the plot; in Figure 1, the file is Path.csv. The entire empty cell spectrum is displayed as a blue line (obscured by the smoothed red line in Figure 1), enabling the user to visually inspect the spectra before selecting the region to be used for the pathlength calculation. The user can vary the region of the spectrum used for the calculation by adjusting the maximum and minimum values in the Wavenumber Window box. Data resolution is calculated and displayed.
Figure 1: Graphical user interface (GUI) of the MATLAB application for determining IR cell pathlength.

A smoothing filter is provided since noise in the spectra can interfere with determination of the intensity minima used for counting cycles. The smoothing filter applies a quadratic spline fitted to a specified wavenumber span. Setting the smoothing span to the width of the top third of the cycle typically works well. The plot is interactive, thus clicking on the curve displays coordinates, permitting rapid determination of a reliable span to use
for smoothing.
Once the desired region has been established, and the span specified, depressing the Calculate Pathlength button performs the calculation, and generates a value for the cell pathlength in centimeters. The smoothed spectrum is displayed as a red line. The number of fringes used in the calculation are determined automatically, eliminating tedious counting where user errors may occur. Circles appearing on the plot of Figure 1 denote the fringe minima detected by the program and the x’s depict complete cycles (N) relative to the first minimum. The first and last circle observed on the plot coincide with the actual wavenumber values used to perform the calculation. The calculation should be performed two to three times, using different wavenumber ranges to confirm the pathlength. Values should vary by less than 0.2% (4). The app is configured so that smoothing can be changed without resetting the selected wavenumber range. Noise in the spectra can cause incorrect identification of the cycle minima if the smoothing span is too small. The user can identify this behavior when viewing the circles on the calculated plot, reset the smoothing filter, and recalculate the pathlength. The complete cycles within the active plot window are used in the calculation, not the nominal wave numbers used in the GUI to select the window.
Discussion and Conclusion
The pathlength application provides a convenient method to accurately and quickly calculate the pathlength of IR cells. The app is easy to use, and the visualization of the fringe pattern provides an opportunity for the user to interactively change the selected wavenumber window and smoothing to use for the pathlength calculation. The app eliminates tedious counting where user error may occur. Code is provided in the Appendix, and the pathlength app is distributed via the MATLAB Central File Exchange repository at https://www.mathworks.com/matlabcentral/fileexchange/77353-pathlength. Documentation is provided with the app download for users who may need to edit the data .csv file as well as an example data file and step-by-step instructions.
Appendix
A text file containing a description of the Excel data file, and the actual MATLAB code, is published online at https://www.egr.msu.edu/thermoprops/pathlength. An example Excel data file (InstrumentFile.csv) is also provided at the link.
Acknowledgments
This work was supported by the National Science Foundation under Grant No. 1603705 and USDA National Institute of Food and Agriculture, Hatch/Multi-State project MICL04192. Any opinions, findings, and conclusions or recommendations expressed in this material are those of the authors and do not necessarily reflect the views of the funding agencies.
References
- D.C. Harris, Quantitative Chemical Analysis (W. H. Freeman: New York, New York, 7th Edition, 2006).
- C.E. Meloan, Elementary Infrared Spectroscopy (McMillian, New York, New York, 1963).
- K.E. Amunson, B.A. Anderson, and J. Kubelka, Appl Spectrosc. 65 (11), 1307–1313. (2011) https://doi.org/10.1366/11-06405.
- W.J. Potts, Chemical Infrared Spectroscopy, Vol. 1: Techniques (John Wiley & Sons, Inc, New York, New York, 1963).
William G. Killian, Jr., Jackson A. Storer, and Carl T. Lira are with the Department of Chemical Engineering and Materials Science at Michigan State University, in East Lansing, Michigan. William Killian, Sr. is with the Department of Physical Sciences at Ferris State University, in Big Rapids, Michigan. Direct correspondence to killianw@egr.msu.edu or lira@egr.msu.edu
FT-IR Microscopy, Part 2: Mid-IR Sampling with DRIFTS, IRRAS, and ATR
February 14th 2025Fourier transform infrared (FT-IR) microscopy using reflection methods (diffuse reflection, reflection/reflection-absorption, or attenuated total reflectance) typically requires less sample preparation than transmission. However, optimal results will depend upon the sample and, in particular, the sample surface.
Key Points to Remember When Using Internal Standards for Sample Analysis by ICP-OES
August 2nd 2023Using internal standards is a common technique to correct for variations in sample matrices and the effect this has on analyte intensities. There are several basic criteria to be considered when using internal standards: selection of appropriate internal standards, the concentration added to the solutions analyzed, setting up in the correct view (axial vs. radial), how to introduce the internal standard to the solutions to be analyzed, and evaluating the resulting data. Each of these topics are considered and suggestions presented.
A Brief Look at Optical Diffuse Reflection (ODR) Spectroscopy
August 1st 2023In this short overview, we consider cases for diffuse reflection spectroscopy and introduce the Kubelka-Munk diffuse reflectance formula. We conclude by comparing diffuse transmittance, diffuse reflectance, logarithmic transforms of both, and the Kubelka-Munk transform for mid-infrared spectroscopy of the same sample.
Key Steps to Follow in a FRET Experiment
August 1st 2022Förster resonance energy transfer (FRET) is a versatile part of the toolbox of fluorescence methods. This through-space, photon-less energy transfer process between a donor fluorophore and an acceptor chromophore is perhaps most famous for its utility as a “molecular ruler” that can resolve nanometer-scale distances. FRET is also a popular and advantageous basis for biomolecular assays and sensors.
