Accurate and Precise Quantification of Arsenic and Selenium in Water and Biological Samples Through the Removal of Doubly Charged Rare Earth Element Interferences by ICP-MS
This month’s column evaluates the capability of inductively coupled plasma–mass spectrometry (ICP-MS) to reduce the impact of doubly charged rare-earth element (REE) interferences on the quantitation of the metalloids, arsenic (As), and selenium (Se) in water and biological matrices. It compares the performance of a number of different interference reduction techniques, including correction equations, and collision/reaction cells (CRC), using various ion-molecule collisional and reaction mechanisms. To identify an optimal method of removal, the authors first assessed the magnitude of interference by individual REEs before comparing the efficacy of their removal with helium as a collision gas and hydrogen, ammonia, and oxygen as reaction gases using different “on mass” and “mass shift” analytical scenarios. Their conclusion was that the only modes to consistently remove REE interferences used oxygen with mass shift, which had better accuracy and lower detection limits for both arsenic and selenium.
- Rob Thomas, Column Editor
Arsenic and selenium are common metalloids released from mineral deposits through their extraction, processing, and waste. Arsenic is found at 1.5–2.0 ppm in the Earth’s crust, primarily as arsenopyrite, in close association with various metal ores (1). The selenium concentration in surface rocks is 0.05 ppm, commonly found as selenide minerals, selenite, and selenate (2). Both arsenic and selenium are released by the extraction, processing, and use of mineral resources, with arsenic being mainly released through the mining and processing of nonferrous metals and coal (1) and selenium coming from fossil fuels, primarily through coal mining, combustion, and ash deposits (3).
Elevated concentrations of arsenic and selenium can be problematic for human health, fish, and wildlife. Arsenic is a non-essential element and is broadly toxic, with the drinking water standard in the United States of 10 μg/L (4) and a chronic aquatic life criterion of 150 μg/L (5). At concentrations exceeding these thresholds, arsenic can cause cancer and cardiovascular disease in humans, developmental effects in wildlife, and damage to organs in fish (1,6). In contrast to arsenic, selenium is essential, but elevated concentrations can still cause adverse impacts, and so drinking water standards are set at 50 μg/L (4), and chronic aquatic life criteria are set at 1.5 μg/L in lakes and 3.1 μg/L in streams in the US (7). Adverse effects are most noticeable in egg-laying taxa such as fish and birds, given that selenium is transported to the ovaries and elevated concentrations contribute to developmental defects, including scoliosis in general and malformed beaks in birds (3). Accurate quantitation is necessary given the prevalence of arsenic and selenium as contaminants and their potential negative effects on organisms at low concentrations.
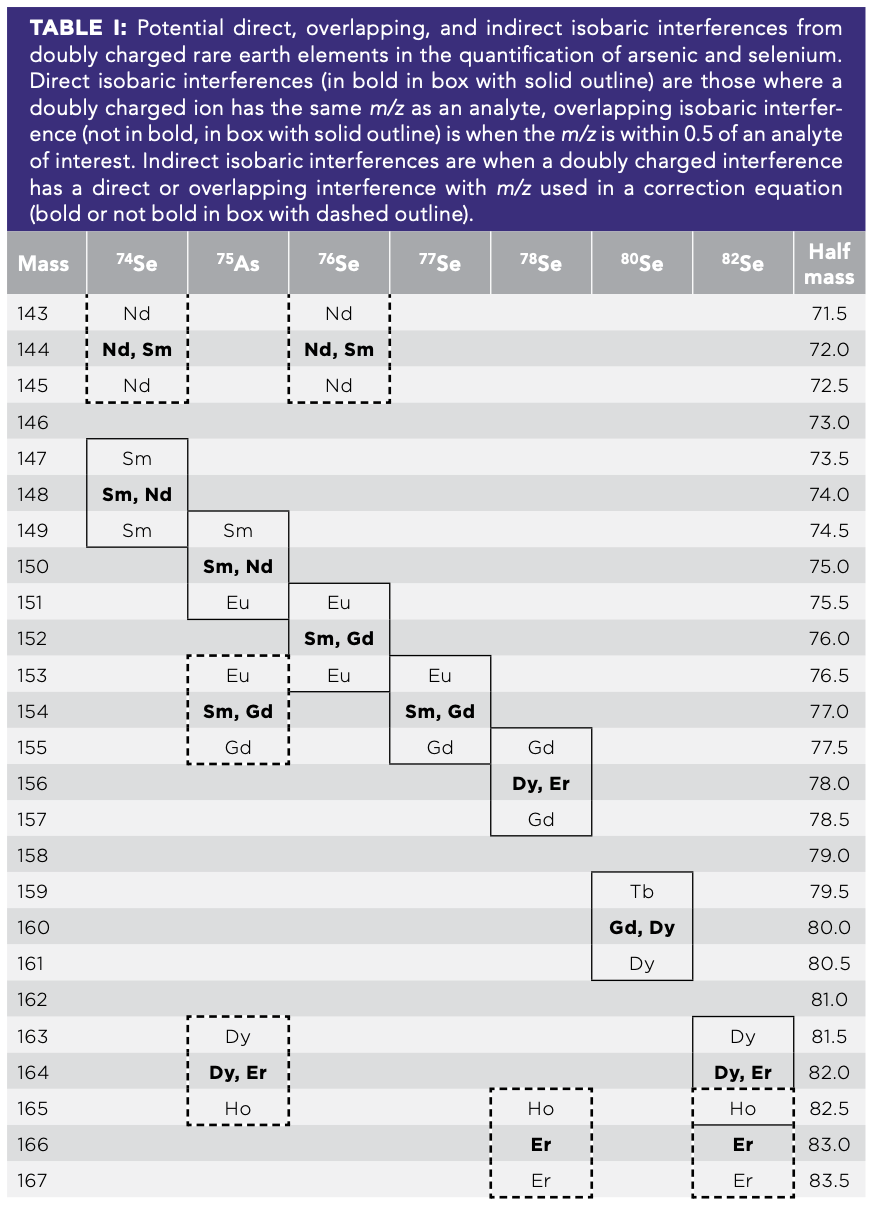
Accurate quantitation of arsenic and selenium are key to assessing organismal exposure; however, another group of elements released by mining—rare earth elements (REEs)—cause numerous interferences. Commonly released from the same ores and by the same processes as arsenic and selenium (8), REEs have atomic masses roughly twice those of arsenic and the six isotopes of selenium, but they can cause isobaric interferences to the extent that they become doubly charged in the ICP-MS plasma because of their low ionization energies (9). These doubly charged REEs then either have the same mass-to-charge ratio as arsenic and selenium or an adjacent mass-to-charge ratio (Table I).
Two approaches for reducing interferences from REEs on arsenic and selenium include optimizing the instrument tuning to minimize doubly charged ion formation and mathematical corrections. By optimizing the tuning of the instrument, the formation of Ce++ can be reduced to below 3%, which should minimize doubly charged ions for other elements as well. However, even minimal quantities of doubly charged ions can cause appreciable interference. Another approach is to use mathematical corrections, which take the signal of an interfering ion along with a calibrated correction factor and adjust the signal for the element of interest to remove any doubly charged interference. Though this approach can and does work, when the interfering element has high concentrations relative to the element of interest, it can result in overcorrection and negative concentrations.
An alternative approach is to use a collision reaction cell (CRC) to either remove the interferant or shift the mass of the element of interest away from the interferant. In collision mode, helium is a non-reactive gas that takes energy away from ions when they collide, with ions with large atomic radii colliding more frequently and losing more energy. This leaves these larger ions with insufficient kinetic energy to enter the mass analyzer quadrupole because of kinetic energy discrimination (KED) (10). In reaction mode, a reactive gas (such as hydrogen, ammonia, or oxygen) is used to either neutralize or shift the mass of interfering ions or the analyte ion’s mass, thereby mitigating interferences. This approach can be used in single quadrupole instruments, but it can yield more robust results when used with an instrument with two quadrupole mass analyzers, allowing the operator to remove non-target ions before the CRC with the first mass analyzer and then select a shifted mass for the second mass analyzer. This approach is further enhanced on instruments with a quadrupole serving in the reaction cell, which can be used as a bandpass filter to further restrict reactants, byproducts, and any contaminants in the gas, thereby removing interferences (10).
In this study, we sought to examine the degree to which different gas modes could remove isobaric interferences from REE with arsenic and selenium through two experiments, one with single-element stocks and one with mixtures of REEs, arsenic, and selenium. In the single-element experiment, we calibrated with single-element stocks of arsenic and selenium. Then, we measured both arsenic and selenium for single-element stocks of either arsenic, selenium, or the REEs dysprosium, erbium, europium, gadolinium, holmium, neodymium, and samarium. In the mixture experiment, we measured stocks with varying concentrations of arsenic and selenium crossed with different concentrations of a mixture of REEs.
Method
All analyses were performed on a NexION 5000 ICP-MS (PerkinElmer), which was configured with four cell gases. The instrument was run in focusing mode with an RF power at 1600 W, a plasma gas flow of 16 L/min, and an auxiliary gas flow of 1.2 L/min. The instrument featured an initial quadrupole that deflected the ion beam 90 degrees, which allowed negative and neutral species to be lost. The next quadrupole (Q1) could be used as either a mass filter or an ion guide, either selecting what species enter the collision reaction cell or facilitating the passage of all ions (Figure 1). The next quadrupole (Q2) was used as an ion guide in the CRC, and it can also serve as a mass filtering quadrupole where bandpass can be applied to eject unwanted species from the ion beam prior to the final analyzer (Q3). Finally, Q3 can be set the same as Q1, or when an analyte complexes with the reaction gas, it can be set to the mass of the expected product ion at that shifted mass. We used helium, ammonia, hydrogen, and oxygen as our four cell gases. Helium is typically used as a collision gas with an elevated flow rate, and ammonia, hydrogen, and oxygen are usually used as reaction gases.
FIGURE 1: Schematic showing the orientation of quadrupoles in a triple quad ICP-MS with Q1 serving as either a mass filter or an ion guide; Q2 serving as a collision reaction cell with the ability to serve as a bandpass filter; and Q3 serving as a final mass filter.

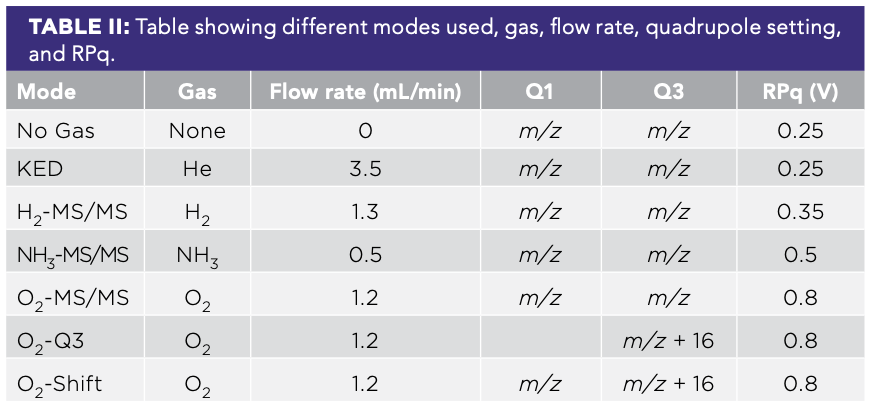
For this work, we varied the cell gas and quadrupole configuration for a total of seven modes. For cell gases, we used either no gas (No Gas), hydrogen (H2), helium (KED), ammonia (NH3), or oxygen (O2). For the quadrupoles, our main mode of operation was to have Q1 equal to Q3, with both set for our mass-to-charge ratio (m/z) of interest (MS/MS mode). When combined, this gave us five of our modes: No Gas; KED; H2-MS/MS; NH3-MS/MS; and O2-MS/MS. Additionally, given the reactivity of arsenic and selenium with oxygen, we also tried two different configurations with mass shift; we either used Q1 at the mass of the unreacted isotope of interest and Q3 at the shifted m/z of interest (O2-Shift), or we set Q1 to serve as an ion guide and Q3 set to the shifted m/z of interest (O2-Q3; Table II). This second mode is analogous to when an instrument with only one quadrupole mass filter is used.
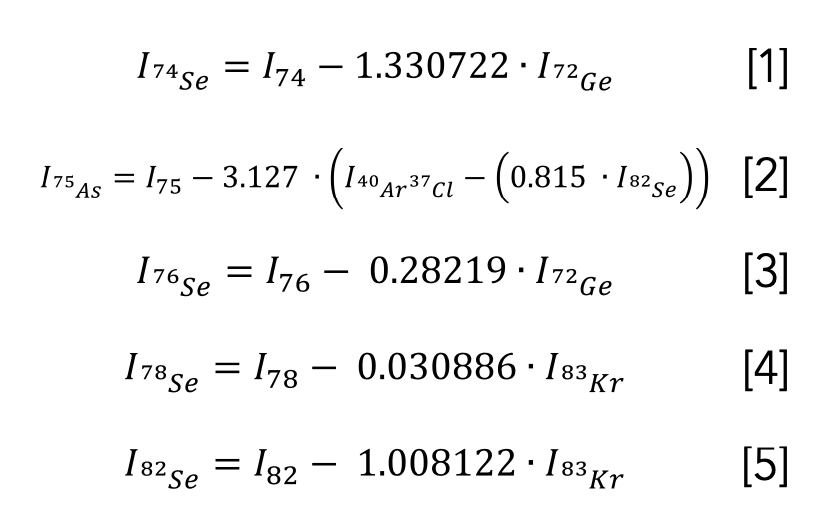
For all modes, we measured 75As, 74Se, 76Se, 77Se, 78Se, 80Se, and 82Se, except for the No Gas mode, for which we did not measure 80Se to avoid the 40Ar dimer that is so dominant in this mode. Finally, we used the following correction equations for No Gas mode for 74Se, 75As, 76Se, 78Se, and 82Se (Equations 1–5):
The instrument configuration was optimized for both arsenic and selenium in each mode to maximize sensitivity and minimize the detection limits and background equivalent concentrations. For each gas mode and element, we optimized the flow rate of the CRC for each gas, then optimized the rejection parameter q (RPq) settings to minimize the background signal and minimize our calculated detection limit (Table II). Across all elements, we left rejection parameter a (RPa) settings at zero to maximize our signal.
This work consisted of two parts, one in which we used single-element stocks to examine the magnitude of interference possible for each element and a multielement experiment to test how efficiently the different modes removed interferences while accurately quantifying arsenic and selenium. For the single-element solutions, we made up solutions of 0.1, 1, 10, and 100 ppb for arsenic, selenium, dysprosium, erbium, europium, gadolinium, holmium, neodymium, and samarium. We calibrated the instrument in all modes with single-element stocks of arsenic and selenium. In the multielement experiment, the stocks contained arsenic and selenium each at 0, 0.1, 1, and 10 ppb, whereas the mixture of REEs contained each REE at 0, 0.1, 1, 10, and 100 ppb, giving a total of 16 different combinations of arsenic, selenium, and REEs.
We used standard equations based on laboratory blanks and standards to evaluate detection limits and background equivalent concentrations. Specifically, we calculated the method detection limit of the blank (MDLb) by calculating the mean (), the standard deviation of seven replicate blanks (Sb), which we then used along with the value for a one-tailed t distribution with n - 1 degrees of freedom and a 99% confidence interval using the following equation (11):

For concentration values less than the MDL, we censored the data by setting them equal to half the MDL. For the background equivalent concentrations, we calculated them using the equation, modified from reference (12):

where IBackground is the raw intensity for a blank sample, [Standard] is the concentration of the standard used, and IStandard is the raw intensity for that standard. We calculated BEC for all standard concentrations but chose to use the value calculated for 10 ppb given that it was typically consistent with BEC calculated for other concentrations.
Results
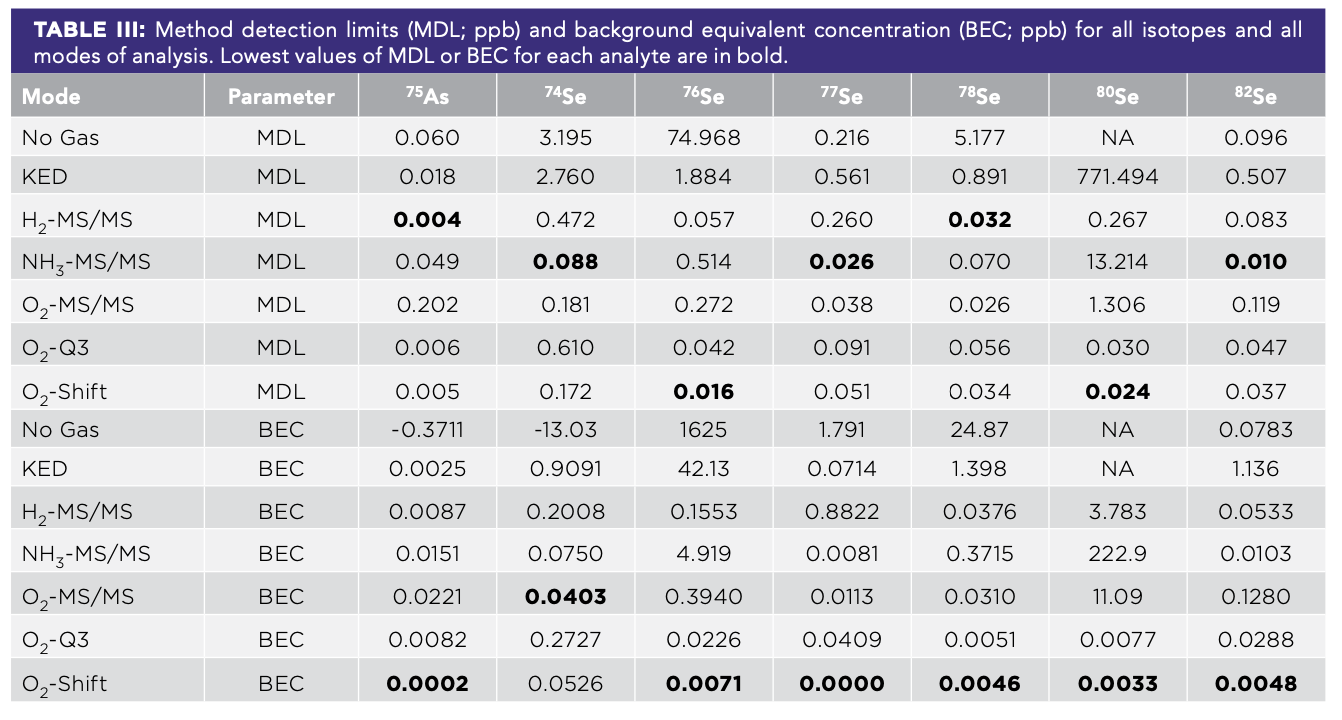
The different modes and isotopes varied in terms of their detection limits and background equivalent concentration. In general, three modes had the lowest detection limits among arsenic and selenium isotopes, namely O2-Shift (76Se, 80Se), H2-MS/MS (75As, 78Se), and NH3-MS/MS (74Se, 77Se, and 82Se; Table III). In contrast to the patterns in detection limit, BEC values were consistently lowest for O2-Shift, except for 74Se, for which NH3-MS/MS had the lowest BEC, though only 23% lower than O2-Shift.
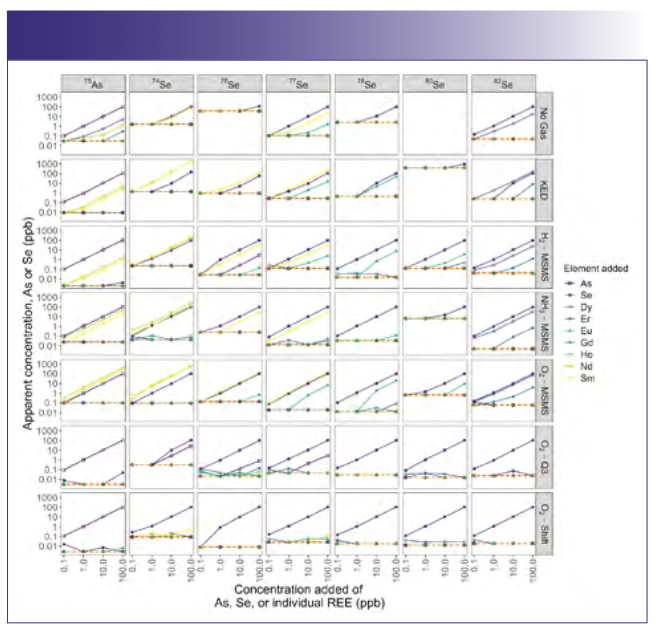
In our analysis of single-element stocks, there was evidence of interference for arsenic and nearly every isotope of selenium for every gas mode save O2-Q3 and O2-Shift. Across all modes, arsenic was measured well (Figure 1), as indicated by the added concentration and expected concentration matching up. In the absence of interference, all other elements would have had data below the detection limit, yielding horizontal lines. However, several elements interfered across many modes, including dysprosium, neodymium, and erbium (No Gas mode), and neodymium and samarium (KED, H2-MS/MS, NH3-MS/MS, and O2-MS/MS modes). This interference is evident in the fact that these elements gave lines where increasing concentrations of the elements yielded increases in the apparent concentration of our arsenic, yielding a false positive.
Much like for arsenic, selenium was measured across all modes for all isotopes, though the detection limits were much higher for some modes, rendering them ineffective at lower concentrations (for example, No Gas for 76Se; Figure 2). Except for europium and holmium, all REEs and arsenic caused false positive selenium concentrations for some combinations of isotopes and modes, almost exclusively in No Gas, KED, H2-MS/MS, NH3-MS/MS, and O2-MS/MS modes. The two elements that caused the most isobaric interferences were samarium, with interferences in 14 of the 48 combinations of modes and isotopes, and Gd with interferences in 10. Several other REEs caused interferences to a lesser degree, including dysprosium with six, and tied were erbium, neodymium, and arsenic with four combinations of modes and isotopes where each caused some interferences. In only one instance was their interference seen in a mass shift mode, namely the O2-Q3 mode, and it was 75As+ interfering with 74Se+; all other interferences were in the non-mass shift modes. Though both O2 modes with Q3 shifted by 16 worked well for selenium, the detection limits for O2-Shift were on average 50% lower than those of O2-Q3, suggesting it might be better suited for lower concentrations of selenium.
FIGURE 2: Apparent concentration of arsenic (As) or selenium (Se) when single-element stocks were analyzed at a range of concentrations of As, Se, and seven REEs. The symbol shape and color show what element was added. The red dashed line represents one-half the method detection limit. Columns correspond to different elements and isotopes, while rows correspond to different ICP-MS modes used for analysis.
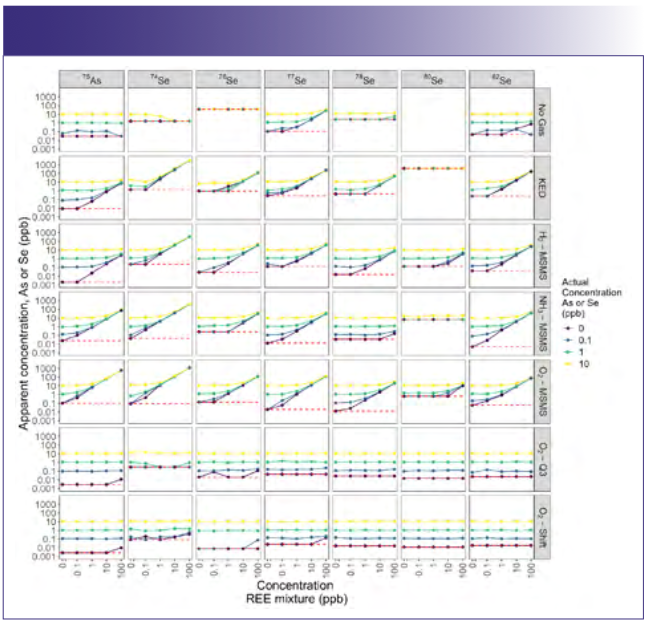
When looking at samples with mixtures of REEs and our elements of interest and comparing the different modes for measuring arsenic and selenium, only the modes using a mass shift were broadly free of interferences. For both arsenic and most isotopes of selenium, the O2-Q3 and O2-Shift modes yielded data with little or no evidence of interference (Figure 3). Specifically, for these two modes, we can see that the apparent concentration was equal to the added concentration regardless of the concentration of the REE mixture, yielding a horizontal line. For all other modes, we saw extensive evidence of interference, as indicated by lines at a given concentration of arsenic or selenium that show increasing apparent concentration with the addition of REEs. Unsurprisingly, interferences were worst across modes at low concentrations of arsenic and selenium when coupled with elevated concentrations of REEs. Taken to the extreme, for 74Se in KED mode for 100 ppb REEs, the apparent concentration across all selenium concentrations averaged 3134 ± 54 ppb (mean ± standard error) because of the combined interference. Though this was the most egregious interference, many modes had measurable interference for REE concentrations greater than 0.1 ppb.
FIGURE 3: Apparent concentration of arsenic or selenium for various concentrations of seven rare earth elements mixtures, with each rare earth element (REE) at the denoted concentration in the mixture. Line color denotes the actual concentration of arsenic or selenium. The red dashed line represents one-half the method detection limit. Columns correspond to different elements and isotopes, while rows correspond to different ICP-MS modes used for analysis.
Discussion
Although the detection limits were not always the lowest for the two oxygen modes analyzed at m/z + 16, the lack of interference in these modes and their overall low detection limits make them attractive options. For example, although 75As showed only modest evidence of interference in Standard mode, the detection limit for 75As in No Gas mode was 10-fold and 50-fold higher than for O2-Q3 and O2-Shift, respectively. The difference in detection limits was smaller for 82Se, but it was still nearly twofold and 4-fold higher in Standard mode than for O2-Q3 and O2-Shift, respectively. In general, 80Se in O2-Q3 and O2-Shift had the lowest detection limits, roughly twofold lower than the same modes for 82Se in Standard mode. Additionally, even though the detection limits were not always the lowest for the two mass shift modes, the BEC values for O2-Shift were almost universally the lowest, and O2-Q3 was oftentimes on the low end of all modes, suggesting that the mass shift modes are effective at removing the background signal.
Although we expected isobaric interference on arsenic from 150Nd++ and 150Sm++, we did not expect interference from dysprosium and erbium a priori (inclusion in Table I was done post hoc). These were likely caused by a correction error, given that we used a correction equation for 75As (Equation 2) in the No Gas mode. Specifically, the correction equation for removing 40Ar35Cl+ interference estimates the interference by estimating the intensity of the signal from 40Ar37Cl+, and then it corrects the signal from 77Se+ by using 82Se+. Given that 164Dy++ and 164Er++ overlap with 82Se+, they can contribute to overcorrection by subtracting a negative correction. In contrast to all other modes, the O2-Q3 and O2-Shift modes show minimal evidence of interference by any other elements, though there was slight evidence of selenium interfering with arsenic potentially because of slight overlap of 74Se+ with 75As+ that becomes clear at high selenium concentrations.
We found some gas modes were ineffective or made interferences worse; however, using O2 as a reaction gas with a mass shift worked well for most isotopes. Although the goal of using a collision or reaction gas is to remove interferences, there were examples of reaction gases potentially attenuating our elements of interest more effectively than the interferants (for example, samarium in KED mode for 75As, 74Se, 76Se, and 77Se). One approach for overcoming such challenges is to use correction equations with collision and reaction gases, which can do better than just KED mode for arsenic and selenium (13). However, both O2-Q3 and O2-Shift successfully removed all observable interferences for arsenic, and most for 78Se, 80Se, and 82Se, consistent with similar studies. Only O2-shift removed all interferences for 74Se, 76Se, and 77Se, with arsenic serving as the main interference in the O2-Q3 mode.
When we analyzed mixtures of elements, it was notable that the No Gas mode gave data for 75As and 82Se that were minimally affected by the REEs at concentrations at or below 10 ppb. The limited interference measured in mixtures is notable as it was much lower than when those same REEs were added individually. For example, dysprosium at 10 ppb in No Gas mode gave apparent 82Se concentrations of 1.9 ppb, but a combination of all seven included REEs at 10 ppb with no added selenium gave a concentration of 0.2 ppb (Figure 2). Given that the correction equation for 82Se (Equation 5) accounts for 82Kr interference using the signal at m/z = 83, and given that erbium produced a strong signal at m/z = 83 (data not shown, likely because of 166Er++), this apparent lack of interference is likely because of an incorrect but fortuitous correction. When the correction was removed, the degree of interference was much worse.
Conclusions
From this study, we see clear evidence that arsenic and selenium can be measured accurately with a variety of different gas modes in the absence of interferences. However, we also saw clear evidence that in the presence of REEs at elevated concentrations, there was interference in all modes except for the O2-Q3 and O2-Shift. Although these two methods did not always have the lowest MDLs, they were among the lowest for arsenic and most isotopes of selenium and had the lowest BEC values. These patterns are consistent with other work using ICP-MS/MS, but they also show that instruments with only a single mass analyzer can also take advantage of mass shifts to minimize interferences from doubly charged ions. In addition to removing interferences, using O2 with a mass shift also made it possible to measure a wider range of isotopes of selenium compared to any other modes. It is possible that other gases, such as methane, nitrous oxide, or even methyl fluoride (14), might also prove effective in removing REE interferences and are ready targets for future research.
Acknowledgments
The authors want to offer their sincere thanks for the generosity of PerkinElmer U.S. for entering into a collaborative agreement with the University of Montana. We especially want to thank Ruth Wolf and Aaron Hineman for working with us as we developed the ideas for this study, helping us optimize the methods, and collaborating with us as we refined the study design and interpreted the data. Finally, we would like to thank Wolf for her hands-on help in the laboratory.
References
(1) National Research Council, Distribution of Arsenic in the Environment. In Arsenic: Medical and Biologic Effects of Environmental Pollutants. National Academies Press (US), 1977; Available from: https://www.ncbi.nlm.nih.gov/books/NBK231016/
(2) Stillings, L. Selenium, Chapter Q. In: Critical Mineral Resources of the United States—Economic and Environmental Geology and Prospects for Future Supply: US Geological Survey, 2017; pp Q1–55. DOI: 10.3133/pp1802Q
(3) Lemly, A. D. Environmental Implications of Excessive Selenium: A Review. Biomed. Environ. Sci. 1997, 10, 415–435.
(4) Code of Federal Regulations, Maximum Contaminant Levels for Inorganic Contaminants; Title 40, §141.62, July 1, 2014; pp 474–475. [Online] https://www.epa.gov/sites/default/files/2015-09/documents/cfr-2014-title40-vol23-sec141-62_0.pdf (accessed 2024-11-12).
(5) U.S. Environmental Protection Agency, National Recommended Water Quality Criteria - Aquatic Life Criteria Table. 2015. [Online] https://www.epa.gov/wqc/national-recommended-water-quality-criteria-aquatic-life-criteria-table (accessed 2024-11-03).
(6) Eisler, R. Arsenic Hazards to Fish, Wildlife, and Invertebrates: A Synoptic Review; U.S. Fish and Wildlife Service, 1988; Biological Report 85(1.12). https://cluin.org/download/contaminantfocus/arsenic/eisler_CHR_12_Arsenic.pdf (accessed 2024-11-03).
(7) Federal Register. Recommended Aquatic Life Ambient Water Quality Criterion for Selenium in Freshwater; Vol. 81, No. 134, July 13, 2016; pp 45285–45287. [Online] https://www.federalregister.gov/documents/2016/07/13/2016-16585/recommended-aquatic-life-ambient-water-quality-criterion-for-selenium-in-freshwater (accessed 2024-11-12).
(8) Rue, G. P.; McKnight, D. M. Enhanced Rare Earth Element Mobilization in a Mountain Watershed of the Colorado Mineral Belt with Concomitant Detection in Aquatic Biota: Increasing Climate Change-Driven Degradation to Water Quality. Environ. Sci. Technol. 2021, 55 (21), 14378–14388. DOI: 10.1021/acs.est.1c02958
(9) CRC Handbook of Chemistry and Physics, 84th ed.; CRC Press LLC, Boca Raton, 2004; pp 2475.
(10) Tanner, S. D.; Baranov, V. I.; Bandura, D. R. Reaction Cells and Collision Cells for ICP-MS: A Tutorial Review. Spectrochimica Acta Part B: At. Spectrosc. 2002, 57 (9), 1361–1452. DOI: 10.1016/S0584-8547(02)00069-1
(11) U.S. Environmental Protection Agency. Definition and Procedure for the Determination of the Method Detection Limit, Revision 2; EPA, 2016. https://www.epa.gov/sites/default/files/2016-12/documents/mdl-procedure_rev2_12-13-2016.pdf
(12) Thomas, R. Impact of Measurement Protocol on ICP-MS Data Quality Objectives: Part II. Spectroscopy 2021, 36, 19–22.
(13) Hu, X.; Cao, Z.; Sun, W.; et al. Accurate Determination of Arsenic and Selenium in Plant Food Samples by Using ICP-MS/MS. Anal. Methods 2016, 8 (32), 6150–6157. DOI:10.1039/C6AY01414C
(14) Bolea-Fernandez, E.; Balcaen, L.; Resano, M.; Vanhaecke, F. Interference-free Determination of Ultra-trace Concentrations of Arsenic and Selenium Using Methyl Fluoride as a Reaction Gas in ICP–MS/MS. Anal. Bioanal. Chem. 2015, 407 (3), 919–929. DOI: 10.1007/s00216-014-8195-8
Robert (Rob) Thomas is the principal scientist of Scientific Solutions, a consulting company that serves the educational needs of the trace element user community. He has worked in the field of atomic and mass spectroscopy for more than 50 years, including 24 years for a manufacturer of atomic spectroscopic instrumentation. Besides being the “Atomic Perspectives” column editor, Rob also serves on the editorial advisory board of Technology Networks and recently accepted the position of Assistant Adjunct Professor at the University of North Dakota. He has written over 100 technical publications, including a 15-part tutorial series on ICP-MS, and authored six textbooks on the fundamental principles and applications of ICP-MS. His most recent book is entitled Practical Guide to ICP-MS and Other Atomic Spectroscopy Techniques: A Tutorial for Beginners. Rob has an advanced degree in analytical chemistry from the University of Wales, UK, and is also a Fellow of the Royal Society of Chemistry (FRSC) and a Chartered Chemist (CChem). Direct correspondence to SpectroscopyEdit@mmhgroup.com

Benjamin P. Colman is an Associate Professor of Aquatic Ecosystem Ecology at the University of Montana. His research focuses on how chemical change in the environment affects the structure and function of ecosystems.

Dylan T. White is Ph.D. Candidate in the Systems Ecology Program at the University of Montana. He is a limnologist who researches how the biogeochemistry and ecology of lotic systems respond to anthropogenic stressors, particularly contaminants and trace metals.

Matt Young is a Research Assistant in the Environmental Biogeochemistry Laboratory at the University of Montana, specializing in elemental analysis and the study of heavy metal contaminants.

Rafael Feijó de Lima is a Postdoctoral Scholar at the Baruch Institute of Coastal Ecology and Forest Science, Clemson University. He works to better understand the impacts of land use the biogeochemistry and ecology of freshwater ecosystems.


Atomic Perspectives: Highlights from Recent Columns
March 3rd 2025“Atomic Perspectives,” provides tutorials and updates on new analytical atomic spectroscopy techniques in a broad range of applications, including environmental analysis, food and beverage analysis, and space exploration, to name a few. Here, we present a compilation of some of the most popular columns.
Pittcon 2025: Highlighting Talks on Atomic Spectroscopy
February 26th 2025At Pittcon this year, there will be numerous sessions dedicated to spotlighting the latest research that uses atomic spectroscopy or elemental analysis techniques. We highlight some of these talks below that might pique the interest of spectroscopists and researchers attending the conference this year.