An Accurate-Mass Database for Screening Pesticide Residues in Fruits and Vegetables by Gas Chromatography–Time-of-Flight Mass Spectrometry
Special Issues
The main objective of this study was to evaluate the capabilities of gas chromatography (GC) with time-of-flight mass spectrometry (MS) for screening pesticides in fruits and vegetables using a purpose-built accurate-mass database.
The main objective of this study was to evaluate the capabilities of gas chromatography (GC) with time-of-flight mass spectrometry (MS) for screening pesticides in fruits and vegetables using a purpose-built accurate-mass database. Analytical performance was tested on four matrices: potato, tomato, spring onion, and orange. Two resolution modes, 7000 FWHM and 12,000 FWHM, were tested to establish the concentration range within which automatic identification was possible, considering the retention time window of 0.2 min and at least two ions with a mass error lower than 10 ppm as the identification criteria. The effects of the matrix on identification and quantification were also studied for the four selected matrices. The developed method was applied to real samples and the qualitative and quantitative results were compared with those obtained using GC with triple-quadrupole MS.
The use of agrochemicals at various stages of crop cultivation has an important impact on food protection and quality preservation. For this reason, there are different regulations in each country on pesticide use but the lists of approved pesticides are not harmonized worldwide. This situation is becoming more important because the number of pesticides authorized in Europe (1) has been reduced to around 50% of the total number of compounds manufactured. The practical "target analysis" approach applied in many routine laboratories for pesticide residue testing consists of selecting a list of compounds that are amenable for analysis by gas chromatography (GC) and liquid chromatography (LC) using an established combined priority list. This means that the majority of low-frequency or misused compounds are not studied.
GC coupled to mass spectrometry (MS) is the technique of choice for the analysis of many classes of pesticides, particularly volatile, semivolatile, and low-polarity compounds. The large number of GC–MS applications reported for pesticides analysis in fruits and vegetables (2–7) is the result of efficient GC separation, together with spectral information and satisfactory sensitivity provided by MS. Until recently, low-resolution single-quadrupole MS detectors working in selected-ion monitoring (SIM) mode were the instruments most commonly used because of their relatively low cost, compactness, and simplicity (8).
Single-quadrupole analyzers show limitations in analyzing complex matrices, however ion-trap detection and, more recently, triple-quadrupole analyzers allow operation in tandem MS (MS2) mode, which achieves high sensitivity and selectivity, as demonstrated in an increasing number of applications reported in various fields (9,10). Recent progress in instrumentation design (mainly optics), the use of fast recording electronics, and signal processing improvements also have led to a renaissance for time-of-flight mass spectrometry (TOF-MS) in the study of organic compounds in complex matrices, particularly in LC-based applications. TOF-MS provides greater sensitivity in full-spectrum acquisition mode compared to conventional scanning instruments, principally because of its high mass-analyzer efficiency: GC–TOF-MS can screen hundreds of compounds at high sensitivity in a single run.
In addition, GC–TOF-MS data can be acquired and reprocessed without prior knowledge of the presence of certain compounds (that is, no analyte-specific information is required). Equally important is that the presence of other compounds of interest can be investigated at any time, simply by reprocessing the data (known as retrospective analysis). The high mass-resolving power and mass accuracy provided by GC–TOF-MS make it feasible to obtain extracted ion chromatograms using narrow mass windows - thus excluding a large proportion of the chemical background and isobaric interferences, which significantly improves signal-to-noise ratios. Under these conditions, pesticide identification is improved in comparison to other conventional analyzers.
Over recent years, TOF-MS has been widely used for the development of screening methods for pesticide determination in fruits and vegetables, although LC-based methods are still more widely used (11,12). Nonetheless, compounds that exhibit a very low ionization yield with electrospray sources and that have low LC–MS amenability typically are outside the scope of those LC–MS screening methods.
Nowadays, GC–TOF-MS is becoming a technique of interest within the scientific community for the determination of organic compounds (13,14). The main objective of this study was to develop a purpose-built database that includes the retention time and at least two ions for a total of 110 pesticides and to use this database in the identification of these compounds in fruit and vegetable matrices at different resolving powers.
Experimental
Chemicals and Reagents
All pesticide analytical standards used in this study were purchased from Dr. Ehrenstorfer and Sigma Aldrich at analytical grade (purity > 95%). A mixture standard solution contained all the pesticides studied and was prepared at 10 μg/mL in ethyl acetate and stored at –20 °C. Ethyl acetate was obtained from Fluka Analytical Pestanal.
Sample Treatment
The tomatoes, spring onions (called scallions in the United States), potatoes, and oranges used in this study were obtained from an organic farm in Almeria, Spain. The fruit and vegetable samples used for the application of the developed method were purchased from local markets.
The extraction method employed (15) is as follows: A representative 10-g portion of previously homogenized sample was weighed in a 200-mL PTFE centrifuge tube. Then 10 mL of ethyl acetate was added, and the tube was shaken vigorously for 3 s by hand. Next, 1.5 g of sodium chloride and 8 g of magnesium sulfate were added, and the tube was shaken in an automatic axial extractor (Agytax, Cirta Lab) for 15 min. The extract was then centrifuged at 3700 rpm for 5 min. Then the extract containing the equivalent of 1 g of sample per milliliter in 100% ethyl acetate was injected directly into the GC system.
Gas Chromatography
The separation of the pesticides from the whole fruit or vegetable extract was carried out using an Agilent 7890 GC system with two 15 m × 0.25 mm, 0.25-μm df Agilent HP–5MS UI Ultra Inert GC columns connected through an auxiliary programmable control module (PCM).
The samples were injected in splitless mode through an ultra-inert liner with a glass wool frit (Agilent). The injection volume was 2 μL. The injector temperature was held at 280 °C during the entire run time. Helium (99.999% purity) was used as the carrier gas. The oven temperature program was as follows: 60 °C for 1 min, then 60–120 °C at 40 °C/min, and 120–310 °C at 5 °C/min. The analytical separation was performed under retention time locking conditions, using clorpyrifos methyl as the locking compound at a retention time of 18.11 min. The flow rates in column 1 and column 2 were 1.225 mL/min and 1.425 mL/min, respectively. The total run time was 40.5 min with an additional 3 min for backflushing.
Backflushing was carried out to eliminate unwanted heavy materials from column 1, thereby shortening the analysis time, reducing system maintenance, and prolonging column life. The backflush conditions were set as follows: the oven temperature was set at 310 °C, the PCM pressure was 50 psi, and the inlet pressure was 1 psi. These conditions allow a negative flow on column 1.
Mass Spectrometry
The GC system was connected to an Agilent Technologies model 7200 TOF-MS instrument equipped with an electron ionization source. The ion source and quadrupole analyzer temperatures were set at 280 °C and 150 °C, respectively. The TOF analyzer was operated at two different acquisition rates, 2 GHz and 4 GHz, acquiring data in the m/z 45–550 mass range. Perfluorotributylamine was used for daily MS calibration. The accuracy of the generated ions was controlled through an internal mass calibration performed before each injection.
Creation of the Database
The experimental conditions described above were applied to create an accurate-mass database of 110 pesticides. The selected pesticides were run in a tomato matrix at a concentration of 100 μg/kg. The full-scan spectrum was studied and at least two characteristic ions (with a relative abundance higher than 30% with respect to the base peak) were selected. In most cases, the molecular ion of the pesticides was not present in the mass spectrum or its relative abundance was too low to be considered. After the ions were selected, a molecular formula was assigned, and their exact masses were calculated and used to create the database together with their retention times. All the information was collected in an Excel file, which was converted into a CSV format to be used as the library and linked to Mass Hunter data analysis software (Agilent Technologies).
Automatic Identification Using the Pesticide Database
The selected matrices were spiked with all the pesticides at four concentration levels, 10, 20, 50, and 100 μg/kg. Automatic identification was performed at two acquisition rates, 2 GHz and 4 GHz, which allowed respective mass resolutions of 7000 and 12,000 full width at half maximum (FWHM). The search parameters were 0.2 min for the retention time window and 10 ppm for the mass error tolerance.
Results and Discussion
The information obtained from this study has been discussed considering two different goals. The first was to perform screening intended to produce a yes-or-no answer while considering only two identification criteria: the retention time and a single ion with a mass accuracy of less than 10 ppm mass error. The second goal was to obtain confirmation of results and semiquantification considering two ions with a mass accuracy of less than 10 ppm mass error and the correct retention time.
Goal 1: Screening and Automatic Identification
The four selected extracts spiked at 10, 20, 50, and 100 μg/kg were analyzed at low resolution (7000 FWHM) and at high resolution (12,000 FWHM). The analysis was processed with data analysis software using the purpose-built database as the library.
The pesticides, identified automatically with the correct retention time and one ion with a mass accuracy of less than 10 ppm mass error, were counted and compared with the total number of pesticides included in the database to calculate the percentage of pesticides identified.
The results obtained operating at 7000 FWHM are shown in Figure 1. The green columns for each concentration level are the pesticide percentages with at least two ions having an error lower than 10 ppm and a retention time difference of less than 0.2 min. The orange columns are the pesticide percentages with at least one ion with a mass error lower than 10 ppm and a retention time error of less than 0.2 min. The columns in red are the compound percentages not detected or detected with a mass error higher than 10 ppm.
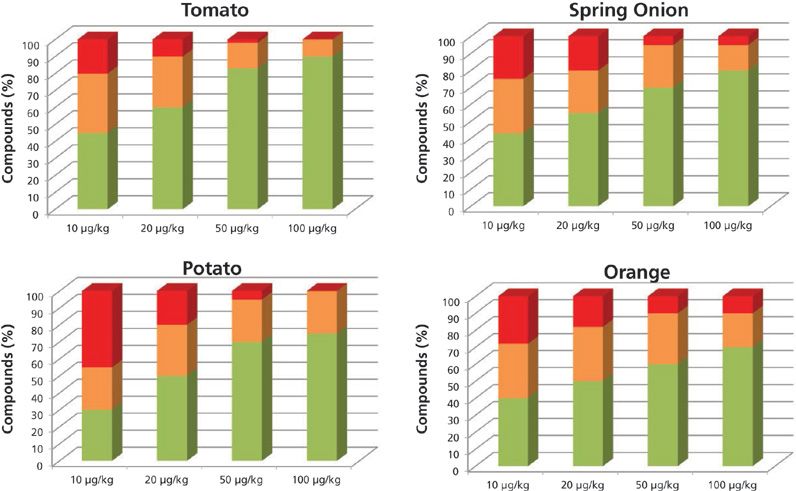
Figure 1: Percentage of compounds included in the databases identified automatically with more than two ions (green), one ion (orange), and not identified (red), working at low resolution.
At the 10-μg/kg level, the percentages of pesticides identified with at least one fragment and the correct retention time were as follows: 80% in tomato, 50% in potato, 76% in spring onion, and 70% in orange. As expected, at higher concentration levels, the percentage of pesticides found was higher.
Figure 2 shows the results of the studied matrix at the different concentration levels obtained when operating the system at high resolution (12,000 FWHM). At this acquisition rate, the percentage of positives at all concentration levels, and in all matrices, is higher than when operating at low resolution. At 10 μg/kg, the percentages of pesticides identified with at least one fragment and the correct retention time were as follows: 88% in tomato, 91% in potato, 88% in spring onion, and 82% in orange. At 20 μg/kg, 100% of the pesticides included in the database for tomato were identified with at least two ions and a mass error < 10 ppm along with a retention time < 0.2 min. The pesticide identification rates for the spring onion, potato, and orange were 95%, 97%, and 85%, respectively. Operating at high resolution, the number of pesticides found with a mass error below the level established as the mass tolerance was higher than at low resolution.
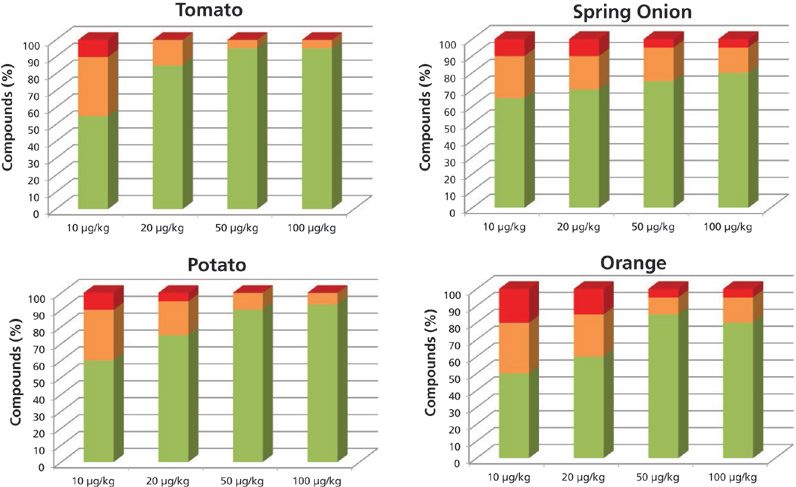
Figure 2: Percentage of compounds included in the databases identified automatically with more than two ions (green), one ion (orange), and not identified (red), working at high resolution.
An important influence on mass assignments is the ability of a mass spectrometer to resolve two peaks on the m/z scale when they are close together.
When peaks are not (fully) resolved, the resulting measured mass profile will be the sum of the two individual mass profiles, and the maximum of the combined profile will lie somewhere between the exact masses of the two individual peaks. As a consequence, the mass assignment, which is based on a centroiding algorithm of the detected profile, will result in an incorrect analyte mass. As sample complexity becomes greater (a larger number of matrix peaks at high levels relative to the analytes), the mass resolution (defined as an MS instrument's ability to distinguish between two ions with similar m/z values) of a mass spectrometer can become a key parameter in the correct assignment of analyte masses.
Figure 3 shows the full-scan chromatogram of the four matrices selected for this study. The total ion chromatogram in red corresponds to the orange matrix; the chromatogram in black corresponds to spring onion; green corresponds to potato; and blue corresponds to tomato. Orange shows the largest number of matrix interferences.
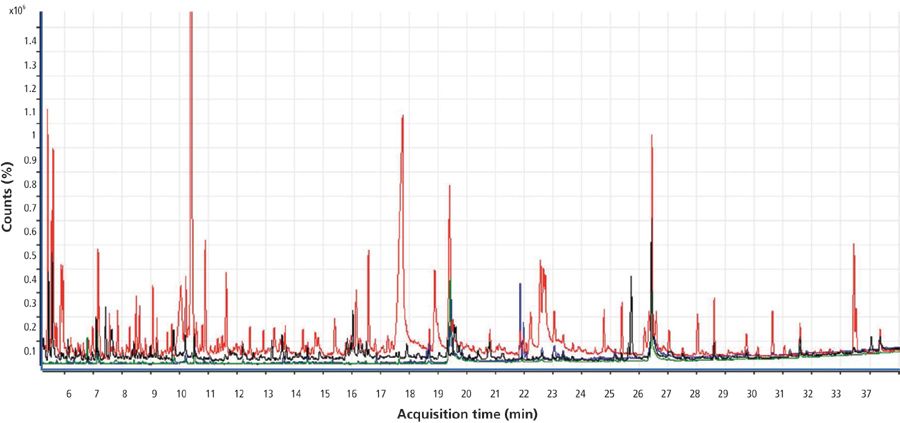
Figure 3: Total ion chromatogram for orange (red), tomato (blue), potato (green), and spring onion (black) obtained by GC–TOF-MS.
Figure 4 is an example showing the analysis of benalxyl at 20 ppb in tomato analyzed at both low and high resolution. If we set the mass tolerance to 10 ppm, only two ions are identified when operating at 7000 FWHM, whereas all the ions are identified at 12,000 FWHM.
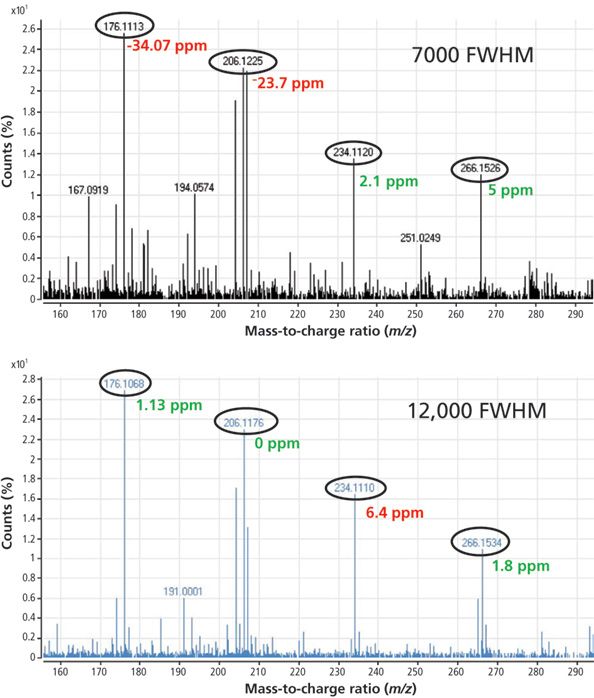
Figure 4: Mass spectra for benalaxyl in tomato at 20 μg/kg obtained at low and high resolution using GC–TOF-MS.
Figure 5 is an example of an analysis in the orange matrix. In this case the mass spectrum of the pesticide nuarimol is shown at low and high resolution. At low resolution only one ion is correctly identified, whereas at high resolution two ions were identified with a mass error lower than that established.
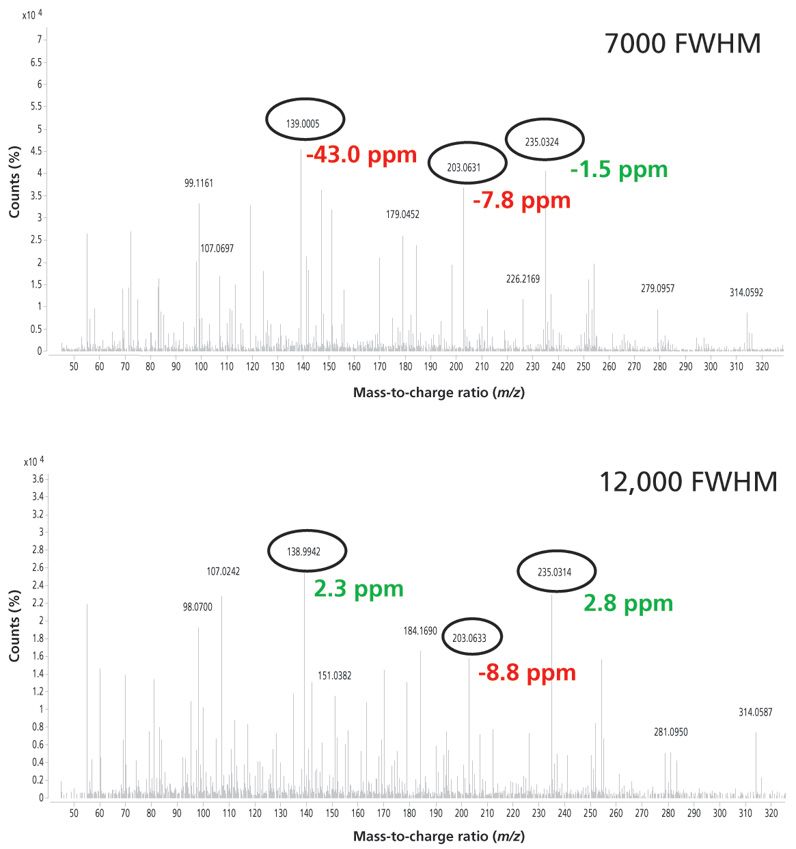
Figure 5: Mass spectra for nuarimol in orange at 20 μg/kg obtained at low and high resolution using GC–TOF-MS.
Goal 2: Confirmation and Semiquantification
With the purpose of using the developed method for confirmation and semiquantification, we considered the identification criteria to be the identification of at least two ions with a mass error lower than 10 ppm and a retention time error lower than 0.2 min. The pesticide percentages that meet these criteria are as follows: Operating at high resolution, more than 70% of the pesticides were detected at the 20 μg/kg level in tomato, potato, and spring onion (Figure 2) with a mass error lower than 10 ppm, and with a retention time error lower than 0.2. In the orange, 60% of the pesticides were detected.
After it was known that identification and further confirmation worked far better at high resolution, the linearity of the response was studied between 10 and 100 μg/kg operating at high resolution, and very good linearity was observed in this range, showing correlation coefficients better than 0.999, except in these specific cases: benalaxyl, tetraconazole, and flutolanil in orange; butralin, etoxyquine, and p,p´–DDT in tomato; and pirimifos methyl, pyriproxyfen, tetraconazole, tetradifon, and tolylfluanide in spring onion.
Given that screening methods are intended to be used with a large number of matrices, a semiquantification study of samples was performed in the tomato matrix-matched solution at two concentration levels, 10 and 100 μg/kg. The results were compared with those obtained using a GC–triple-quadrupole MS system in which the concentration of the samples was calculated with a calibration curve in matrix-matched solution performed with different commodities, depending on the analyzed samples.
The selection of tomato as the quantification matrix was based on the results obtained from a matrix effect study. The slope of all the matrices obtained from the linear curve in the range between 10 and 100 μg/kg was compared with the slope obtained in solvent. All matrices showed a marked signal enhancement effect when compared with solvent; however, the differences in the slopes between matrices were very small.
Real samples were analyzed with the developed method, and some of the pesticides found are listed in Table I. The results were compared with those obtained by GC–triple-quadrupole MS; the samples were also semiquantified as described above, and the results obtained are also shown in Table I. The quantification differences for both systems are mostly within 50%. In some cases the pesticide concentration was high, which caused detector saturation; such samples were injected after dilution for better identification and quantification. This was the case of iprodione in the bean samples. Another special case was bifenthrin in tomato; this compound was identified with only one ion because other characteristic ions showed errors higher than those established.

Table I: Real samples identified and quantified with the proposed method and compared to GC–triple-quadrupole MS. Values listed in parentheses are the concentrations that were found in the samples.
Conclusions
The created database of 110 pesticides, which included the retention time and at least two ions, was applied to automatic pesticide identification in tomato, potato, spring onion, and orange. This automatic identification was made and compared at two resolution powers, showing better results in high-resolution mode. The identification of nearly 100% of pesticides included in the database was demonstrated at low concentration levels (10 and 20 μg/kg) in all the studied matrices except in orange, where the pesticide identification percentage was 85%. In addition, the method was applied for the analysis of real samples, and the obtained results were compared with those using GC–triple-quadrupole MS, showing differences in the quantification results of less than 50%.
Noelia Belmonte, Samanta Uclés, Carmen Ferrer, Milagros Mezcua, PhD, and Professor Amadeo R. Fernández-Alba, PhD, are all withthe Agrifood Campus of International Excellence (ceiA3) and the European Union Reference Laboratory for Pesticide Residues in Fruit & Vegetables, at the University of Almeria, in Almeria, Spain. Miguel Gamón, PhD, is with the Agro-Food Analysis Service of the Generalitat Valenciana and the European Union Reference Laboratory. Direct correspondence to Milagros Mezcua at mmezcua@ual.es
References
(1) The European Parliament and the European Council, Regulation (EC) No. 396/2005 of the European Parliament and of the Council of 23rd February, 2005 on maximum residue levels of pesticides in or on food and feed of plant and animal origin and amending Council Directive 91/414/ECC (Brussels, Belgium, 2005).
(2) K. Banerjee, S. Mujawar, S.C. Utture, S. Dasgupta, and P.G. Adsule, Food Chem.138(1), 600–607 (2013).
(3) M.L. de Oliveira, F.D. Madureira, F. Aurélio, A.P. Pontelo, G. Silva, R. Oliveira, and C. Paes, Food Addit. Contam. Part A Chem. Anal. Control Expo. Risk Assess.29(4), 657–664 (2012).
(4) V.C. Fernandes, J.L. Vera, V.F. Domingues, L.M.S. Silva, N. Mateus, and C. Delerue-Matos, J. Am. Soc. Mass Spectrom.23(12), 2187–2197 (2012).
(5) C.J. Anagnostopoulos, G. Balagiannis, and G.E. Miliadis, Spectroscopy Letters45(3), 202–218 (2012).
(6) L. Cherta, J. Beltran, T. Portolés, and F. Hernández, Anal. Bioanal. Chem. 402(7), 2301–2314 (2012)
(7) M.A., Martínez-Uroz, M. Mezcua, N.Belmonte Valles, and A.R Fernández-Alba, Anal. Bioanal.Chem. 402(3), 1365–1372 (2012).
(8) M. Mezcua, M.A. Martínez-Uroz, P.L. Wylie, and A.R. Fernández-Alba, J. AOAC Int.92(6), 1790–1806 (2009).
(9) M. Zhiling, Z. Wen, L. Lingyun, Z. Shuning, L. Huan, Z. Yanguo, G. Qingzhen, and L. Su, Chin. J. Chromatogr.31(3), 228–239 (2013).
(10) U. Koesukwiwat, S.J. Lehotay, and N.J. Leepipatpiboon, J. Chromatogr. A 1218(39), 7039–7050 (2011).
(11) M. Mezcua, O. Malato, M.A. Martinez-Uroz, A. Lozano, A. Agüera, and A.R. Fernández–Alba, J. AOAC Int.94(6), 1674–1684 (2011).
(12) C. Ferrer, O. Malato, A. Agüera, and A.R. Fernandez–Alba, Comprehensive Anal. Chem.58, 1–60 (2012)
(13) F. Hernandez, T. Portoles, E. Pitarch, and F.J. Lopez, Trends Anal. Chem. 30(2), 388–400 (2011).
(14) F. Zhang, C. Yu, W. Wang, R. Fan, Z. Zhang, and Y. Guo, Anal. Chim. Acta 757, 39–37 (2012).
(15) S. Uclés, N. Belmonte, M. Mezcua, A.B. Martínez, M.J. Martínez-Bueno, M. Gamón, and A.R. Fernández-Alba, J. Envir. Sci. Health, Part B. (submitted).

Best of the Week: AI and IoT for Pollution Monitoring, High Speed Laser MS
April 25th 2025Top articles published this week include a preview of our upcoming content series for National Space Day, a news story about air quality monitoring, and an announcement from Metrohm about their new Midwest office.
LIBS Illuminates the Hidden Health Risks of Indoor Welding and Soldering
April 23rd 2025A new dual-spectroscopy approach reveals real-time pollution threats in indoor workspaces. Chinese researchers have pioneered the use of laser-induced breakdown spectroscopy (LIBS) and aerosol mass spectrometry to uncover and monitor harmful heavy metal and dust emissions from soldering and welding in real-time. These complementary tools offer a fast, accurate means to evaluate air quality threats in industrial and indoor environments—where people spend most of their time.