Analysis of Organic Compounds in Water Using Unique Concentration–Injection Techniques for Portable GC–MS
Special Issues
A simple method for extraction and concentration of trace organic compounds found in water for gas chromatography-mass spectrometry (GC-MS) analysis was developed. The method used 25 and 45 mL glass vials with a 5-10 µm thick polymer coatings for extraction of analytes from 20 and 40 mL water samples, respectively. Analytes were subsequently transferred from the polymer coating into an organic solvent, which was reduced in volume to 200-400 µL for analysis. A 10-20 µL sample from the vial was transferred to a tiny coiled stainless steel wire filament using a micro-syringe, or by dipping the coil into the sample. After air evaporation of the solvent, the coil was inserted into the heated injection port of a portable GC-MS system where the analytes were desorbed. Injection using the coiled wire filament eliminated sample discrimination of high boiling point compounds, and minimized system contamination caused by sample matrix residues. The GC-MS contained a new resistively heated column bundle that allowed elution of low-volatility compounds in less than 4 min. Analyses of organochlorine pesticides, polycyclic aromatic hydrocarbons, polychlorinated biphenyl congeners, pyrethroid insecticides, phthalate esters, and n-alkanes in water and wastewater samples were accomplished for low ppb concentrations in less than 10 min total analysis time.
A simple method for extraction and concentration of trace organic compounds found in water for gas chromatography–mass spectrometry (GC–MS) analysis was developed. The method used 25- and 45-mL glass vials with 5–10 µm thick polymer coatings for extraction of analytes from 20- and 40-mL water samples, respectively. Analytes were subsequently transferred from the polymer coating into an organic solvent, which was reduced in volume to 200–400 µL for analysis. A 10–20 µL sample from the vial was transferred to a tiny coiled stainless steel wire filament using a microsyringe, or by dipping the coil into the sample. After air evaporation of the solvent, the coil was inserted into the heated injection port of a portable GC–MS system where the analytes were desorbed. Injection using the coiled wire filament eliminated sample discrimination of high boiling point compounds and minimized system contamination caused by sample matrix residues. The elution of low-volatility compounds was accomplished in less than 4 min. Analyses of organochlorine pesticides, polycyclic aromatic hydrocarbons, polychlorinated biphenyl congeners, pyrethroid insecticides, phthalate esters, and n-alkanes in water and wastewater samples were accomplished for low parts-per-billion concentrations in a total analysis time of less than 10 min.
Sample preparation procedures in analytical chemistry are often laborious and time consuming, and they require specific tools and special instrumentation. Sample preparation is mainly based on extraction techniques that have unique specifications. Solid-phase microextraction (SPME), a popular technique with a range of coating materials and new structures such as over-coated fibers and arrows, has helped to simplify complicated sample extraction for a wide range of analytes in air, water, and solid matrices (1–10). Solid-phase extraction (SPE), mostly used for isolating target analytes from liquid samples, has been improved and diversified, thanks to new and effective sorbent types and designs (11–14). Stir-bar sorptive extraction (SBSE), an effective technique for extracting trace solutes from an aqueous sample into a coating (primarily a polysiloxane) on a stir bar, has been improved by continually adding new coating materials (15–23). QuEChERS, which is an acronym for quick, easy, cheap, effective, rugged and safe, involves liquid-liquid partitioning using “salting-out” acetonitrile, and purifying the extract using dispersive solid-phase extraction (dSPE). QuEChERS is primarily used to analyze pesticides in fruits and vegetables (with high water content) and a variety of other analytes in environmental matrices such as soils, sediments, and water (24–29).
Although these extraction techniques have significantly simplified the determination of multiple target analytes in diverse sample matrices, they still do not satisfy all requirements for fast analysis (several minutes), low limits of detection (low parts per billion) and, especially, ease of use in the field. Field testing is normally conducted using limited sample preparation tools and equipment, and by relatively untrained operators. Sample preparation techniques for field testing must combine selected features of the various extraction techniques described above.
Polymer-Coated Vial
One example of such a technique is extraction using a polymer-coated vial (PCV) that is based on partitioning analytes from a sample solution into a polymer, such as polydimethylsiloxane (PDMS), coated on the inner wall of a glass vial (Figure 1). In this work, two coated vials, 25 and 45 mL, were used. After coating, polymerization, and cross-linking, the immobilized PDMS film provided a hydrophobic surface that attracted the target hydrophobic contaminants present in aqueous matrices. Fortunately, PDMS is very stable when exposed to different solvents (slight swelling is the major effect with solvents such as acetone, chloroform, and dichloromethane); therefore, it is feasible to use the most common solvents to recover the target analytes absorbed into the PDMS layer. By properly recovering the analytes from the film on the vial wall (that is, using the right solvent, solvent volume, and time), these sampling vials can be used many times before having to be replaced. A small extracting solvent volume and short sampling period are important characteristics for field sampling. Any slight swelling of the film after use can be restored simply by heat reconditioning.
Figure 1: PDMS-coated vial and polymer-coated solid-phase extraction devices.
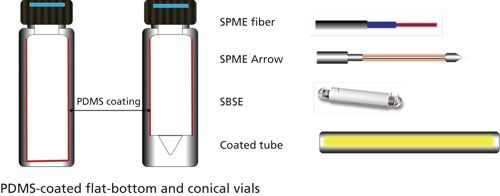
The surface area of the PCV is much higher than that of a conventional SPME fiber, allowing easy and rapid interaction between the sample and extraction medium, which is more efficient than SPE and QuEChERS. Table I indicates the large difference in surface areas of the coated vials compared to several conventional extraction techniques, including SPME, SBSE, and coated tubes (Figure 1).
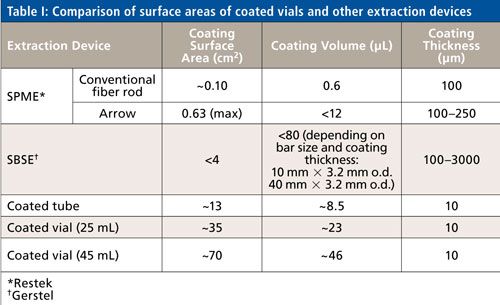
The operating principle of the PCV is similar to SPME or SBSE devices. The large hydrophobic surface area of the PCV (up to ~70 cm2 for a 45-mL vial and 35 cm2 for a 25-mL vial) absorbs slightly polar and nonpolar target analytes from the sample matrix. After absorption, the remaining matrix is poured out and the analytes are back-extracted into a small amount of solvent. A washing step with deionized (DI) water may be required to remove residual sample matrix before back extracting the analytes. If desired, a concentration step is added before introducing the sample into the analytical instrument (that is, a gas chromatography–mass spectrometry [GC–MS] system). PCVs of various sizes, shapes, and coatings can be used, depending on the application of interest. Automation in manufacturing and the use of PCVs would be logical extensions of this work.
A PDMS-coated PCV can be reused many times by reconditioning with solvent washes or by heat treatment. Because it is a solid–liquid extraction technique, treatments such as heating, salting-out, adjusting the pH, shaking, and so forth, can be applied to accelerate and improve the extraction efficiency. PDMS-coated PCVs can be used for both volatile organic compound (VOC) and semivolatile organic compound (SVOC) extractions. In this work, we mainly focused on using the PCV for rapid SVOC screening using a hand-portable GC–MS system.
Coiled Wire Filament
A coiled wire filament (CWF) was developed for sampling, concentrating, and injecting samples into a GC–MS system, while minimizing contamination (30). This device consisted of a tiny, deactivated, coiled stainless steel wire filament attached to a holder with a retractable plunger that could move the CWF in and out of the needle or a liquid sample, which filled the wire coil by capillary action. Sampling was also done by applying a specific volume of sample onto the CWF using a microsyringe. The analytes could then be introduced into the injection port of the GC–MS system either before or after evaporating the solvent (30). Figure 2a shows a drawing of the CWF sampler with holder.
Figure 2: (a) Drawing of the coiled wire filament and holder. (b) Sample preparation steps using a conical bottom PDMS coated vial.
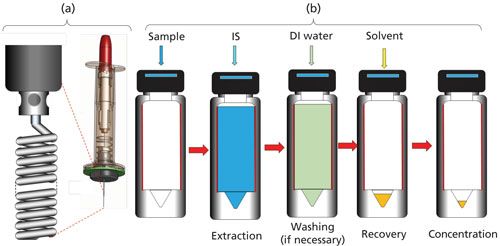
The easiest method to inject sample into the GC–MS system using the CWF is by dipping the end of the coil into the sample solution in the vial. However, it can also be used for sampling a large volume of sample (up to several tens of microliters) by applying approximately 5-µL volumes of sample solution onto the CWF repetitively, each time after the solvent evaporates. Using the CWF for injection helps to minimize the accumulation of sample residues in the GC–MS injection port, thereby extending the time needed before cleaning. Sample residues remaining on the CWF surface can be washed off using a suitable solvent or removed by applying heat (for example, using a heat gun).
Hand-Portable GC–MS
Over the last decade, hand-portable GC–MS systems have played a major role in key environmental and forensic applications (31). Both chromatographic and MS features have been continually improved to satisfy the requirements of miniaturization-that is, mobility, ease of use, speed of analysis, and detection sensitivity for operators who have limited analytical training and who prefer to use simple sample preparation tools (32–35).
Figure 3: Plot of peak intensity versus extraction time (30 s to 960 s with shaking) of 15 organochlorine pesticides (OCPs) spiked in water samples. S1–S7 and their respective bar colors represent the seven different shaking times. Numbers on the x-axis represent the OCPs listed in Table III.
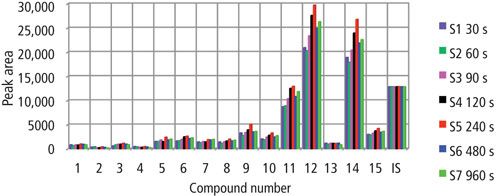
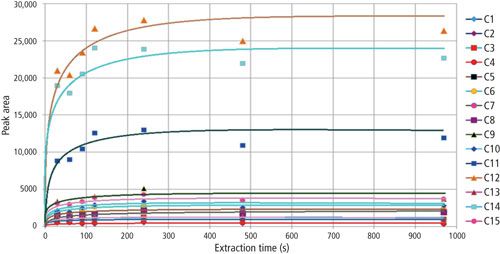
Figure 4: Experimental extraction equilibrium curves for OCPs based on peak intensities versus extraction times.
Experimental
PDMS-Coated Vials
A thin PDMS layer was manually coated on the inside of each vial used in this work (typically with a conical bottom) by conventional spin coating. A mixture of PDMS elastomer and curing agent (10:1 w/w) was dissolved in dichloromethane (10% w/v), and a small volume (125–250 µL) was introduced into the vial and manually spun horizontally to allow the coating solution to cover the inner surface area of the vial (except for the conical bottom) while the dichloromethane slowly evaporated. After the solvent was completely evaporated, the vial was heated inside an oven from ambient temperature to 150 °C at a rate of 3–5 °C/min and held at 150 °C for 3 h to crosslink the polymer film. The PDMS-coated vial was then conditioned by programming the temperature from 50 °C to 300 °C at 10 °C/min and then holding for at least 10 h before use. The approximate thickness of the PDMS film was calculated based on the amount of PDMS solution used, the density of the polymer, and the inner surface area of the vial.
A step-by-step procedure for sampling using a PCV was performed as follows (see Figure 2b):
Step 1: Sample Addition
A small volume (depending on concentration) of sample is introduced into a PCV (25- or 45-mL vial).
Step 2: Internal Standard Addition
A specific amount of internal standard solution is added.
Step 3: Sample Extraction
The sample plus internal standard is shaken for a specified time (for example, 10 s), to allow analytes to partition into the polymer film.
Step 4: Removal of Sample Matrix
The sample matrix is discarded after extraction, and the vial is washed with deionized water or a suitable solution to remove further sample matrix residues.
Step 5: Analyte Back-Extraction
A 200- or 400-µL volume of a suitable solvent (for a 25- or 45-mL PCV, respectively) is introduced into the vial to back extract the target analytes out of the polymer film by shaking for 1 min, making certain that the solvent is exposed to the entire inner surface of the vial. The solvent containing the analytes is allowed to drain to the bottom of the vial or transferred to a 2-mL small conical-bottom vial if the original PCV does not have a conical bottom.
Step 6: Concentration
If further concentration is desired, the solvent is further evaporated by leaving the vial open to the atmosphere or by applying an inert gas purge (N2, He, or dry air) at a 400–500 mL/min flow.
Step 7: Sample Injection
Solvent-free sample introduction into a GC–MS system was performed in this study using a CWF.
Coiled Wire Filament
The CWF used in this work was prepared from deactivated stainless steel wire that was coiled into 70 rings with a 0.5-µL capacity-that is, the volume of sample captured in the internal volume of the coil by capillary action when its end was dipped into the sample solution. Manufacturing specifications for the CWF: deactivated 304V SS, 0.0035 in. o.d. (0.0889 mm), 0.014 in. ± 0.0002 in. (0.3556 mm ± 0.00508 mm) coil o.d., 1.20 cm ± 0.05 cm coil length, 0.007 in. ± 0.0005 in. (0.1778 ± 0.0127 mm) coil pitch. Each CWF had a straight length (0.06 cm) of wire at one end for connection to the filament holder.
The CWF was used for injecting sample into the GC–MS system by either dipping the end of the coil into the sample solution and allowing the coil to fill by capillary action, or by applying a measured volume of sample onto the CWF using a syringe. Using the syringe approach, a large amount of sample (10–20 µL, or even more) could be applied to the coil.
Hand-Portable GC–MS and Desktop GC Conditions
A hand-portable GC–MS system (TRIDION-9, PerkinElmer) was used to demonstrate SVOC sample analyses, while a desktop GC system (Clarus 680, PerkinElmer) with flame ionization detection (FID) was used to investigate the performance of the PDMS-coated extraction vials. A resistively heated column bundle for the hand-portable GC–MS consisted of a 5 m x 0.1 mm stainless steel capillary column coated with a 0.4-μm film of MS-5 polysiloxane stationary phase. Other GC–MS operating conditions were as follows: inlet pressure, 30 psi; injection, splitless; injection time, 30–60 s; temperature program, 50-315 °C at 2 °C/s; ion-trap temperature, 210 °C; mass range, 43–500 amu.
The operating conditions for the Clarus GC system were as follows: column, 15 m x 0.25 mm fused silica capillary column coated with a 0.25-µm film of MS-5 stationary phase; inlet pressure, 4 psi; injection, split-splitless at 300 °C (5:1 split); injection time, 60 s; temperature program, 50–300 °C at 40 °C/min; detection, FID at 300 °C.
Chemicals
High performance liquid chromatography (HPLC)-grade dichloromethane, acetone, methanol, and acetonitrile were purchased from Sigma-Aldrich. The phthalate esters were purchased from Sigma-Aldrich, and the polycyclic aromatic hydrocarbons (PAHs), polychlorinated biphenyls (PCBs), organochlorine pesticides (OCPs), pyrethroid insecticides, and n-alkanes were purchased from AccuStandard.
Extraction Studies
Experiments were conducted to evaluate the performance of the PDMS-coated vials for extracting SVOCs of environmental interest. Organochlorine pesticides were first used to determine the required time to achieve good extraction efficiency, followed by an assessment of the reproducibility of the technique. Then a variety of target analytes, including petroleum hydrocarbons, PAHs, PCBs, phthalate esters, n-alkanes, and pyrethroid pesticides, were analyzed in water samples. An internal standard was typically used for quantitation (added either during sample preparation or immediately before extraction).
The effects of extraction time on extraction efficiency were investigated by conducting a series of analyses of tap water spiked with organochlorine pesticides. All samples were spiked at the same concentration and extracted for different times with manual shaking. The corrected peak areas of the analytes (based on the internal standard perylene) were used to compare the results. Seven 40-mL water samples spiked with OCPs at 2 ppb were extracted using 45-mL PDMS-coated flat-bottom vials. After introducing the spiked samples into the coated vials, they were labeled from one to seven and shaken for 30, 60, 90, 210, 240, 480, and 960 s, respectively. After extraction, 400 µL of methylene chloride and 5 µL of 20 ppm perylene internal standard were used to back-extract the analytes. After shaking for 60 s, the solution was transferred to a 2-mL conical-bottom vial and concentrated by leaving the vial open until approximately 50 µL of solution remained. Two volumes of 5 µL each were placed onto the CWF using a microsyringe, the solvent was evaporated (10 s), and the CWF was inserted into the GC injection port for 60 s.
For determining the reproducibility of the method, six 40-mL volumes of 5 ppb OCPs spiked in tap water were introduced into 45-mL conical-bottom coated vials and extracted for 2 min (after adding 5 µL of perylene internal standard) with manual shaking. The analytes were back-extracted with 400 µL of dichloromethane, and the solution was concentrated until approximately 50 µL remained. Two 5-µL samples were introduced onto the CWF, the solvent was allowed to evaporate, and the CWF was introduced into the injection port of the Clarus 680 GC system.
Analysis of Target Analytes in Water
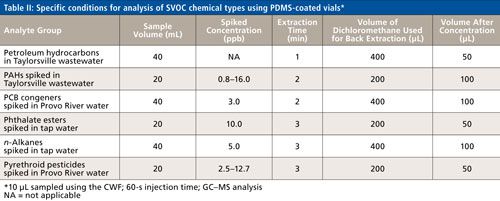
The PCV and CWF techniques were applied to a variety of target analyte classes present in tap water or wastewater samples to demonstrate their broad applicability. These analyte classes included petroleum hydrocarbons, PAHs, PCBs, phthalate esters, n-alkanes, and pyrethroid pesticides. The general procedures for sample preparation and analysis were described in detail (for organochlorine pesticides) in the previous section. Table II lists the specific conditions for each of the additional target analyte chemical classes.
CLICK TABLE TO ENLARGE
Results and Discussion
PDMS-Coated Vial Extraction
In the OCP extraction experiments, most of the extraction occurred during the initial short agitation (shaking) time. The large sorptive surface area and thin PDMS film in the coated vial greatly facilitated the extraction process. This behavior agrees well with SPME theory (36) in that the extraction time in perfect agitation is inversely proportional to the surface area of the coating:

When Vs >> KfsVf,


where n is the number of moles of analyte extracted by the coating, Co is the analyte concentration, Kfs is the distribution coefficient of the analyte between the coating and the sample matrix (Kfs = Cf∞/Cs∞ where Cf∞ and Cs∞ are the concentrations of analyte in the coating and sample at equilibrium), Vs is the sample volume, Vf is the coating volume, te is the equilibrium time (actually, infinitely long), t95% is the equilibrium time when 95% of the analyte is extracted from the sample, df is the coating thickness, and Df is the diffusion coefficient of an analyte in the coating.
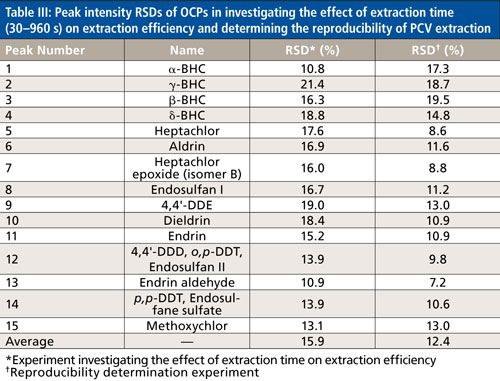
From these equations, the extraction time is directly proportional to the square of the coating thickness, df2, and the extraction capacity or the sensitivity is directly proportional to the coating volume. For a given coating volume, a thick coating results in long extraction time and a large surface area results in a thinner coating and faster equilibration times (37). The PCVs provide 350–700 fold higher surface areas than conventional SPME (Table I), which results in faster extraction, higher sensitivity, and extraction capacity. Therefore, when using PCVs, a long agitation time is not necessary, which minimizes analyte losses from adsorption, evaporation, or microbial degradation during transportation and storage. Figures 3 and 4 show plots of peak intensity versus extraction time and equilibrium curves, respectively, for OCPs. These curves indicate that the t95% of 17 OCP compounds varied from 2 to 3 min when shaking was used. The peak areas of the analytes were almost the same, although the samples were prepared using different extraction times and manual shaking. Table III shows that the peak area average relative standard deviation (RSD) (15.9%) of OCP extraction time (30–960 s) on extraction efficiency was not significantly different from that of reproducibility (12.4%). This indicates that the relative independence of partitioning of analytes with respect to conditions such as time and agitation is an advantage of the PCV approach for field applications, enabling easy and productive field testing using hand-portable GC–MS.
Detection of Various SVOC Types in Water Samples
Petroleum hydrocarbons exist in almost all river waters and wastewaters. They are common contaminants, but are not generally regulated as hazardous wastes. However, the presence of large amounts of these hydrocarbons interferes with sample preparation and detection of SVOCs in water samples using chromatographic methods. The analysis of a wastewater sample from Taylorsville, Utah, was conducted using a 45-mL PDMS-coated vial. Extracted-ion chromatograms generated by the hand-portable GC–MS system helped to rapidly determine SVOCs in various water samples. The PCVs provided sufficient sample cleanup without having to rely on treatments such as salting-out, pH adjustment, stirring, and heating, which are typically used to speed up and improve the extraction efficiency. The PCVs combined with CWF sampling and GC–MS provided reliable detection of SVOCs at low parts-per-billion concentrations. Figure 5a presents the total-ion-current (TIC) and deconvoluted chromatograms of petroleum hydrocarbons found in the wastewater sample.
Figure 5: TIC and deconvoluted chromatograms of petroleum hydrocarbons in a Taylorsville wastewater sample extracted using a PDMS-coated vial: (a, b) TIC and deconvoluted chromatograms and (c) extracted-ion chromatogram of PAHs spiked in wastewater at concentrations of 0.8–16 ppb. The target compounds were detected from a high petroleum hydrocarbon background: 1 = naphthalene, 2 = 2-methylnaphthalene, 3 = 1-methylnaphthalene, 4 = acenaphthylene, 5 = acenaphthene, 6 = fluorene, 7 = phenanthrene, 8 = anthracene, 9 = fluoranthene, 10 = pyrene, 11 = benz[a]anthracene, 12 = chrysene, 13 = benzo[b]fluoranthene, 14 = benzo[k]fluoranthene, 15 = benzo[a]pyrene, 16 = benzo[ghi]perylene, 17 = dibenz[a,h]anthracene, 18 = indeno[1,2,3-cd]pyrene.
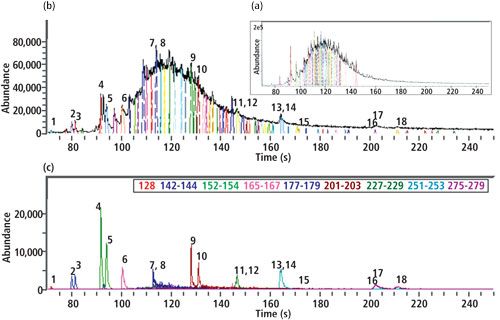
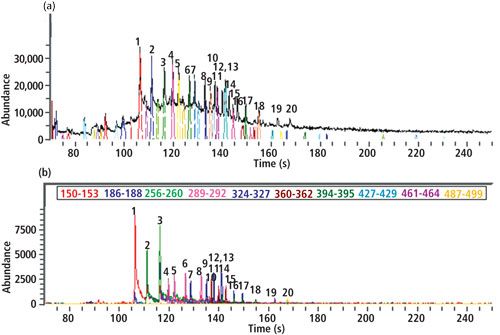
Detection of PAH and PCB congeners in wastewater was done to further evaluate the ability of the PCV to extract these trace contaminants from a complicated environmental sample. The wastewater sample (from Taylorsville, Utah) was extracted after spiking with PAH and PCB congeners. Although the target analytes (PAH and PCB congeners) were present in a high concentration of petroleum hydrocarbons, they were easily detected by a combination of deconvolution and extracted-ion monitoring. Figures 5 and 6 present TIC, deconvoluted, and extracted-ion chromatograms of spiked PAHs and PCBs, respectively.
Figure 6: (a) TIC and deconvoluted chromatograms and (b) extracted-ion chromatogram of PCB congeners at a concentration of 3 ppb spiked into a river water sample. Peaks: 1 = 2,4’-dichlorobiphenyl, 2 = 2,2’,5-trichlorobiphenyl, 3 = 2,4,4’-trichlorobiphenyl, 4 = 2,2’,5,5’-tetrachlorobiphenyl, 5 = 2,2’,3,5’-tetrachlorobiphenyl, 6 = 2,3’,4,4’-tetrachlorobiphenyl, 7 = 3,3’,4,4’-tetrachlorobiphenyl, 8 = 2,2’,4,5,5’-pentachlorobiphenyl, 9 = 2,3,3’,4,4’-pentachlorobiphenyl, 10 = 2,3’,4,4’,5-pentachlorobiphenyl, 11 = 3,3’,4,4’,5-pentachlorobiphenyl, 12 = 2,2’,3,3’,4,4’-hexachlorobiphenyl, 13 = 2,2’,4,4’,5,5’-hexachlorobiphenyl, 14 = 2,2’,3,4,4’,5’-hexachlorobiphenyl, 15 = 2,2’,3,4’,5,5’,6-heptachlorobiphenyl, 16 = 2,2’,3,4,4’,5,5’-heptachlorobiphenyl, 17 = 2,2’,3,3’,4,4’,5-heptachlorobiphenyl, 18 = 2,2’,3,3’,4,4’,5,6-octachlorobiphenyl, 19 = 2,2’,3,3’,4,4’,5,5’,6-nonachlorobiphenyl, 20 = decachlorobiphenyl.
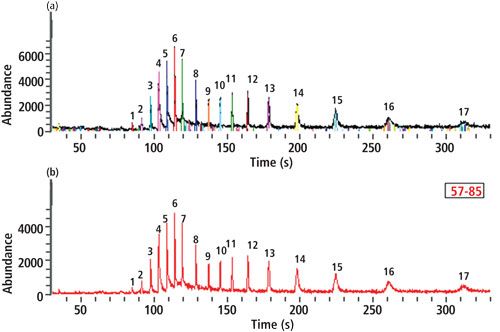
In easier to analyze matrices such as tap and river waters, six phthalate esters, 17 high-molecular-weight alkanes (C14–C40), and eight pyrethroid pesticides were also detected in less than 10 min. CWF injection virtually eliminated discrimination of SVOCs often experienced when using conventional syringe injection, enabling low concentration compounds such as high boiling point alkanes (C30–C40), deltamethrin, benzo[ghi]perylene, dibenz[a,h]anthracene, and indeno[1,2,3-cd]pyrene.
Figures 7–9 show total ion, deconvoluted, and extracted-ion chromatograms of phthalate esters, n-alkanes, and pyrethroid pesticides extracted from water, respectively. Table IV summarizes the detection limits obtained for SVOCs analyzed using the methods described in this work.
Figure 7: (a) TIC and deconvoluted chromatograms and (b) extracted-ion chromatogram of phthalate esters spiked at 10 ppb in tap water. Peaks: 1 = dimethyl phthalate, 2 = diethyl phthalate, 3 = dibutyl phthalate, 4 = benzylbutyl phthalate, 5 = bis(2-ethylhexyl) phthalate, 6 = di-n-octyl phthalate.
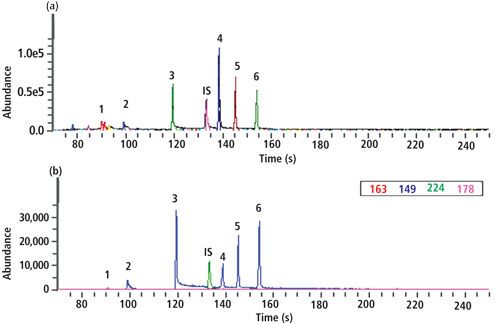
Figure 8: (a) TIC and deconvoluted chromatograms and b) extracted-ion chromatogram of n-alkanes (C14–C40) spiked at 5 ppb in tap water. Peak identifications: 1 = C14, 2 = C15, 3 = C16, 4 = C17, 5 = C18, 6 = C19, 7 = C20, 8 = C22, 9 = C24, 10 = C26, 11 = C28, 12 = C30, 13 = C32, 14 = C34, 15 = C36, 16 = C38, 17 = C40.

CLICK TABLE TO ENLARGE
Conclusions
PCV extraction was developed as a fast and simple sample preparation technique for detection of SVOCs in water samples in the field. Common SVOC contaminants at low parts-per-billion levels were detected in less than 10 min using a combination of PCV extraction, CWF injection, and GC–MS analysis. The PCV is a solid–liquid extraction device that could be used to advantage for liquid chromatography (LC) and LC–MS analysis as well as for GC–MS.
To simplify and shorten the sample preparation for in-field testing, the internal standard could be preloaded into the vials in the laboratory before being taken to the field. For applying the sample onto the CWF, the dipping mode is preferred because of ease of use; however, for low-concentration samples, a larger volume is required. Dropping an amount (~5 µL) of sample repetitively onto the CWF can be easily performed with a transfer pipette equipped with a tiny pipette tip.
References
- L. Pang and J.F. Liu, J. Chromatogr. A1230, 8–14 (2012).
- B. Alfeeli, D. Hogg, and M. Agah, Procedia Eng.5, 1152–1155 (2010).
- Y. Hu, Y. Yang, J. Huang, and G. Li, Anal. Chim. Acta543, 17–24 (2005).
- M. Azenha, P. Nogueira, and A. Fernando-Silva, Anal. Chim. Acta6(10), 205–210, (2008).
- J.M. Lorenzo, Meat Sci.96, 179–186 (2014).
- W.A.W. Ibrahima, H. Farhanib, M.M. Sanagia, and H.Y. Aboul-Enein, J. Chromatogr. A1217, 4890–4897 (2010).
- A. Harvey, J.C. Carter, J.R. Ertel, C.T. Alviso, S.C. Chinn, and R.S. Maxwell, J. Chromatogr. A1401, 1–8 (2015).
- L. Sanchez-Prado, S. Risticevic, J. Pawliszyn, and E. Psillakis, J. Photochem. Photobiol., A206, 227–230 (2009).
- J.E. Hong, H. Pyo, S.J. Park, and W. Lee, Anal. Chim. Acta539, 55–60 (2005).
- É.A. Souza-Silva, E. Gionfriddo, R. Shirey, L. Sidisky, and J. Pawliszyn, Anal. Chim. Acta920, 54–62 (2016).
- J.E. Hong, H. Pyo, S.J. Park, and W. Lee, Anal. Chim. Acta531, 249–256 (2005).
- W. Liao, M. Ghabour, W.M. Draper, and E. Chandrasena, Chemosphere158, 171–176 (2016).
- L. Han, Y. Sapozhnikova, and S.J. Lehotay, Anal. Chim. Acta827, 40–46 (2014).
- C. Fernández-Ramos, D. Šatínský, and P. Solich, Talanta129, 579–585 (2014).
- A. Prieto, O. Basauri, R. Rodil, A. Usobiaga, L.A. Fernández, N. Etxebarria, and O. Zuloaga, J. Chromatogr. A1217, 2642–2666 (2010).
- F. David and P. Sandra, J. Chromatogr. A1152, 54–69 (2007).
- M. Kawaguchi, R. Ito, H. Honda, N. Endo, N. Okanouchi, K. Saito, Y. Seto, and H. Nakazawa, J. Chromatogr. A1206, 196–199 (2008).
- M. Kawaguchi, R. Ito, N. Endo, N. Sakui, N. Okanouchi, K. Saito, N. Sato, T. Shiozaki, and H. Nakazawa, Anal. Chim. Acta557, 272–277 (2006).
- P. Poppa, C. Bauer, and L. Wennrich, Anal. Chim. Acta436, 1–9 (2001).
- N. Gilart, R. M. Marcé, F. Borrull, and N. Fontanals,TrAC, Trends Anal. Chem.54, 11–23 (2014).
- Q. Si, F. Li, C. Ga, C. Wang, Z,. Wang, and J. Zhao, Mar. Pollut. Bull.108, 163–170 (2016).
- M. Kawaguchi, R. Ito, H. Nakazawa, and A. Takatsu, TrAC, Trends Anal. Chem.45, 280–293 (2013).
- E. Pérez-Carrera, V.M.L. León, A.G. Parra, and E. González-Mazo, J. Chromatogr. A1170, 82–90 (2007).
- F. David, B. Tienpont, C. Devos, O. Lerch, and P. Sandra, J. Chromatogr. A1313, 147–156 (2013).
- T. Rejczak and T. Tuzimski, Open Chem.13, 980–1010 (2015).
- K. Pszczolinska and M. Michel, J. AOAC Int.99(6), 1403–1414 (2016).
- J. Ukpebor and E. Ukpebor, Nigerian Journal of Technology (NIJOTECH)35(3), 544–549 (2016).
- P.L. Cloutierb, F. Fortin, P.E. Groleau, P. Brousseau, M. Fournier, and M. Desrosiers, Talanta165, 332–338, (2017).
- M.C. Bruzzoniti, L. Checchini, R.M.D. Carlo, S.O.L. Rivoira, and M.D. Bubba, Anal. Bioanal. Chem.406, 4089–4116, (2014).
- T.V. Truong, A.N. Nackos, J.A. Murray, J.A. Kimball, J.E. Hawkes, D.J. Harvey, H.D. Tolley, R.A. Robison, C.H. Bartholomew, and M.L. Lee, J. Chromatogr. A1216, 6852–6857 (2009).
- B.A. Eckenrode, J. Am. Soc. Mass Spectrom.12, 683–693 (2001).
- T.V. Truong, C.S. Sadowski, N.L. Porter, A.D. Rands, B.E. Richter, T. Brande, D.W. Later, and M.L. Lee,Scientia Chromatographica6(1), 13–26, (2014).
- S.A. Lammert, A.A. Rockwood, M. Wang, M.L. Lee, E.D. Lee, S.E. Tolley, J.R. Oliphant, J.L. Jones, and R.W. Waite, J. Am. Soc. Mass Spectrom.17, 916–922 (2006).
- J.A. Contreras, J.A. Murray, S.E. Tolley, J.L. Oliphant, H.D. Tolley, S.A. Lammert, E.D. Lee, D.W. Later, and M.L. Lee,J. Am. Soc. Mass Spectrom.19, 1425–1434 (2008).
- New PerkinElmer product information, “The Benefit of Field-Portable GC-MS as a Rapid Screening Tool for Semi Volatile Organic Compounds in Water.”
- J. Pawliszyn, Handbook of Solid Phase Microextraction (Chemical Industry Press, Beijing, China, 2009).
- J. Pawliszyn, J. Chromatogr. Sci.38, 270–278 (2000).
Tai V. Truong, Nathan L. Porter, and Edgar D. Lee are with PerkinElmer in American Fork, Utah. Thy X. Truong and Milton L. Lee are with the Department of Chemistry and Biochemistry at Brigham Young University in Provo, Utah. Direct correspondence to: Tai.Truong@perkinelmer.com
Portable and Wearable Spectrometers in Our Future
December 3rd 2024The following is a summary of selected articles published recently in Spectroscopy on the subject of handheld, portable, and wearable spectrometers representing a variety of analytical techniques and applications. Here we take a closer look at the ever shrinking world of spectroscopy devices and how they are used. As spectrometers progress from bulky lab instruments to compact, portable, and even wearable devices, the future of spectroscopy is transforming dramatically. These advancements enable real-time, on-site analysis across diverse industries, from healthcare to environmental monitoring. This summary article explores cutting-edge developments in miniaturized spectrometers and their expanding range of practical applications.
Mass Spectrometry for Forensic Analysis: An Interview with Glen Jackson
November 27th 2024As part of “The Future of Forensic Analysis” content series, Spectroscopy sat down with Glen P. Jackson of West Virginia University to talk about the historical development of mass spectrometry in forensic analysis.
Revealing the Ancient Secrets of Chinese Swamp Cypress Using Cutting-Edge Pyrolysis Technology
November 18th 2024A study published in the Journal of Analytical and Applied Pyrolysis by Yuanwen Kuang and colleagues used advanced pyrolysis techniques to reveal the preservation and chemical transformations of 2,000-year-old Chinese swamp cypress wood, offering valuable insights for archaeological conservation and environmental reconstructions.
Detecting Cancer Biomarkers in Canines: An Interview with Landulfo Silveira Jr.
November 5th 2024Spectroscopy sat down with Landulfo Silveira Jr. of Universidade Anhembi Morumbi-UAM and Center for Innovation, Technology and Education-CITÉ (São Paulo, Brazil) to talk about his team’s latest research using Raman spectroscopy to detect biomarkers of cancer in canine sera.