Analyzing Water Samples Using EPA Method 200.8 to Support the Lead and Copper Rule Revisions
In 1991, the United States Environmental Protection Agency (EPA) published the Lead and Copper Rule (also known as LCR) with the aim to reduce exposure to lead and copper in drinking water. Two decades later, it promulgated the Lead and Copper Rule Revisions (LCRR) to provide communities with the tools for preventing lead exposure. This article details the use of current inductively coupled plasma–mass spectrometry (ICP–MS) instrumentation in accordance with EPA Method 200.8 and the new requirements of the LCRR.
Lead and copper are elements that can enter drinking water through plumbing systems and cause a wide range of health problems (1–5). The lead crisis in Flint, Michigan, introduced a public health crisis of life-long impact to the children and families affected; it also triggered greater concerns about overall water quality. In early 2021, two decades after the publication of the Lead and Copper Rule (LCR), the U.S. Environmental Protection Agency (EPA) promulgated the Lead and Copper Rule Revisions (LCRR), although the effective date for the new regulation is not yet established. The changes in LCRR focus on identifying areas most impacted by lead contamination, increasing sampling and analysis in facilities serving vulnerable populations (like schools and childcare facilities), and strengthening treatment requirements with the introduction of a new trigger level of 10 μg/L for lead, lower than the action level of 15 μg/L that will remain in the revised rule.
EPA Method 200.8
EPA Method 200.8 is one method approved to determine trace metals in water, including lead and copper by using the inductively coupled plasma–mass spectrometry (ICP–MS) technique (6–8). The EPA method was published more than 25 years ago. Since then, new features have been introduced in the design of ICP–MS instrumentation to simplify operation and improve performance. An example of new technology developed since EPA Method 200.8 was published is the implementation of collision cell technology. Because it was not available at the time of releasing EPA Method 200.8, collision cell technology is not currently permitted to remove polyatomic interferences. Alternatively, correction equations can be used to minimize the effect of this type of interferences. In addition, a correction equation is specifically required for determining lead in water. Various isotopes of lead are the final products of the radioactive decay of heavier elements (uranium, for example) and the ratio between lead isotopes is dependent on the source of origin (9,10). Hence, the sum of the signals for all lead isotopes is used for analyzing lead, according to EPA Method 200.8.
In this study, we demonstrate that elemental analysis of drinking water samples can be performed with current ICP–MS technology to meet all the EPA quality assurance (QA) criteria established in EPA Method 200.8, while supporting the LCRR with the newly proposed trigger level for lead (10 μg/L).
Materials and Methods
Reagents
Deionized (DI) water with resistivity higher than 18.2 MΩ∙cm and trace metal grade nitric acid (67–70%, w/w VWR Chemicals) were used as primary reagents for standards preparation. The EPA 200.8 package of multielement standards (Inorganic Ventures) was used to prepare calibration standards and internal standard solutions. All drinking water samples from different sources were acidified with nitric acid to a concentration of 2% v/v.
Instrumentation
An ICP–MS Model 2030 equipped with a AS-10 Autosampler (Shimadzu Scientific Instruments) was used for all analyses. Inline addition of internal standards to calibration and unknown samples was accomplished using a Glass Expansion inline internal standard addition kit. Operational parameters of the ICP–MS are listed in Table I.

Instrument Tuning and Calibration
The instrument was tuned to optimize system parameters prior to analysis using an ICP–MS tuning solution to ensure correct torch position, lens voltages, and mass resolution. Following tuning, the status of the instrument was evaluated using the EPA Method 200.8 tuning solution. The mass resolution at low and high masses was evaluated by measuring magnesium isotopes (24Mg, 25Mg, and 26Mg), and lead isotopes (206Pb, 207Pb, and 208Pb) respectively to ensure an acceptable resolution (approximately 0.75 amu) could be achieved. The stability of the instrument was also evaluated by measuring five replicates of the tuning solution; relative standard deviation (RSD) of recorded signals for beryllium, cobalt, indium, magnesium, and lead below 5% demonstrated acceptable stability.
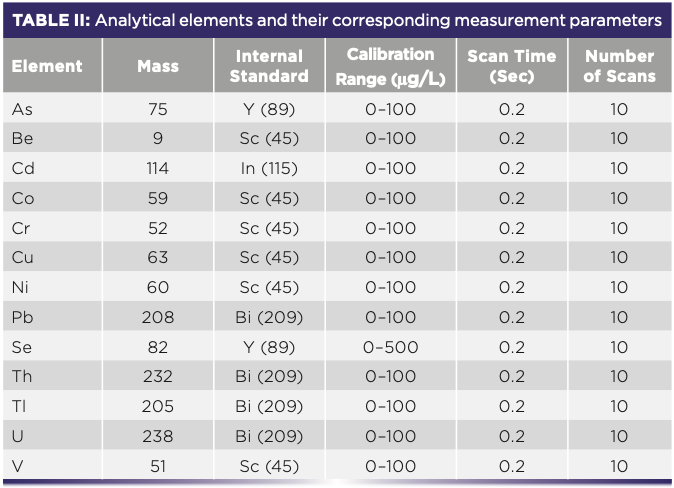
After successful tuning and performance evaluation, the instrument was calibrated for the elements of interest (included in Table II). Appropriate calibration standards were selected for each analyte to cover the required analysis range; the specific concentrations for each analyte are shown in Table II. An internal standard solution containing yttrium, scandium, indium, and bismuth was added to all samples using an inline internal standard addition kit, with dilution factor of 1:10. The final concentration of the internal standards was 50 μg/L.

Although modern ICP–MS instruments, including the one used in this study, are equipped with a collision cell to effectively remove polyatomic interferences, the collision cell technology is not currently accepted by EPA Method 200.8. Therefore, correction equations were used as an alternative method to compensate for potential interferences. In the case of lead measurement, the sum of the signals from all three lead isotopes (206Pb, 207Pb, and 208Pb) are measured by applying appropriate correction equation to negate naturally occurring variations in the isotopic ratios between calibration standards and samples. All correction equations used in this study are shown in Table III.

Results and Discussions
Initial Demonstration of Performance
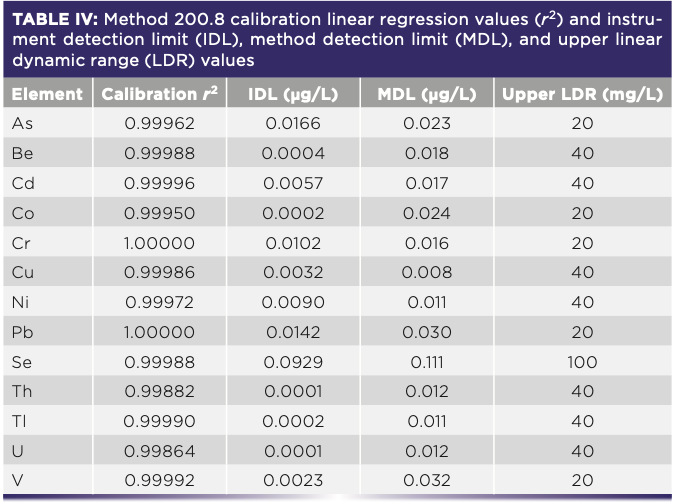
Calibration of the instrument for quantification of lead and other analytes of interest was performed by the creation of calibration curves using external standards. EPA Method 200.8 does not include specific quality assurance criteria for determining the suitability of the calibration curve. However, for this work, calibration curves were accepted when linear regression values (r2) of ≥0.995 were achieved. As shown in Table IV, all calibration curves show excellent linearity across the respective calibration range with r2 values higher than 0.998.

The linear dynamic range (LDR), instrument detection limits (IDL), and method detection limits (MDL) were established to validate instrument performance according to EPA QA criteria included in EPA Method 200.8 before the samples were analyzed. The LDR is determined by analyzing a series of samples at concentrations higher than calibration range to determine at which concentrations they fall out of ±10% of their expected concentration. LDR results are listed in Table IV. The values for lead and copper are 20 and 40 mg/L, respectively.
The IDLs are calculated as three times the standard deviation of 10 replicate measurements of a calibration blank. According to EPA Method 200.8, MDL is defined as the minimum concentration of an analyte that can be measured and reported with 99% confidence level. The MDLs are calculated by the equation 1 below:
MDL = t × S [1]
where t is the t-distribution value for a confidence level of 99% that is 3.14 for a sample size of 7 and S is the standard deviation of 7 replicate analyses. Each analyte was spiked into 2% nitric acid solution at a concentration from two to five times the IDL.
For calculating the IDLs and MDLs, each replicate was measured as an unknown or calibration sample; three measurements were carried out for each replicate. IDL and MDL for all analytes are shown in Table IV. IDL and MDL for lead are 0.014 μg/L and 0.03 μg/L, respectively. For copper, the IDL is 0.003 μg/L and the MDL is 0.008 μg/L. IDL provides an estimation of the sensitivity of an instrument based on its condition at the time of acquiring the data; results are heavily impacted by numerous factors, such as instrument age, maintenance record, and system cleanliness. For the practical purpose of reporting data in support of the requirements of LCRR, MDL is a more relevant parameter than IDL, because impact of sample matrix is considered in the calculation. The LCRR introduces a new trigger value for lead of 10 μg/L. Water utilities will have to modify water treatment if lead exceeds the trigger level. Therefore, laboratories will have to provide reliable results of lead concentrations several orders of magnitude lower than 10 μg/L for utilities to be able to plan and respond to the level of lead in drinking water. As seen in Table IV, the MDL calculated for lead in this work easily meets this requirement.
Samples Analysis and Post-Analysis Validation
Table V shows concentrations of elements in the original samples and spiked samples for a blank and three different water samples. The spike and recovery method are used to validate the results and en- sure reliable instrument performance. The spiked concentration was 100 μg/L for selenium and 20 μg/L for all other analytes. The recovery is calculated by the following equation 2:

where C and Cs are concentration of sample and fortified (spiked) samples respectively, and s is the concentration equivalent of added analyte to the fortify sample.
The spike and recovery tests for all analytes fell within the acceptable range of 90–110% of the spiked values. All relative standard deviations (RSD) were also below 5%, further demonstrating the validity of the methodology and the high level of precision for the routine analysis of lead and other metals in water samples.
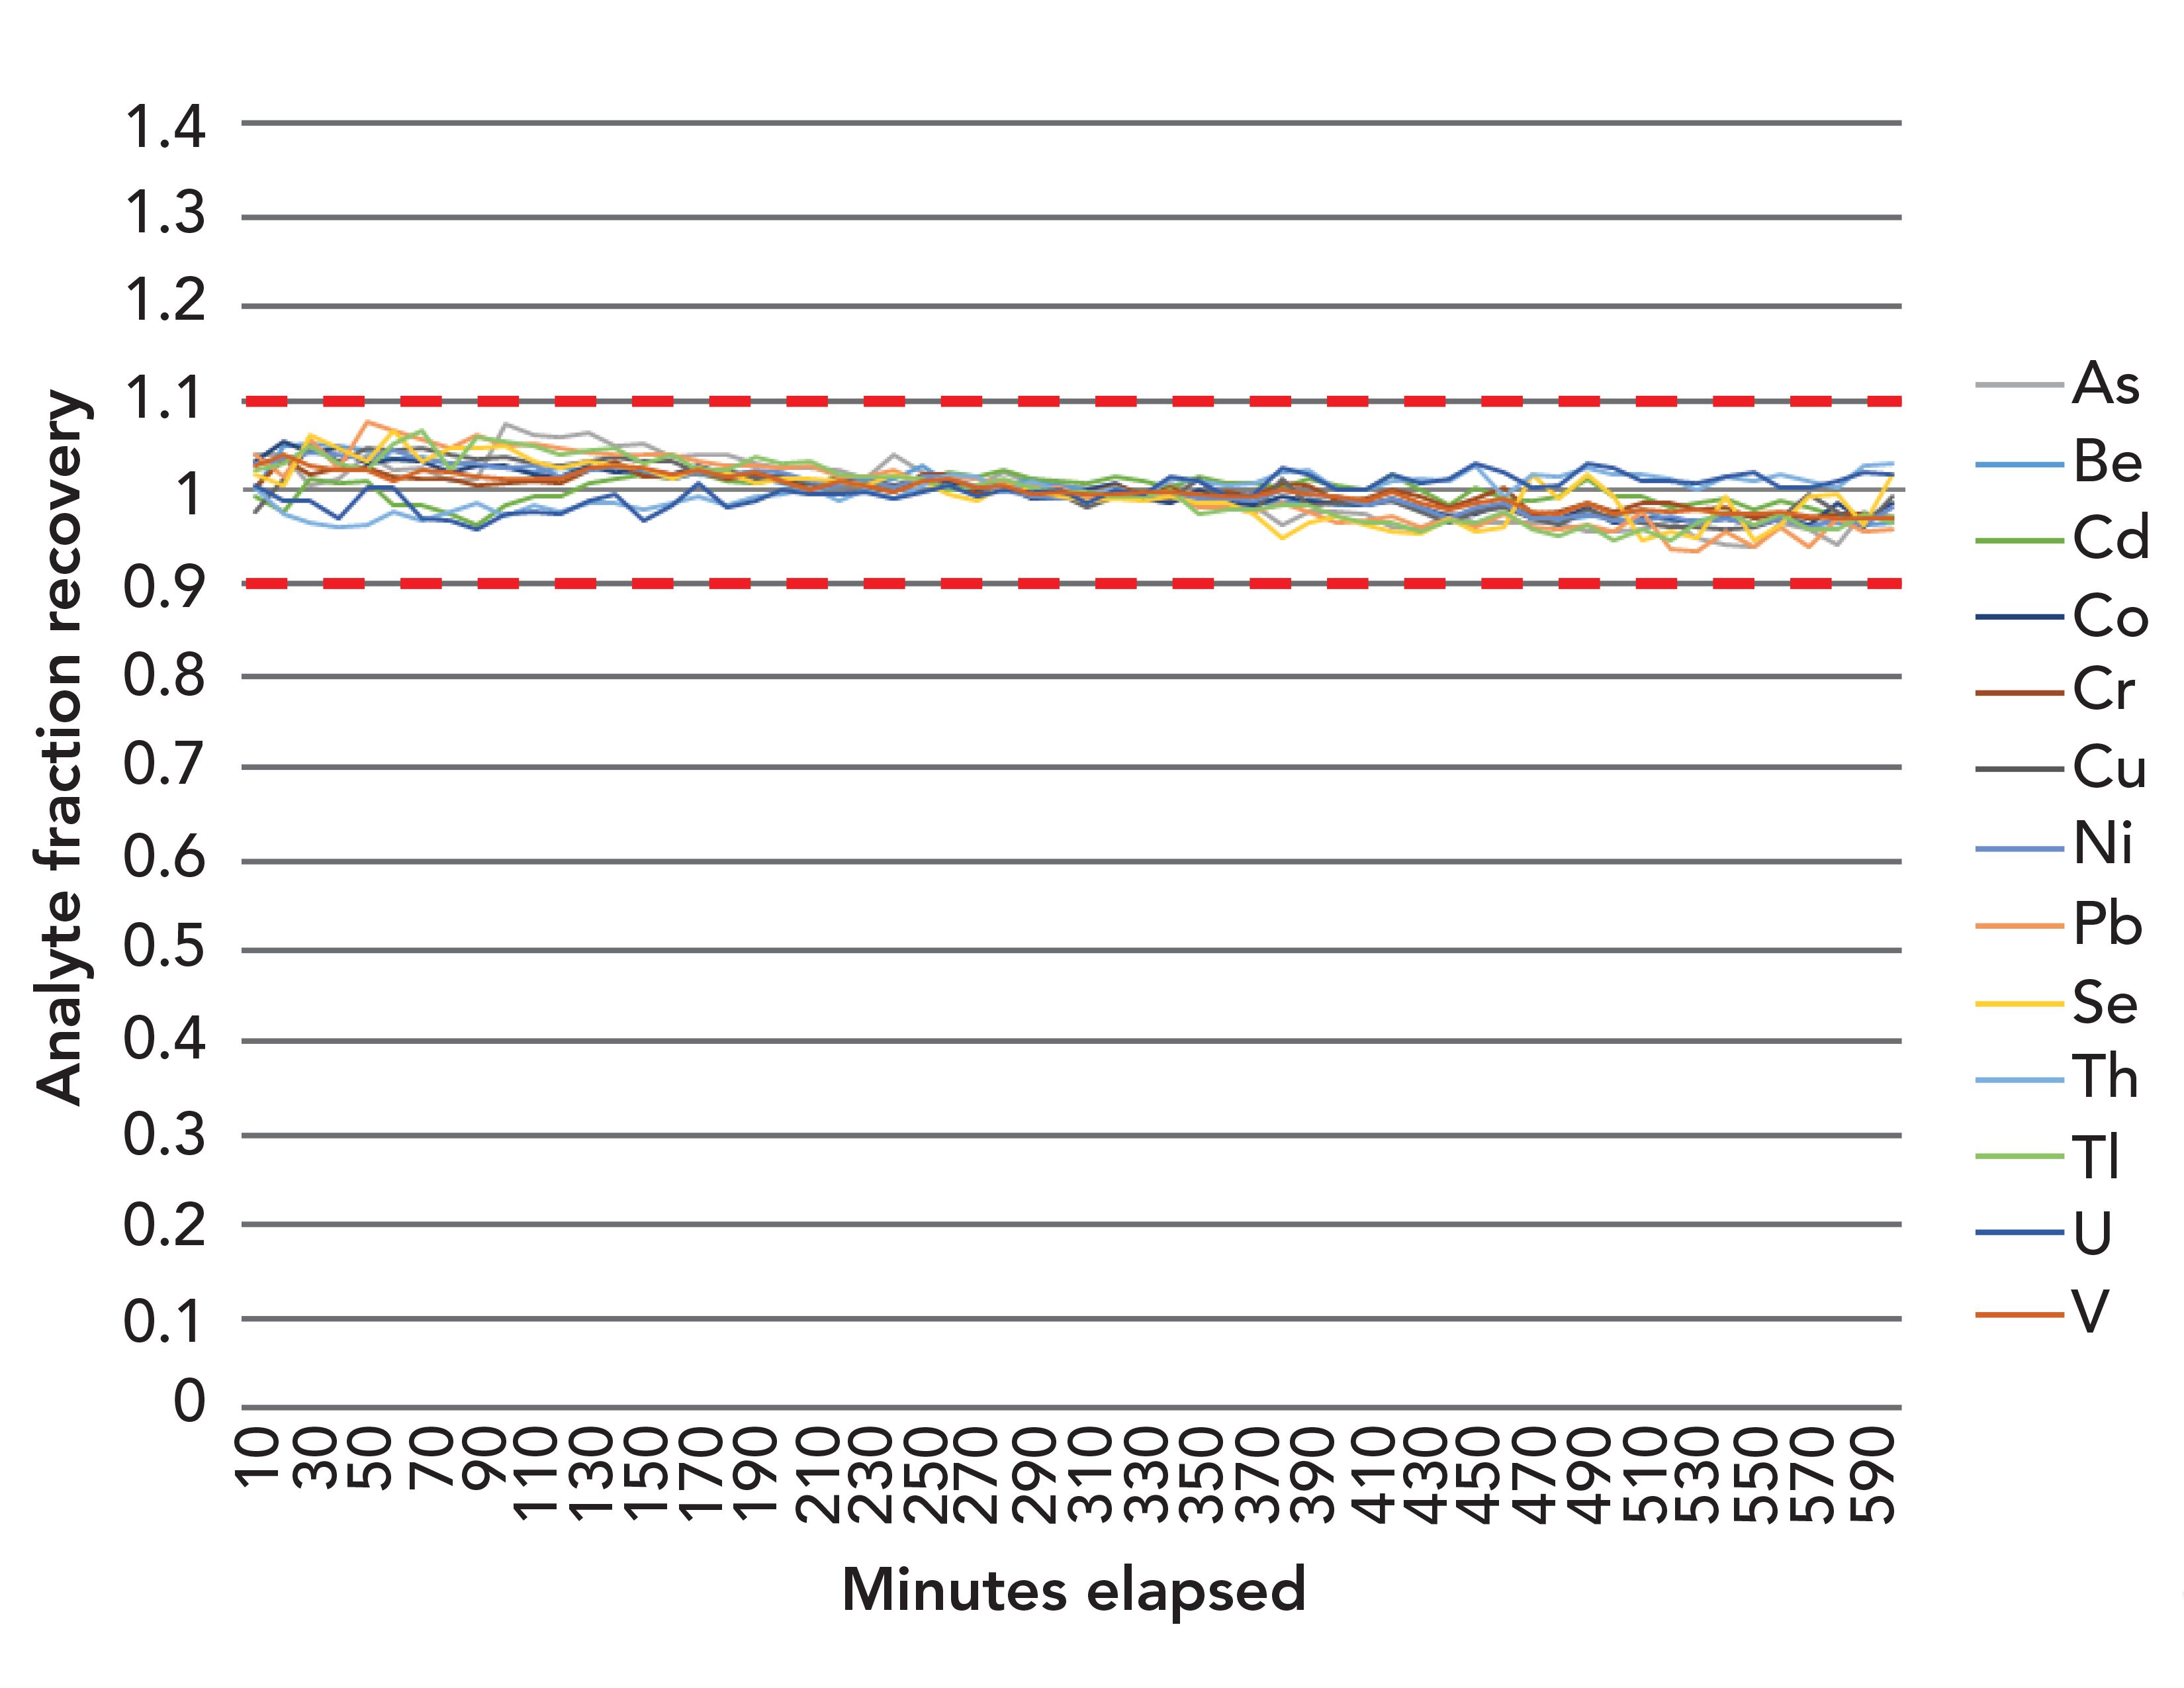
The stability of the instrument was evaluated by analyzing a series of known samples repeatedly for 10 h to demonstrate deviation of signal intensities. A total of 120 samples were analyzed during this period of time. Stable operation of an ICP–MS instrument is critical once the LCRR is implemented because additional monitoring of schools, childcare facilities, and other sectors, will be required. As shown in Figure 1, the recoveries for all analytes are extremely stable and within ±10% recovery threshold over a 10-h period, demonstrating the capability of the instrument to provide precise results over typical operational times in environmental laboratories.
FIGURE 1: Recovery of analytes over a 10-hour period. The dashed lines represent 100 ±10% recovery.

Conclusions
Drinking water samples were successfully analyzed by ICP–MS according to current technology. The detection limit (IDL and MDL) were calculated for all analytes and three water samples were analyzed to demonstrate method performance. The spiked-recovery tests showed all values were in the acceptable range of 90–110% with all RSDs below 5%. The MDL for lead was >300 times lower than the newly introduced trigger level of 10 μg/L; this provides laboratories and water utilities a large concentration range for anticipating and responding to high levels of lead in drink- ing water. Stable responses were also obtained for all analytes over a 10-h period, demonstrating the stability of instrument over a typical operation conditions in environmental laboratories. Consequently, laboratories will be able to accommodate increasing sample loads without additional downtime for instrument maintenance.
The sensitivity, precision, durability, and accuracy obtained for determining lead in drinking water according to EPA Method 200.8 validates the suitability of the current ICP–MS instrumentation used in this study to successfully support the new demands and challenges the implementation of LCRR will pose to water utilities and the laboratories working with them.
References
(1) A. Kumar, A. Kumar, C.-P. M.M.S., A.K. Chaturvedi, A.A. Shabnam, G. Subrahmanyam, R. Mondal, D.K. Gupta, S.K. Malyan, S.S. Kumar, S. A. Khan, and K.K. Yadav, Int. J. Environ. Res. Public Health 17, 2179 (2020).
(2) R.A. Goyer, Environmental Health Perspectives 100, 177–187 (1993).
(3) A.L. Wani, A. Ara, and J.A. Usmani, Interdiscip Toxicol. 8(2), 55–64 (2015).
(4) N.C. Papanikolaou, E.G. Hatzidaki, S. Belivanis, G.N. Tzanakakis, and A.M. Tsatsakis, Med. Sci. Monit. 11(10), 329–336 (2005).
(5) H. Gurer-Orhan, H.U. Sabır, and H. Özgüneş, Toxicology 195(2–3), 147–154 (2004).
(6) EPA Method 200.8: Determination of Trace Elements in Waters and Wastes by Inductively Coupled Plasma Mass Spectrometry, Revision 5.4 (1994)
(7) “Analysis of Trace Elements in Water by EPA Method 200.8 using the Shimadzu ICPMS- 2030,” Shimadzu Application News, No. ICP-005.
(8) “Analysis of River Water by ICPMS-2030”, Shimadzu Application News, No. J118.
(9) E. Schnyder, M. Štrok, Z. Kosonen, M. Skudnik, D. Mazej, Z. Jeran, and L. Thöni, Ecol. Indic. 95(1), 250–259 (2018).
(10) A. Bollhöfer and K.J.R. Rosman, Geochim. Cosmochim. Acta. 65(11), 1727–1740 (2001).
ABOUT THE AUTHORS
Hamed Ataee-Esfahani is a Product Specialist–Elemental Spectroscopy, at Shimadzu Scientific Instruments, in Columbia, Maryland. Andrew Fornadel is the Market Manager- Energy & Chemicals at Shimadzu Scientific Instruments, in Columbia, Maryland. Jonathan Peters is the Product Manager–Elemental Spectroscopy at Shimadzu Scientific Instruments, in Columbia, Maryland. Ruth Marfil-Vega is the Senior Market Manager–Environmental at Shimadzu Scientific Instruments, in Columbia, Maryland. Direct correspondence to: rmmarfilvega@shimadzu.com.

ABOUT THE COLUMN EDITOR
Robert Thomas is the principal of Scientific Solutions, an educational consulting company that serves the training and writing needs of the trace element user community. He has worked in the field of atomic and mass spectroscopy for more than 45 years. ●


High-Speed Laser MS for Precise, Prep-Free Environmental Particle Tracking
April 21st 2025Scientists at Oak Ridge National Laboratory have demonstrated that a fast, laser-based mass spectrometry method—LA-ICP-TOF-MS—can accurately detect and identify airborne environmental particles, including toxic metal particles like ruthenium, without the need for complex sample preparation. The work offers a breakthrough in rapid, high-resolution analysis of environmental pollutants.
Atomic Perspectives: Highlights from Recent Columns
March 3rd 2025“Atomic Perspectives,” provides tutorials and updates on new analytical atomic spectroscopy techniques in a broad range of applications, including environmental analysis, food and beverage analysis, and space exploration, to name a few. Here, we present a compilation of some of the most popular columns.