Assessing Accuracy
In a previous article, we discussed the steps in the chemical analysis process (sample taking, sample preparation, analysis, and results) and promised a follow-up on the question of the accuracy of the results. This article examines systematic error and quantitative analysis.
Accuracy is defined by IUPAC (International Union of Pure and Applied Chemistry) (1) as "The closeness of agreement between a test result and the true value. Accuracy, which is a qualitative concept, involves a combination of random error components and a common systematic error or bias component."
In a previous article (2), we discussed the random error component, generally referred to as the precision and quantified by the standard deviation. We also noted the three generally agreed upon accuracy classifications in chemical analysis: qualitative, semiquantitative, and quantitative. In this article, we will address the systematic error or bias and focus on quantitative analysis in which an attempt is made to discover exactly how much of an element is present.
In practical terms, accuracy is all about getting the "right" number. But just what is the right number? The question of accuracy is perhaps the most difficult of all in spectrochemical analysis, but accuracy is defined commonly as the agreement between the measured value and the true value. That is, accuracy is a measure of a deviation between what is measured and what should have been, or what is expected to be, found. This is often referred to as "bias." If the agreement between the two values is good, then an accurate determination has been made.
The ambiguity in the concepts of "true value," "good agreement," and "exact amount present" make the discussion of accuracy difficult at best. In the next several sections, we examine factors affecting the accuracy of an analysis and ways in which the accuracy can be evaluated.
Certified Reference Materials
What is the "true value" of an analyte in a sample? IUPAC defines true value as "The value that characterizes a quantity perfectly defined in the conditions that exist when that quantity is considered. It is an ideal value which could be arrived at only if all causes of measurement error were eliminated, and the entire population was sampled." Clearly, entire samples cannot be analyzed, and no spectrochemical method is without error.
The only way we have to assess true value is with reference to certified reference materials, often referred to as standards. Let us begin by examining the certificates of analysis of several commercially available standards.
Table I shows some certified values along with their uncertainties for the National Institute of Standards and Technology (NIST) Standard Reference Material 2710, "Montana Soil, Highly Elevated Trace Metal Concentrations." The mean values are the average of two or more independent analytical methods. The uncertainties listed are the 95% prediction intervals, that is, where the true concentrations of 95% of the samples of this SRM are to be expected.
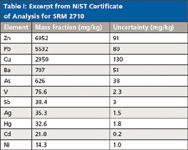
Table I: Excerpt from NIST Certificate of Analysis for SRM 2710
Table II shows some certified values from the British Bureau of Analysed Samples for the reference material No. 351, a nickel-base superalloy known as Inconel 718. Here we see the individual results from the collaborating laboratories together with the mean and standard deviation of their results.
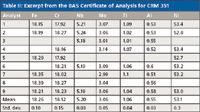
Table II: Excerpt from the BAS Certificate of Analysis for CRM 351
Table III shows some certified values of Brammer Standards reference material BS 715A, a cupro-nickel alloy. This table again shows the mean and standard deviation of the results from several collaborating laboratories. Note that the values for lead (Pb) and aluminum (Al) are in brackets, indicating noncertified values, due to the large deviations of the individual reported determinations.

Table III: Excerpt from Certificate of Analysis for BS 715A
Table IV shows some recommended values for an andesite standard (AGV-1) from the United States Geological Survey (USGS, Reston, Virginia). This table shows the mean and standard deviation of elements and oxides. It should be noted that iron (Fe) is reported in three ways, as iron oxide (FeO) and iron trioxide (Fe2O3), as well as total iron (reported as Fe2O3 T).
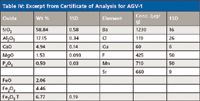
Table IV: Excerpt from Certificate of Analysis for AGV-1
This is because iron can be present in many different forms in natural samples, and in this particular sample, primarily as these two common oxides. If you calculate the total iron in FeO (2.06% FeO = 1.60% Fe) and in Fe2O3 (4.46% Fe2O3 = 3.12% Fe), we find 4.72% Fe, which is equivalent to 6.75% Fe2O3, in substantial agreement with the reported value of 6.77% Fe2O3. This reporting of an element as different oxides comes from early wet chemistry methods where specific forms of materials were dissolved and analyzed.
Uncertainties in Certified Values
We can see from the few examples presented earlier that the standards used for calibration and accuracy verification do themselves contain uncertainties. The values certified are the averages of the analyses of many corroborating laboratories, typically using different analytical techniques. Therefore, the certified values themselves have a standard deviation, and we might expect the "true value" to lie within about ±3σ of the mean. However, the range of the individual determinations as shown in Tables II and III is perhaps more enlightening than the standard deviations. Furthermore, note that the elements at the trace level (= 0.1%) in Table III show significant deviations.
It is important to remember that the certified values of the standards are themselves the results of measurements. Additional information on the accuracy (and precision) of the classical "wet chemical" methods used to certify standard reference materials can be found in reference (3).
Values listed in certificates can change over time, and this can be for various reasons. Some certificates are issued with "provisional" values because of an urgent need to get the materials into the user's hands. Later, when more analyses have been completed, a "final" certificate of analysis will be issued, and the values can differ slightly from the provisional document. Occasionally, additional work is performed, or more accurate techniques are employed, that will give a different value or will modify the associated standard deviation. Some materials or elements are not stable and might change over time (for example, Hg in soil samples). Standard certificates can have expiration dates associated with them because of unstable components.
Considering the earler discussion, it might be best to consider these certified values as "accepted values" rather than necessarily "true values." And the "accepted values" should include some estimate of the associated uncertainty!
Quantifying Accuracy
The simplest way of expressing bias between measured and certified values is to compute a straightforward weight percent deviation. That is,
Deviation = %Measured – %Certified.............................[1]
Example: Consider the certified nickel concentration of standard BS 715A as noted in Table III (Ni = 30.22%). Let an instrumentally measured concentration be Ni = 30.65%. What is the instrumental bias?
Deviation (Weight Percent) = 30.65% – 30.22% = 0.43%
The more common way of expressing this bias between measured and certified analyte concentration is to compute a relative percent difference (RPD). This is commonly expressed as
Relative % Difference = (Deviation/Certified) × 100..........[2]
This has the advantage of referencing the weight percent difference to the mean concentration level of the analyte (as expressed by the certified value). For the example given previously, this % difference is
% Difference = [(30.65% – 30.22%)/ (30.22%)] × 100 = 1.42%
Analytical chemists are fond of the term "percent recovery," which is quite similar.
% Recovery = (Measured/Certified) × 100......................[3]
In the example given earlier, this would be 101.42%.
Acceptable Bias
The obvious question is: "What is an acceptable bias?" The first response must be another question: "What are the objectives of the analysis?" (These would be the Data Quality Objectives, in EPA terminology.) If we are only interested in qualitative or semiquantitative analysis, then the question is moot. However, in this article, we are talking about quantitative analysis as noted in the introduction.
Table V presents some guidelines, suggested by practical experience, for acceptable deviations from certified values, or bias in the analytical result.

Table V: Guidelines for acceptable accuracy
Another way to determine acceptable bias is the old fashioned "measure and record." If one or more QC standards are analyzed every day, this data can be plotted and the analyst can gain some insight into what to expect from a particular method and instrument. This can be done through statistical process control (SPC) charts or simply by plotting in an Excel graph. Either way, it will rapidly become apparent what to expect and if the instrument has a functional problem.
Statistical techniques can be applicable to some questions related to accuracy (4). However, it is important to differentiate (again) between the random bias (precision) and systematic bias (accuracy). We would question whether any statistical technique can answer the following question: "My standard with certified concentration of Cr = 10.2% reads 10.7% on my spectrometer. Is this result accurate?" Both the empirical guidelines suggested previously and the control chart method will provide an answer.
Correlation Curves
Perhaps the best way of assessing the accuracy of an analytical method is to produce correlation curves for the various elements of interest. Such a curve plots the certified or nominal values along the x-axis versus the measured values along the y-axis. This plot provides a visual comparison of the measured versus certified values and the accuracy of the analytical technique usually is immediately apparent. Examples of correlation curves are shown in Figures 1 and 2 for the elements chromium and molybdenum determined by X-ray fluorescence (XRF) in various stainless steels and nickel and cobalt-based superalloys.
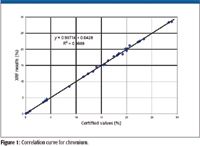
Figure 1
To quantify the accuracy as expressed in the correlation curve, there are two criteria (5,6):
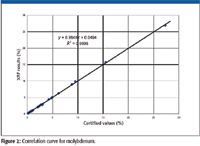
Figure 2
- A correlation coefficient (R2) must be calculated. A value of 1.0 indicates perfect agreement and 0 shows no agreement. Good agreement or accuracy, in our case, is ensured with a correlation coefficient greater than about 0.9. Excellent accuracy would give correlation coefficients of 0.98 or higher.
- The slope of the regression line calculated through the data must approximate 1.0 and the y-intercept 0. Deviations from this 45° straight line through the origin would indicate bias in the analytical method under investigation. Clearly, the examples of Figures 1 and 2 fulfill both of these requirements.
Two additional comments should be made:
- The range of the data will have an effect on the linear regression analysis and the associated computations for slope, intercept, and correlation coefficient.
- Even for a correlation curve of nonunity slope, at some point there will be a correspondence between the certified and measured values.
Conclusion
Perhaps the biggest problem encountered by novice, and sometimes, even experienced users of spectrometric instrumentation is evaluating the accuracy of the analysis. As an example, consider Table II. A user might lament, "My standard (control sample) is reading 17.93% chromium and the certificate of analysis says 18.12%. What's wrong with my spectrometer?!" The answer is absolutely nothing. Check the range of chromium values used to certify the standard.
References
(1) IUPAC Compendium of Analytical Nomenclature (The Orange Book) Chap 2.2 http://old.iupac.org/publications/analytical_compendium/
(2) D. Schatzlein and V. Thomsen, Spectroscopy 23(10), 10 (2008).
(3) K. Slickers, Automatic Emission Spectroscopy, Second Edition (Bruehlische Univ. Press,1993).
(4) H. Mark and J. Workman, Statistics in Spectroscopy (Academic Press, Boston, 1991).
(5) K. Doerffel, Fresenius' Journal of Analytical Chemistry 348(3), 183–187 (1994).
(6) V. Thomsen, Modern Spectrochemical Analysis of Metals: An Introduction for Users of Arc/Spark Instrumentation (ASM International, Materials Park, Ohio, 1996).
Appendix: Notes on the Use of Certified Reference Materials
It also should be noted that certificates of analysis often are quite specific in how they should be used. Thus, a common trap into which analysts can fall is using standards in an inappropriate manner. Consider, for example, NIST 2710 (Table I):
- The certificate states that a minimum sample weight of 250 mg of dried sample is to be used to relate to the certificate.
- It also is pointed out that sample preparation procedures for complete dissolution must be used to obtain the certified values. However, many laboratories (for reasons of speed, health and safety, or ease) use less hazardous acids that give incomplete digestion, and then complain when the element of interest reads low. It is not the fault of the standard, or the instrument used; that residue sitting in the bottom of the sample container probably contains at least some of your analyte. NIST now provides leach data and recovery information, and some of these data are shown in Table VI.

Table VI: Excerpt from Certificate of Analysis for NIST 2710
Some analysts have been known to further compound the issue by assuming that the % recovery is constant and then using a multiplicative adjustment to get the "right" number. This is wholly unacceptable for a number of reasons, but we will consider two of the main ones. Firstly, the process of dissolving a solid into a liquid is governed by a number of factors, including, but not limited to temperature, pressure, surface area, and the chemical and physical nature of solvent and sample. Any changes to any of these factors can have an effect on how much of the element dissolves. This is clearly demonstrated when looking at the range of values obtained (rather than the median of % recovery calculated from the median). For example, the Al range of 1.2–2.6% Al is actually a recovery rate of between 18.6 and 40.4%. This shows a huge disparity between recovery rates and should indicate that using a multiplicative fix is inappropriate. The second point is that the chemical nature of the element will vary from sample to sample, and this will have a profound effect on the rate of dissolution, so recovery for Cu, for example, can be 98% in one sample but only 58% in another sample, depending upon the way the Cu is bound up in the sample.
Acknowledgments
Thanks are due to D. Schatzlein for helpful comments on early drafts and for the material in the appendix. I am also grateful to several valuable suggestions made by an anonymous reviewer.
Volker Thomsen is a consultant in spectrochemical analysis and lives in Atibaia, SP, Brazil. He can be reached at vbet1951@uol.com.br.

Smarter Sensors, Cleaner Earth Using AI and IoT for Pollution Monitoring
April 22nd 2025A global research team has detailed how smart sensors, artificial intelligence (AI), machine learning, and Internet of Things (IoT) technologies are transforming the detection and management of environmental pollutants. Their comprehensive review highlights how spectroscopy and sensor networks are now key tools in real-time pollution tracking.