The Carbonyl Group, Part V: Carboxylates—Coming Clean
Spectroscopy
Carboxylates are made by reacting carboxylic acids with strong bases such as inorganic hydroxides. Carboxylates contain two unique carbon–oxygen “bond and half” linkages that coordinate with a metal ion to give two strong infrared peaks, which make them easy to see.
Carboxylates are made by reacting carboxylic acids with strong bases such as inorganic hydroxides. The resultant salts are commonly used as cleansers, including in common bar soap-hence the pun in the title. Carboxylates contain two unique carbon–oxygen "bond and half" linkages that coordinate with a metal ion to give two strong infrared peaks, which make them easy to see.
So far in our investigation of the infrared spectroscopy of the carbonyl functional group, we have looked at ketones, aldehydes, carboxylic acids, and acid anhydrides (1–4). Acid anhydrides are derivatives of carboxylic acids and are made by reacting two acid molecules and splitting off an atom of water (4). Carboxylates are another derivative of carboxylic acids, and they are made via a classic acid–base reaction of a carboxylic acid with a strong base such as a hydroxide. Such a reaction is shown in Figure 1.
As in the synthesis of acid anhydrides, one of the driving forces for the reaction is the splitting-off of a molecule of water. Note in Figure 1 that the carboxylate functional group contains ionic bonding; there is a formal positive charge on the metal ion and a negative charge on the carboxylate. Also shown in Figure 1 is that the metal ion from the hydroxide coordinates with the two oxygens from the carboxylic acid to form an unusual bonding arrangement with two equivalent carbon–oxygen bonds. We will call this the "-CO2–" group because it contains two carbon–oxygen bonds of the same bond order, similar to carbon dioxide (O=C=O).

Figure 1: The reaction of a carboxylic acid with sodium hydroxide to give a carboxylate and water.
Carboxylates are named after the acid and base used to make them. Thus, the reaction of acetic acid and sodium hydroxide would yield sodium acetate. A classic acid–base reaction, such as between NaOH and HCl, forms a salt and water. Carboxylates are sometimes referred to as carboxylic acid salts because a carboxylate is a salt formed by the reaction of a carboxylic acid with a base.
Carboxylates are unusual in that they frequently have a polar end consisting of the carboxylate, and a nonpolar end such as an alkyl chain. This structure makes them uniquely capable of solubilizing oil and dirt into water, which is why they are commonly used as cleaning agents (explaining the bad pun in the title of this column). In fact, sodium stearate, the product of the reaction of sodium hydroxide and stearic acid, is also known as hand soap.
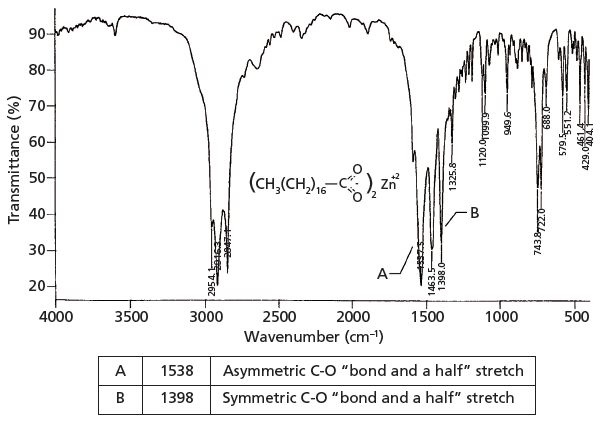
The infrared spectrum of a carboxylate, zinc stearate, is shown in Figure 2. This molecule is made by reacting two equivalents of stearic acid with the dibasic zinc hydroxide, yielding a molecule with two carboxylate moieties.

Figure 2: The infrared spectrum of zinc stearate (C36H70O4Zn).
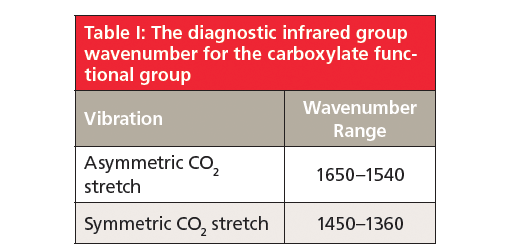
Because carboxylates contain neither a C=O bond nor a C-O bond, they will not contain a carbonyl stretching peak around 1700 cm-1 (1) (going forward assume all peak positions are in wavenumber units), or a C-O stretch between 1300 and 1000 (5). There are two intense peaks at 1538 and 1398 in Figure 2 that stick down out of the spectrum like canine teeth. These are from the asymmetric and symmetric stretches of the -CO2– group. Generally, these two peaks fall from 1650 to 1540 and 1450 to 1360, respectively. Unlike the C=O group, carboxylate stretches are insensitive as to whether saturated or unsaturated carbons are attached to them.
The carbon–oxygen bond order in the -CO2– group is about one and half, and the infrared spectrum shown in Figure 2 will help prove this. A C=O stretch falls at about 1700 (1), and a C-O stretch typically falls at about 1200 (5). Theoretically then a C-O "bond and a half stretch" might fall at the average peak position of these two carbon–oxygen stretching vibrations. The average of 1700 and 1200 is 1450, close to where the carboxylate stretching peaks fall. This close agreement indicates that the carbon–oxygen bond order in carboxylates is approximately 1.5.
Because carboxylates contain positive and negative charges, they are highly polar and have a large dipole moment. Recall from the first installment of this column that one of the characteristics that determine infrared peak positions is the change in dipole moment with respect to bond distance during a vibration, or dµ/dx (6). When the bonds of the -CO2– group stretch asymmetrically and symmetrically there is a large value of dµ/dx. This attribute is why the pair of carboxylate stretching peaks are so intense.
In theory, one could identify the metal ion in a carboxylate from its mid-infrared spectrum. Recall, however, that as the mass of the atoms in a functional group goes up peak position goes down (7). Most metal atoms are heavier than the hydrogen, carbon, and oxygen atoms typically found in organic molecules. Thus, the metal–oxygen stretching and bending peaks that might help us determine the metal ion in a carboxylate fall below 400, out of range of most mid-infrared Fourier transform-infrared (FT-IR) spectrometers. Now, carboxylates with different metal atoms will have different infrared spectra because they have different chemical structures (7), but the inability of most FT-IRs to see metal–oxygen peaks makes it difficult to determine the metal ion from the infrared spectrum by itself. In this case, consultation of reference spectra, a library search, or a metals analysis of the sample using some form of atomic spectroscopy will be needed.

In the chemical structure of zinc stearate shown in Figure 2 you can see that there are two very long alkyl chains, together whose CH2/CH3 ratio is 16. Recall that the relative intensity of the methylene asymmetric stretch compared to the methyl symmetric stretch is proportional to the CH2/CH3 ratio for a molecule (7). As can be seen in Figure 2, the CH2 asymmetric stretching peak at 2916 is significantly larger than the CH3 asymmetric stretching peak at 2959, as expected.
Also note in Figure 2 that from 1400 down to 400 there are a number of weak to medium intensity peaks. These peaks include C-C stretching bands (8). Under normal circumstances these vibrations would have small values of dµ/dx, giving difficult to see peaks. Because of the highly polar nature of the carboxylate group, however, the alkyl chain itself is somewhat polarized, which increases dµ/dx for its vibrations and yields the plethora of peaks seen. The diagnostic group wavenumbers for carboxylates are listed in Table I.

Conclusions
Carboxylates are made by reacting a carboxylic acid with a strong base such as a hydroxide. The structure of the resultant functional group contains a negatively charged -CO2– group and a positively charged metal atom, and hence is highly polar. As a result, carboxylates have a large dipole moment and give two intense peaks, assigned as the asymmetric and symmetric -CO2– stretches at 1650–1540 and 1450–1360, respectively. The positions of these two peaks indicate that the bond order of -CO2– group is about 1.5.
References
(1) B.C. Smith, Spectroscopy 32(9), 31–36 (2017).
(2) B.C. Smith, Spectroscopy 32(10), 28–34 (2017).
(3) B.C. Smith, Spectroscopy 33(1), 14–20 (2018).
(4) B.C. Smith, Spectroscopy 33(2), 16–20 (2018).
(5) B.C. Smith, Spectroscopy 32(1), 14–21 (2017).
(6) B.C. Smith, Spectroscopy 30(1), 16–23 (2015).
(7) B.C. Smith, Spectroscopy 30(10), 17–22 (2015).
(8) B.C. Smith, Infrared Spectral Interpretation: A Systematic Approach (CRC Press, Boca Raton, Florida, 1999).
(9) R. Morrison and R. Boyd, Organic Chemistry, 8th Edition (Prentice Hall, New York, 1992).
Quiz Section Online
All of our "IR Spectral Interpretation" quizzes are available online. If you are interested in testing your skills and taking additional "IR Spectral Intepretation" quizzes, please visit www.spectroscopyonline.com/ir-spectral-interpretation-workshop-0.
Brian C. Smith, PhD

Brian C. Smith, PhD, has more than three decades of experience as an infrared spectroscopist. He has published numerous peer reviewed papers and has written three books on the subject: Fundamentals of FTIR and Infrared Spectral Interpretation, both published by CRC Press, and Quantitative Spectroscopy: Theory and Practice published by Elsevier. As a spectroscopic trainer, he has helped thousands of people around the world improve their infrared analyses. He earned his PhD in physical chemistry from Dartmouth College. He can be reached at: SpectroscopyEdit@UBM.com

The Future of Neurodegenerative Disease Research and the Role of IR Imaging
May 21st 2025In the final part of this three-part interview, Ayanjeet Ghosh of the University of Alabama and Rohit Bhargava of the University of Illinois Urbana-Champaign talk about the key performance metrics they used to evaluate their model, and what the future of neurodegenerative disease research looks like.
Describing Their Two-Step Neural Model: An Interview with Ayanjeet Ghosh and Rohit Bhargava
May 20th 2025In the second part of this three-part interview, Ayanjeet Ghosh of the University of Alabama and Rohit Bhargava of the University of Illinois Urbana-Champaign discuss how machine learning (ML) is used in data analysis and go into more detail about the model they developed in their study.
Analyzing the Protein Secondary Structure in Tissue Specimens
May 19th 2025In the first part of this three-part interview, Ayanjeet Ghosh of the University of Alabama and Rohit Bhargava of the University of Illinois Urbana-Champaign discuss their interest in using discrete frequency infrared (IR) imaging to analyze protein secondary structures.
Accurate Plastic Blend Analysis Using Mid-Infrared Spectroscopy
May 15th 2025Researchers at the Sinopec Research Institute have developed a novel method using virtually generated mid-infrared spectra to accurately quantify plastic blends, offering a faster, scalable solution for recycling and environmental monitoring.

.png&w=3840&q=75)

.png&w=3840&q=75)


.png&w=3840&q=75)


.png&w=3840&q=75)


