The Challenges of Changing Retention Times in GC–MS
Special Issues
Reproducing analysis conditions is crucial to achieving consistent, accurate results in gas chromatography–mass spectrometry (GC–MS). Valid reproduction demands appropriate application of technique, solid method design, reliable and accurate equipment, and a dedicated team of well-practiced technicians and researchers. But even when all these conditions are met, users can be held back by the more subtle elements in GC–MS operations, such as cutting or changing a column, or setting up the same experiment on different equipment. Even getting the parameters of a test organized so that it can be reproduced elsewhere - in a laboratory across the hall, the country, or the world - can be daunting. Consistent GC–MS results depend upon retention-time reproducibility.
Reproducing analysis conditions is crucial to achieving consistent, accurate results in gas chromatography–mass spectrometry (GC–MS). Valid reproduction demands appropriate application of technique, solid method design, reliable and accurate equipment, and a dedicated team of well-practiced technicians and researchers. But even when all these conditions are met, users can be held back by the more subtle elements in GC–MS operations, such as cutting or changing a column, or setting up the same experiment on different equipment. Even getting the parameters of a test organized so that it can be reproduced elsewhere — in a laboratory across the hall, the country, or the world — can be daunting. Consistent GC–MS results depend upon retention-time reproducibility.
Any number of factors can affect retention times, including routine maintenance — such as cutting or changing a column, switching to a different column lot, or even moving an analysis to another system. There are several ways to account for the retention-time changes created by these types of system alterations. Some of these methods are based upon the Kovats retention index (RI) system. Historically, these adjustments were made manually, but the processes often were cumbersome and left room for human error. The net was inconsistent results.
Today's changing laboratory environments demand new approaches to solving recurring issues in reproducibility. This article discusses some current approaches to solving the problems encountered in reproducing experimental conditions and evaluates the effectiveness of those approaches.
Kovats Retention Indices
The Kovats RI system overcomes the challenges in cross-system compatibility and results validation. First discovered by Dr. E. Kovats in 1958, RI is a linear scale based upon thermodynamic properties and observation of chromatographic data trends that show a distinct advantage in predicting retention time. The system uses n-alkanes as an index against which retention times of other compounds can be measured. The retention index is information unique to a compound for a given analytical column phase. It is based upon a thermodynamic principle, and it is correlated to chemical structure. The calculation formula is

n-Alkanes are saturated hydrocarbons that consist of straight-chain formations as opposed to molecular structures that involve branching of carbon atoms. n-Alkanes are used as an index because they are nonpolar, chemically inert, and soluble in most stationary phases. These properties make the n-alkane group ideal for a retention-time scale that can be used for measurement of a variety of analytes on a given column phase.
Under linear temperature-programmed oven conditions, n-alkanes show a linear relationship between carbon number and retention time, regardless of column type, dimensions, or flow rate. The RI is defined as the number of carbon atoms in the n-alkane times 100. Thus, the retention index for C9 would be 900 and C10 would be 1000. A linear plot of these retention index values versus the actual retention time of the C9 and C10 can then be constructed. From this plot, RI values can be determined for target analytes based upon their retention times from analysis on the same column under identical conditions.
A single chromatographic run can easily determine the retention times of n-alkanes for a given system. From that information and the retention index data from target analytes, it is easy to predict with a high degree of accuracy where specific target analytes will elute on that same system.
The 2005 NIST Mass Spectral Library contains retention indices for numerous compounds. These data can be useful to analysts in several stages of research. First, the retention times for many analyte compounds can be predicted accurately if their retention indices are known and the retention times of n-alkanes are determined experimentally. Second, RI values for a large number of compounds in a method can be calibrated easily. Third, unknown compound isomers with similar mass spectra can be distinguished using mass spectral libraries and retention indices.
Additionally, Kovats indices increase flexibility for researchers who want to share data. Chromatographic results from the same compound, no matter where they are made, are directly comparable. RI, because it is based upon the stable n-alkane group, remains constant. Therefore, another lab-oratory running a different gas chromatography–mass spectrometry (GC–MS) system can easily replicate an experiment because the RI, while influenced by the liquid phase of the column, is independent of the column's dimensions or film thickness. By eliminating the system parameter variables on retention correlations, researchers need only account for two measures instead of many combinations, including time, column, film thickness, temperature, and oven program.
Long considered an industry standard, retention indices have broad application and few weaknesses. One real drawback is the necessary investment of hours needed to adjust retention times for each analyte manually in a given method when a change is made to the GC system. It requires that all retention-time information and reference sample data for each analyte be matched. In a hypothetical method with more than 50 analytes, the work would be extraordinarily tedious and nearly impossible to perform every time a column is cut or replaced.
Nonetheless, RI has become the basis for several systems designed to speed analysis times, reduce recalibration when a column is cut or changed, and allow the accurate reproduction of results when using different equipment.
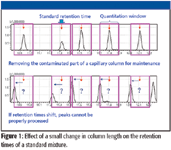
Figure 1
Updating Technology
Shimadzu (Columbia, Maryland) has incorporated RI features into its GCMSsolution 2.5 software in a feature called Automatic Adjustment of Retention Time (AART). Among other benefits, AART gives users the ability to revise up to 1000 compounds using one analysis of n-alkanes, thereby reducing time and labor invested in adjusting retention times manually (Figures 1–3). The results are extremely accurate over a wide range of retention times, and the program is adaptable to various GC analytical conditions, including those used in fast GC.
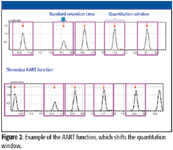
Figure 2
AART updates target compound method retention times by using their retention indices. AART is able to adjust all retention-time information simultaneously by first analyzing one n-alkane solution reference sample. It then performs a simultaneous recalibration for up to 1000 compounds. This process takes about 20 min, including data processing and verification. In contrast, manual entry would take hours.
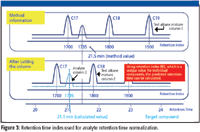
Figure 3
By comparison, retention time locking (RTL), an alternative approach, keeps retention times constant by changing the carrier-gas pressure. By focusing on a single retention time marker, this process provides information required to adjust the column flow rate to keep absolute retention times constant. But RTL requires five or six analyses to confirm the results, which is time-consuming and might not be valid in a GLP-regulated laboratory environment.
AART performs corrections at multiple retention times from low to high boiling points, enabling accurate correction over the entire chromatographic range (Figure 4). Constant linear velocity keeps the retention index accurate.
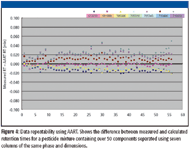
Figure 4
AART further allows time-correction measurement for parameters such as single-ion monitoring (SIM) data acquisition. The acquisition-time parameters are updated along with the compound table. This is not possible with RTL.
Applying AART to an existing method is simply a matter of adding RI information to the method. Doing so improves accuracy by limiting the possibility of human error introduced during retention-time updating. This is accomplished without changing the actual physical column flow or temperature parameters. As such, it remains valid and adheres to existing SOPs in regulated laboratory environments.
Last, and perhaps most importantly, AART is flexible and can be applied to a variety of analytical methods. From a single, dedicated GC–MS unit to universal GC–MS systems, method files used individually for specific systems can be transferred to other systems with the injection of a single n-alkane series standard (Figure 5).
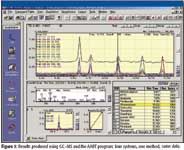
Figure 5
While most methods require the same column type to be used, RTL requires the same column type and oven temperature program. This makes it difficult to replicate tests in different laboratories, which might not work even with identical equipment. This limits data and process sharing within globally distributed organizations and between collaborating institutions.
Conclusion
Retention indices helped change the face of chromatography some 50 years ago, altering the way scientists conducted research. Today, software is again reshaping chromatography, improving reproducibility and reducing cycle times by building on these well-established industry fundamentals. These advances allow operators to efficiently share data and reproduce analyses across distributed networks and other varied corporate structures to work effectively in the 21st century.
Mark Taylor, John Monti, and Richard Whitney are with Shimadzu Scientific Instruments, Columbia, Maryland.

High-Speed Laser MS for Precise, Prep-Free Environmental Particle Tracking
April 21st 2025Scientists at Oak Ridge National Laboratory have demonstrated that a fast, laser-based mass spectrometry method—LA-ICP-TOF-MS—can accurately detect and identify airborne environmental particles, including toxic metal particles like ruthenium, without the need for complex sample preparation. The work offers a breakthrough in rapid, high-resolution analysis of environmental pollutants.
Trending on Spectroscopy: The Top Content of 2024
December 30th 2024In 2024, we launched multiple content series, covered major conferences, presented two awards, and continued our monthly Analytically Speaking episodes. Below, you'll find a selection of the most popular content from Spectroscopy over the past year.