Characterizing Microplastic Fibers Using Raman Spectroscopy
Special Issues
In this study, macro- and microscopic Raman spectroscopy were used to identify different commercial microplastic fibers using measured spectra with database searches. Raman microscopy is demonstrated as a powerful technique for microplastic fiber characterization, especially for samples that contain mixtures of components, including multiple polymers, or additives.
Microplastics have become a growing area of research, as concern over harm to the environment, and potential harm to humans, has increased. Recently, legislation passed in California has mandated the testing for, and reporting of, plastics in drinking water (SB 1422). In this study, Raman spectroscopy is used to characterize two different commercial fabric fiber samples that include synthetic polymer materials. Both macro- and microscopic Raman measurements are carried out, and chemical identification of the individual components is made through database searches. Raman microscopy is demonstrated as a powerful technique for microplastic fiber characterization, especially for samples that contain mixtures of components, including multiple polymers, or additives.
The large-scale production and use of plastic dates back to the mid-20th century. Since then, there has been a rapid growth in the production and use of plastics. With the shift from reusable to single-use applications, the amount of plastic produced has only continued to increase over time. In a study by Geyer and associates, it is estimated that, to date, 8300 million metric tons (Mt) of virgin plastics have been produced. Of that amount, only 2500 Mt are still in use. Of the remainder, only 600 Mt have been recycled, while 800 Mt have been incinerated, and 4900 Mt have been discarded. This means that 60% of the plastics ever produced are either accumulating in landfills, or polluting the natural environment (1).
The same characteristic that makes plastic an appealing choice for many different applications is also what is ultimately causing harm to the natural environment, namely its long lifetime and durability. While materials like paper, cardboard, and wood decompose on a month or year time scale, plastics take tens to hundreds of years to fully decompose (2). In the meantime, weathering causes plastics to break down into smaller fragments, exposing marine life at all stages of the food web, from small organisms like plankton (3), to large mammals like whales (4). Plastics have also been observed in many different marine environments, including coastlines (5), in Arctic sea ice (6), at the sea surface (7), and on the sea floor (8). In an effort to understand the ecological impact of plastics on marine life, research has been undertaken to identify and quantify plastic debris.
Although plastic debris can come in many sizes, microplastics are defined as plastic particulates that are smaller than 5 mm in size. In addition to a range of sizes, they can take on many forms, including fragments, films, and fibers. Fibers have been identified as a significant portion of the microplastics found in the environment. They are shed from textiles, including consumer clothing, during the manufacturing stage, and in the wearing and washing of clothing (9). Studies have been undertaken to tackle the practice of sample collection, preparation, and filtering of microplastics, which is a critical topic (10), but this study focuses on the chemical identification of microplastics.
Many different methods have been used to characterize microplastics, including standard microscopy techniques to characterize size, shape, and morphology, staining, thermogravimetric analysis, pyrolysis gas chromatography–mass spectrometry (GC-MS), Raman, and Fourier transform–infrared spectroscopy (FT-IR) (11). Both Raman and FT-IR techniques are spectroscopic techniques, sensitive to the vibrational modes of the molecule under study. Selection rules for Raman and infrared (IR) dictate which vibrational modes are observable using each technique, but generally, Raman spectroscopy will provide more vibrational information on the polymer backbone, whereas IR spectroscopy will provide more information on polymer side chains. Because Raman and IR spectroscopy are complementary techniques, ideally, a laboratory would be equipped with both techniques, if resources are available. This article focuses on Raman spectroscopy specifically as an analysis technique for characterizing plastics.
Because microplastics encompass a wide variety of sample sizes, different sampling techniques can be employed for characterization using Raman spectroscopy. For example, for samples larger than 1 mm, macroscopic measurements can be carried out. The use of a fixed spectrograph with a Raman probe enables measurement in the field, because experimental setups are typically lightweight, compact, and rugged, making them easily transportable. For samples smaller than 1 mm, or for heterogeneous samples with mixtures of polymers or other additives, a Raman microscope is the preferred option, because of its high spatial selectivity.
Once a spectrum is acquired, the next critical step is to identify exactly which polymers make up the unknown sample. Having a complete, high quality spectral database is critical for carrying out accurate spectral searching and matching. In a typical database, spectra of reference materials are recorded and stored with their chemical and physical properties in the sample record metadata. For microplastics, it is advantageous to build an application library that includes spectra of weathered plastics with their location, preparation, and analysis methods, and to include environmental and health impacts within the metadata. In addition, spectra of different colored plastics, or plastics with additives such as calcium carbonate (CaCO3) or titanium anatase (TiO2), are also critical to the correct identification of unknowns.
Experimental
In this study, two different fabric (fiber) samples are measured, both acquired from Amazon. Sample 1 is white in color, and identified by its description as "polyester soft felt," comprised of "fabric and rayon, high quality acrylic craft felt." Sample 2 is a patterned fabric sample with white and red areas, identified as being "100% cotton."
The Raman spectra presented in this paper are collected using two different systems. For macroscopic measurements, a MacroRam benchtop Raman spectrometer (Horiba), equipped with a TouchRaman BallProbe (Marqmetrix), is used. The use of the TouchRaman BallProbe allows spectral measurements to be carried out without the requirement to mount the sample or align the probe. The probe is pressed onto the sample under measurement, and a spectrum is recorded. The MacroRam uses an excitation wavelength of 785 nm, which helps to suppress fluorescence that would otherwise be present at shorter laser wavelength excitation (12). A simplified optical layout of a typical Raman benchtop system with an immersion-touch probe is shown in Figure 1b.
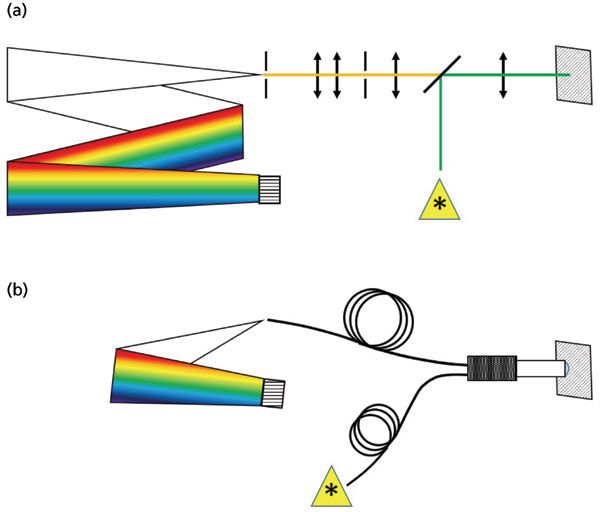
Figure 1: Optical layouts of typical Raman systems. (a) A typical Raman microscope including objective, filtering, and confocal aperture with focusing optics. (Generally, confocal Raman microscopes are coupled to scanning spectrometers with wavelength tuning capability and multiple lasers and gratings.) (b) A typical benchtop Raman system with immersion or touch probe including fiber optic coupling of laser excitation source with Raman collection optics (generally, benchtop Raman systems are coupled to fixed grating spectrographs for use with single wavelength laser excitation).
For microscopic measurements, an XploRA Plus (Horiba) confocal Raman microscope was used. This system is equipped with a combination of three different excitation lasers (532 nm, 638 nm, and 785 nm) and four gratings (600 gr, 1200 gr, 1800 gr, and 2400 gr). A 100x magnification objective (numerical aperture of 0.9) is used for all micro-Raman measurements described here. The system is equipped with a deep-cooled SynapseEM electron multiplying charge coupled device (EMCCD), for sensitivity and speed, which is especially critical when carrying out Raman imaging measurements. A simplified optical layout of a typical Raman microscope is shown in Figure 1a.
Results and Discussion
For Sample 1, measurements were first carried out using the macroscopic configuration previously described. The recorded Raman spectrum is baseline subtracted, to account for fluorescence background, and fast Fourier transform (FFT) smoothing was carried out to further refine the spectral quality. The resulting processed spectrum is shown in Figure 2. A database search using KnowItAll libraries (BioRad) resulted in a one component match to polyethylene terephthalate (PET). This is not surprising, since polyester is defined by 16 CFR § 303.7 (c) as "any long chain synthetic polymer composed of at least 85% by weight of an ester of a substituted aromatic carboxylic acid, including, but not restricted to, substituted terephthalate units."
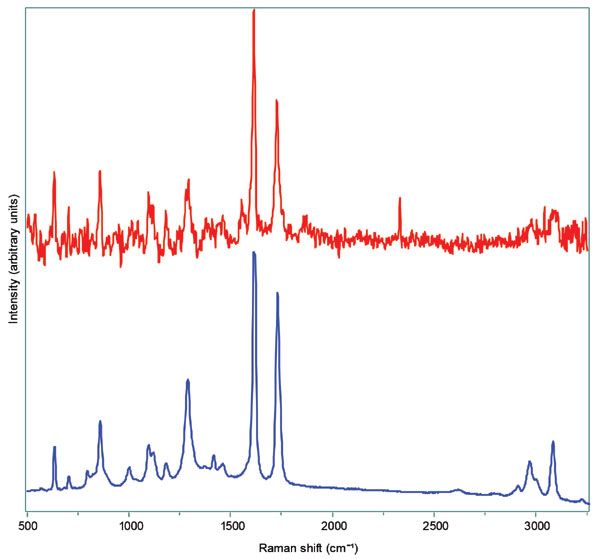
Figure 2: Macroscopic Raman spectrum recorded using a macroscopic Raman system, described in the Experimental section, for sample 1 (red), and reference spectrum of polyethylene terephthalate (blue).
Although the macroscopic measurement confirms that sample 1 contains PET, if there is a combination of different components in the fabric as advertised, Raman microscopy will provide additional spatial information. Using the microscopic configuration described in the Experimental section, 785 nm excitation is used to carry out a line scan measurement across a fiber located in sample 2. An image of the fiber measured is shown in the inset of Figure 3, and the resulting average spectrum is shown in red. The presence of PET in the sample is confirmed (PET reference spectrum in blue, Figure 3), but there is also evidence of cellulose in the sample (cellulose reference spectrum in green, Figure 3). Specifically, the sharp band observed at approximately 1100 cm-1 in sample 1 overlaps with the same vibrational band in cellulose. Although this band also overlaps with spectral features in the PET reference spectrum (blue), the relative magnitudes of the two bands around 1100 cm-1 in sample 1 are not consistent with PET alone. This result agrees with the fabric description that includes rayon. According to 16 CFR § 303.7 (d), rayon is defined as a "manufactured fiber composed of regenerated cellulose."
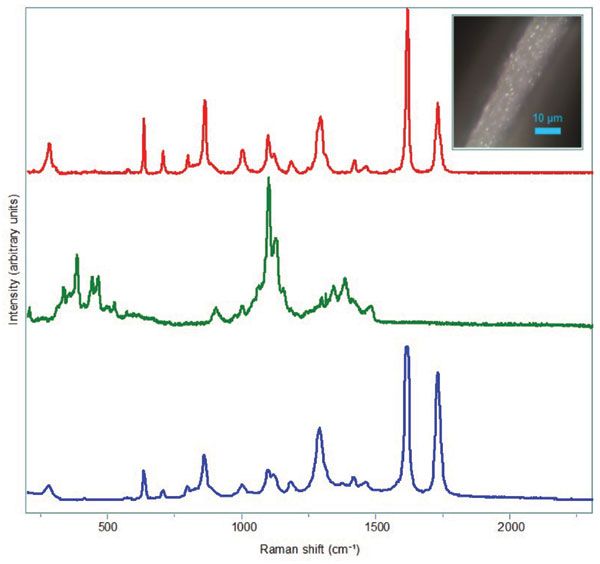
Figure 3: Confocal Raman microscope spectrum of sample 1 acquired using a Raman microscope, described in the Experimental section, with a 785 nm laser excitation (red), reference spectrum of microcrystalline cellulose (green), and a reference spectrum of PET (blue). The inset shows the video image of the fiber under study.
What is not observed in sample 1, but is mentioned in the description of the fabric, is acrylic. According to 16 CFR § 303.7 (a), acrylic is defined as being "composed of at least 85% by weight of acrylonitrile units." There is no evidence of acrylonitrile (monomer or polymer) in sample 1. If acrylic were present, a band at 2240 cm-1 would be observable in the Raman spectrum, corresponding to the nitrile stretching mode in acrylonitrile. No such bands are observed in sample 1, despite a thorough survey of the fabric area.
For sample 2, macroscopic measurements result in spectra that are too congested for straightforward analysis. Microscopic measurements yield much more information. Preliminary single point measurements, taken at various spots on the sample, indicate the presence of different components. To account for these spatial differences, a Raman map is carried out over a 100 µm × 100 µm area. The results show that there are at least three different components in the fabric, shown as red, green, and blue spectra in Figure 4. Database searches for the three unknown components reveal matches to PET (red), cellulose (blue), and a red pigment (multiple possible database matches, green).
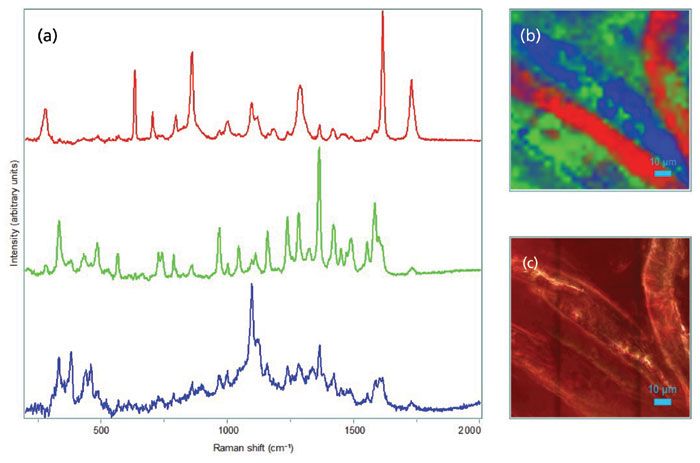
Figure 4: (a) Raman spectra recorded from sample 2. PET is shown in red, red dye spectrum is shown in green, and cellulose is shown in blue. (b) Pseudo color rendered Raman image of 100 µm x 100 µm area of the sample with color coding corresponding to the three spectra in (a). (c) Video image of sample 2 used for the Raman measurement.
To assess the spatial heterogeneity in sample 2, the representative spectra recorded from the sample for PET, cellulose, and the unknown red pigment are used as references in a classical least squares (CLS) treatment of the hyperspectral Raman data cube. The resulting rendered Raman image is shown in Figure 4b. When comparing the Raman image with the optical image (Figure 4c), one can see good correlation of the Raman signal with individual fibers in the fabric. Sample 2 was described by the seller as 100% cotton; however, it is readily apparent from the Raman image that there are PET fibers present, as indicated by the bright red areas in Figure 4b.
Conclusions
The samples studied here serve as a demonstration of how Raman spectroscopy can be applied to the study of microplastics, specifically fiber samples. Both synthetic (PET) and natural (cellulose) fibers are easily identifiable. In addition, Raman spectroscopy can be used to identify additives, including pigments or dyes, as demonstrated in sample 2. Finally, the spatial selectivity that is provided by Raman microscopy allows for characterization of heterogeneous samples that might otherwise be misidentified or mischaracterized using macroscopic techniques.
References
(1) R. Geyer, J.R. Jambeck, and K.L. Law, Sci. Adv. 3, E1700782 (2017).
(2) Ocean Conservancy, International Coastal Cleanup (2010 Report: Trash Travels, 2010).
(3) M. Cole, P. Lindeque, E. Fileman, C. Halsband, R. Goodhead, J. Moger, and T.S. Galloway, Environ. Sci. Technol. 47, 6646-6655 (2013).
(4) A.L. Lusher, G. Hernandez-Milian, J. O'Brien, S. Berrow, I. O'Connor, and R. Officer, Environ. Pollut. 199, 185-191 (2015).
(5) S.L. Whitmire, S.J. Van Bloem, and C.A. Toline, Marine Debris Program Office of Response and Restoration (National Oceanic and Atmospheric Administration Contract GSI-CU-1505, 2017), pg. 23.
(6) I. Peeken, S. Primpke, B. Beyer, J. Gutermann, C. Katlein, T. Krumpen, M. Bergmann, L. Hehemann, and G. Gerdts, Nat. Commun. 9, 1505 (2018).
(7) National Oceanic and Atmospheric Administration Marine Debris Program 2016 Report on Modeling Oceanic Transport of Floating Marine Debris (NOAA Marine Debris Program, Silver Springs, Maryland., 2016), pg. 21.
(8) A.J. Jamieson, L.S.R. Brooks, W.D.K. Reid, S.B. Piertney, B.E. Narayanaswamy, and T.D. Linley, Roy. Soc. Open Sci. 6, 180667 (2019).
(9) B.M. Carney Almroth, L. Astrom, S. Roslund, H. Petersson, M. Johansson, and N.-K. Persson, Environ. Sci. Pollut. R. 25, 1191-1199 (2018).
(10) GESAMP, Sources, Fate and Effects of Microplastics in the Marine Environment: Part Two of a Global Assessment, P. J. Kershaw, and C. M. Rochman Eds. IMO/FAO/UNESCO-IOC/UNIDO/WMO/IAEA/UN/UNEP/UNDP (Joint Group of Experts on the Scientific Aspects of Marine Environmental Protection. Rep. Stud. GESAMP No. 93, 220, 2016), pp. 104–109.
(11) M.G.J. Löder, and G. Gerdts, Marine Anthropogenic Litter, M. Bergmann, L. Gutow, and M. Klages, Eds. (Springer, New York, New York, 2015), pp. 201–207.
(12) D. Tuschel, Spectroscopy31,14-23 (2016).
Bridget O'Donnell is the Manager of Raman Applications at Horiba Scientific, in Piscataway, New Jersey. Eunah Lee is the Raman Project Manager of Raman Applications at Horiba Scientific, in Sunnyvale, California. Direct correspondence to: bridget.odonnell@horiba.com
Nanometer-Scale Studies Using Tip Enhanced Raman Spectroscopy
February 8th 2013Volker Deckert, the winner of the 2013 Charles Mann Award, is advancing the use of tip enhanced Raman spectroscopy (TERS) to push the lateral resolution of vibrational spectroscopy well below the Abbe limit, to achieve single-molecule sensitivity. Because the tip can be moved with sub-nanometer precision, structural information with unmatched spatial resolution can be achieved without the need of specific labels.
Tomas Hirschfeld: Prolific Research Chemist, Mentor, Inventor, and Futurist
March 19th 2025In this "Icons of Spectroscopy" column, executive editor Jerome Workman Jr. details how Tomas B. Hirschfeld has made many significant contributions to vibrational spectroscopy and has inspired and mentored many leading scientists of the past several decades.

