Classical Least Squares, Part VII Spectral Reconstruction of Mixtures
Continued discussion of the classical least squares approach to calibration, with a focus on the reconstruction of mixtures

We continue our discussion of the classical least squares approach to calibration, focusing on the reconstruction of mixtures in this installment.
Before continuing with our discussion, we need to report some errata that a sharp-eyed reader found in our previous column (1). Fortunately, although the worst one is widespread in the column, it is editorial rather than substantive and we suspect that most readers caught it and realized what was intended. This error was the interchange of the axis labels on all those plots where the spectra were plotted as absorbance; the correct axis labels should be that the x-axis represents wavelengths and the y-axis represents absorbance. Unfortunately, we have to confess that it was our fault, apparently the incorrect information was put into the plot generator program and was thus used repeatedly for all those plots. The article was not proofread for that type of error because the plots were computer-generated and we relied on the computer not making a mistake. (Which it didn't!) In addition, because the data was collected using a Fourier-transform near-infrared (FT-NIR) instrument, the correct units for the wavelength scale are wavenumbers, rather than wavelengths.
Another type of error in that column is that for Figures 4c, 5e, and 6e, the wavelength ranges in the figure captions disagree with the wavelength ranges in the spectral plots. In all of those cases, the wavelength range indicated on the plots are the correct ones.
We thank Karl Norris for finding and reporting those errors to us. Karl also pointed out that one of our statements in the prior column (2), while, strictly speaking, correct, might lead someone to misinterpret our intentions. We stated, "Only one spectrum appears, because the spectra are so similar that they completely and exactly overlap each other, thus the spectrum from one reading hides the spectrum of each of the other two." Karl pointed out that someone might interpret that as indicating that the spectra were exactly matched, even down to the noise. Of course that's not the case; a better wording might have been something like ". . . because the spectra are so similar that they overlap each other to within a pixel of the display . . . ," which would have better indicated our intended meaning.
This column is the next continuation of our discussion of the classical least squares (CLS) approach to calibration (1–6).
Where do we stand? We have just finished presenting the data spectra, measured in the NIR spectral region, for a series of clear liquid samples comprising binary and ternary mixtures of three materials that are all miscible in all proportions.
In the previous installments, we presented the spectra of the pure materials, as well as the spectra of the mixtures. However, we did not present these spectra in absorbance format. Because we will be comparing the spectral recreations to the original data spectra in absorbance format, it is appropriate to present the mixture spectra in absorbance format before we do that. These spectra are shown in Figure 1. As previously stated, when plotting absorbance we do not include the spectral region below 4500 cm-1. Therefore, all of our future spectra plots, as well as the calculations to be performed on the spectra, will exclude the spectral region below 4500 cm-1.
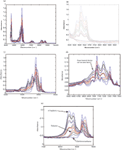
Figure 1: Absorbance spectra of all mixtures: (a) full spectrum, (b) 4500â5000 cm-1, (c) 5000â6500 cm-1, (d) 6500â7500 cm-1, and (e) 7500â9000 cm-1. Note how the original experimental design can be seen in the spectra.
Note that the experimental design can be seen in parts b, c, d, and e of Figure 1, similarly to what we noted in the transmission spectra of the mixtures. In Figure 1e, we have indicated the spectra of the pure components, to assist in visualizing the design.
Adding Some Calculations
We will now turn our attention to the earlier columns in this subseries (Parts II, V, and VI), in which we developed the mathematics relating the spectra of a mixture to the spectra of the components of samples, weighted by their concentrations.
Having presented the data, both of the pure materials and the mixtures we worked with, we will now present the spectra of the mixtures overlaid with the spectra recreated according to the mathematics as we described it. In doing so, we illustrated how we can recreate the spectrum of the mixture when we know the composition and the spectra of the components. Similarly, we showed how we can calculate the composition when we know the spectrum of the mixture and the spectra of the components.
Science progresses, among other means, by confirming theoretical predictions with experimental results. To do this for our CLS calibration modeling procedure, we will now combine the two operations we described. We will use the spectra of the components and the spectra of the mixtures to ascertain their compositions, and then use those calculated compositions to recreate the mixture spectra. By doing all of this we will verify the mathematical approach, because if it is all working properly the recreations of the mixture spectra and the actual mixture spectra should be essentially identical. As almost a side effect, the ability to reconstruct the spectrum of a mixture also verifies that Beer's law is operative for the materials and mixture involved.
If that were not the case, then the reconstruction of the spectra would be poor, as we found with the water–methanol–acetic acid mixtures (4). In that case, it is clear that the underlying cause of the failure of Beer's law to hold is due to interactions between the chemical species. There are at least two contributions to that interaction. One is the distortion of the –OH species in all three materials as a result of changes in the hydrogen bonding of the materials in the different environments. A second cause, which we thank Marvin Margoshes for pointing out, is the generation of H3O+ from ionization of the acetic acid. This actually introduces a fourth component into the mixtures that is not accounted for in the mathematics.
Our experimental design included three ternary mixtures, as indicated in Table I.

Table I: Compositions of the three ternary mixtures
We therefore apply the mathematics to the data from these three mixtures to see how well we can reproduce the actual mixture spectra from the spectra of the pure materials. In Figures 2, 3, and 4 we present the plots of the recreated spectra, the original data spectra, and their residuals.
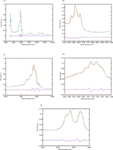
Figure 2: Plots of actual and recreated spectra of the ternary mixtures: (a) full spectrum, (b) 4500â5000 cm-1, (c) 5000â6500 cm-1, (d) 6500â7500 cm-1, (e) 7500â9000 cm-1. Toluene = 50%, dichloromethane = 25%, and n-heptane = 25%. In all parts of the figure, blue = actual spectrum, red = recreated spectrum, and green = residual.
We note that the largest residual (for example, the difference in the recreation of the data spectrum), is 0.06 absorbance at 5880 cm-1; this deviation corresponds to roughly 7.5% of the spectral value. Over the rest of the spectrum the residual is, to a great extent, too small to be observed.
Overall, then, we see that the ability of the mixture components to recreate the actual mixture spectrum is excellent. Except for a few localized sections of each spectrum, which correspond to the peak absorbances of the constituents of the mixtures, the recreation is extremely good. Similarly good spectral reconstructions were found for the various binary mixtures, as well.
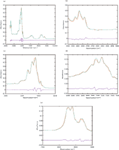
Figure 4: Plots of actual and recreated spectra of the ternary mixtures: (a) full spectrum, (b) 4500â5000 cm-1, (c) 5000â6500 cm-1, (d) 6500â7500 cm-1, (e) 7500â9000 cm-1. Toluene = 25%, dichloromethane = 25%, and n-heptane = 50%. In all parts of the figure, blue = actual spectrum, red = recreated spectrum, and green = residual.
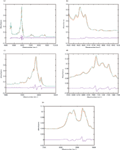
Figure 3: Plots of actual and recreated spectra of the ternary mixtures: (a) full spectrum, (b) 4500â5000 cm-1, (c) 5000â6500 cm-1, (d) 6500â7500 cm-1, (e) 7500â9000 cm-1. Toluene = 25%, dichloromethane = 50%, and n-heptane = 25%. In all parts of the figure, blue = actual spectrum, red = recreated spectrum, and green = residual.
In our next installment we will look at the quantitative results we obtained from this experiment.
Jerome Workman, Jr. serves on the Editorial Advisory Board of Spectroscopy and is the executive vice president of Engineering at Unity Scientific, LLC, (Brookfield, Connecticut). He is also an adjunct professor at U.S. National University (La Jolla, California), and Liberty University (Lynchburg, Virginia). His email address is JWorkman04@gsb.columbia.edu
Jerome Workman, Jr.
Howard Mark serves on the Editorial Advisory Board of Spectroscopy and runs a consulting service, Mark Electronics (Suffern, NY). He can be reached via e-mail: hlmark@prodigy.net

Howard Mark
Celebrating 25 Years
The editors congratulate Howard Mark and Jerry Workman for 25 years of statistics and chemometrics columns in Spectroscopy.
References
(1) H. Mark and J. Workman, Spectroscopy 26(6), 22–28 (2011).
(2) H. Mark and J. Workman, Spectroscopy26(5), 12–22 (2011).
(3) H. Mark and J. Workman, Spectroscopy 25(5), 16–21 (2010).
(4) H. Mark and J. Workman, Spectroscopy 25(6), 20–25 (2010).
(5) H. Mark and J. Workman, Spectroscopy 25(10), 22–31 (2010).
(6) H. Mark and J. Workman, Spectroscopy 26(2), 26–33 (2011).

AI Shakes Up Spectroscopy as New Tools Reveal the Secret Life of Molecules
April 14th 2025A leading-edge review led by researchers at Oak Ridge National Laboratory and MIT explores how artificial intelligence is revolutionizing the study of molecular vibrations and phonon dynamics. From infrared and Raman spectroscopy to neutron and X-ray scattering, AI is transforming how scientists interpret vibrational spectra and predict material behaviors.
Real-Time Battery Health Tracking Using Fiber-Optic Sensors
April 9th 2025A new study by researchers from Palo Alto Research Center (PARC, a Xerox Company) and LG Chem Power presents a novel method for real-time battery monitoring using embedded fiber-optic sensors. This approach enhances state-of-charge (SOC) and state-of-health (SOH) estimations, potentially improving the efficiency and lifespan of lithium-ion batteries in electric vehicles (xEVs).
New Study Provides Insights into Chiral Smectic Phases
March 31st 2025Researchers from the Institute of Nuclear Physics Polish Academy of Sciences have unveiled new insights into the molecular arrangement of the 7HH6 compound’s smectic phases using X-ray diffraction (XRD) and infrared (IR) spectroscopy.