Close Enough: The Value of Semiquantitative Analysis
Most analytical measurements performed by either inductively coupled plasma–optical emission spectrometry (ICP-OES) or ICP–mass spectrometry (MS) require accuracy and precision, which are essential for obtaining correct answers. However, all modern ICP-OES and ICP-MS instruments have the ability to perform semiquantitative analyses. This seems strange since accuracy is important, but semiquantitative analysis does have a role in analytical measurements. This article will explore why semiquantitative analysis is important and will look at various ways it can be performed and implemented.

Imagine that a laboratory is running a batch of samples. Upon reviewing the data, it is observed that some samples contain abnormally high levels of a certain element, yet for all the QC checks and samples, the values of this element are in the expected range. Do these samples really contain elevated levels? It is possible. Or is there something else in the samples that is causing the high concentrations to be read? The same scenario can also be observed for samples that contain unexpectedly low levels. What is going on?
There are several ways to confirm results:
- The samples can be rerun as they are to see if the same answers are obtained.
- Additional wavelengths or isotopes of the elements in question can be analyzed to see if the same concentrations are obtained for all wavelengths and isotopes.
- The samples can be prepared differently (that is, using a different dilution factor) to see if the results agree.
- The samples can be analyzed by an alternate technique and the results compared.
All of these are valid approaches and could give the correct values, but they may not identify the problem in the original analysis. In addition, all of these approaches are time-consuming.
An alternate tactic is to perform a semiquantitative analysis of the samples to answer the question, "What else is in these samples that could be causing the elevated levels?" In this case, the "what else" is more important than measuring exactly how much of the "what else" is present. By identifying additional components, it may be possible to resolve the discrepancy. The benefit of semiquantitative analysis is that it is much less time-consuming than quantitative analysis.
Let's take a look at some ways in which semiquantitative analysis can be performed, some ways in which it can be used, and then some specific examples. A quick note: Some of these variations of semiquantitative analysis implementation are instrument- or technique-specific, while others are more general.
All the Data All the Time
On some instruments, it is possible to enter a mode where data are acquired for all elements at the same time as the quantitative data are being acquired. With this extra information, analysts can see what else is in the sample, which can give information as to what is causing the unexpected high or low concentrations. Because conditions are not optimized for every element, the concentration results are not the most accurate, but that is acceptable. Remember the purpose: to find out what else is in the sample. This can be a valuable tool.
There are two minor drawbacks to this approach. First, the analysis time per sample is slightly longer because more data are being acquired. The extra time is much shorter than would be expected if all elements were added to the quantitative method because the timings are not optimized for high-precision analysis. However, in a high-throughput laboratory running many samples, this extra time may be detrimental.
The other drawback is that the size of the data file will be larger than a quantitative analysis file. However, this should not pose a problem given the storage capacities of internal hard drives on current computers and the wide availability of external hard drives available for extra storage.
Looking at Peaks
If acquiring all the data all the time is not a practical option or not possible, a scanning method can be used on inductively coupled plasma–mass spectrometry (ICP-MS) instruments. In this mode, a separate method has to be created and the sample must be run again, but the analysis time is quick — generally less than 1 min. And calibration standards are not required.
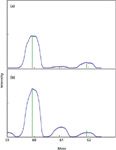
A scanning method yields a mass spectrum so that analysts can quickly review peaks and see what is present or not. Looking for peaks and comparing them to the natural isotopic ratio abundances will quickly tell if an element is present or if an interference is present. For example, nickel (Ni) has five naturally occurring isotopes, three of which do not have isobaric interferences: m/z 60 (26.23% abundance), m/z 61 (1.140% abundance), and m/z 62 (3.634% abundance). A mass scan will quickly allow the user to identify if Ni is present or not — or if there is an interference. If peaks seen at these masses show the natural isotopic abundance ratio (as shown in Figure 1a), then it is likely that Ni is present. However, if there are no peaks seen, then Ni is not in the sample. If peaks appear but they are not present at the natural isotopic ratio (as in Figure 1b), then it is likely there is an interference present. In addition, the size of the peaks reflects the amount of element present in the samples.

Figure 1: Mass scans of the Ni isotopes that do not have isobaric interferences: (a) a nickel standard; (b) nickel standard in the presence of calcium (Ca); CaO+ is forming at m/z 60. The green bars represent the natural isotopic abundance of the Ni isotopes.
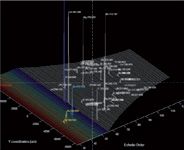
ICP–optical emission spectrometry (OES) instruments equipped with a way to view the echellogram have a similar capability as scanning in ICP-MS, although it is implemented differently. The echellogram allows users to view the relative intensity of all peaks defined in the method, which allows for quick interpretation: identification of major components, the relative abundance of various elements, and identifying the presence of interferences. A representative echellogram is shown in Figure 2.

Figure 2: A typical echellogram from an ICP-OES analysis.
Viewing peaks is a quick, easy way to verify if an element is present and determine if an interference is causing the apparent concentration.
Using Semiquant-Specific Methods
Some instruments include modes designed specifically for semiquantitative analysis. In these modes, a blank and calibration standard are run, as in quantitative analysis — except that only a single calibration standard is required. But rather than establishing a calibration curve, the blank and standard are compared to the known response of the instrument, which is then updated. Subsequent samples are then analyzed, and the intensities at different masses are compared to the updated mass response of the instrument. Using preprogrammed algorithms, concentrations are then determined for all elements. This technique will not give the same accuracy as a quantitative analysis method, but it will yield results that are fairly close. The benefit of this mode is that concentrations for all elements can be obtained in about a minute per sample.
Using Previously Established Calibration Curves
One of the major differences between ICP-OES and ICP-MS is the way that samples are measured. Because photons are measured with ICP-OES, the sample does not have to enter the instrument — only light is required, and the rest of the sample can be swept away after passing through the plasma. However, with ICP-MS, the sample must enter the instrument for the ions to pass from the plasma to the spectrometer. Because of these differences, ICP-OES is inherently more stable than ICP-MS, as there is no sample deposition on any components that would affect the measurement. This characteristic allows for a different type of semiquant analysis: using stored calibration curves.
For the best accuracy, it is always recommended to run a set of calibration standards before analyzing a batch of samples. Establishing the calibration curves immediately before running a set of samples ensures that both sets of measurements are taken under the same conditions, thus providing more accurate results. (Any day-to-day discrepancies in instrument performance or condition will be eliminated.) However, because ICP-OES is such a stable technique, it is possible to run a batch of samples against a previously established calibration curve with relatively good accuracy. Provided that the same internal standard at the same concentration is used in both the samples and the original calibration standards, this accuracy can even approach quantitative levels. The software will compare the responses of the internal standard and adjust the resulting concentrations accordingly, usually to within less than 30% of the true concentration, even if different nebulizers are being used. In this way, semiquant analysis can be performed rapidly, without the need to make or run new calibration standards. The time savings can be immense in this situation as all of the desired elements and wavelengths would only need to be calibrated once and stored for future reference.
Uses of Semiquantitative Analysis
We've mentioned that semiquantitative analysis is beneficial for helping determine if abnormally high or low concentrations are true results or the effect of interferences, but it also has other applications, such as screening and extracting more results from data already acquired.
When used for screening, semiquantitative results can alert users to potential or unexpected problems. For example, a laboratory receives an unusual sample, not typical of what is normally analyzed or from a source that is known to have different characteristics. Instead of immediately performing a quantitative analysis on the sample, it may be beneficial to run a semiquantitative analysis to reveal the major components. The presence and levels of matrix elements will be identified, which will alert users to potential interferences and help determine the correct dilution factor for a successful quantitative analysis. In addition, the presence of other elements will be seen, which will help analysts decide what elements should be added to the quantitative analysis method.
"All the data all the time" mode is useful for extracting more information from the data after they have already been analyzed. For example, a sample may be analyzed for a group of elements with a quantitative method, but later, for some reason, it becomes important to determine the presence of other elements in the sample. In this case, the sample can be rerun, which involves preparing it again, modifying the quantitative method, and preparing new calibration standards — a time-consuming process. Or, if "all the data all the time" mode was used, analysts can simply review this data to determine if the new element or elements of interest are present and their approximate concentrations. If this analysis proves that they are present at meaningful levels, then the sample will still have to be reanalyzed with a quantitative method. But if they are not present at meaningful levels, then a significant amount of time and effort was saved.
Examples Where Semiquant Analysis Proves Useful
Mercury (Hg) is commonly analyzed by ICP-MS as part of a multielement suite; it is important to accurately measure low levels because of its toxic nature. Imagine that during the analysis of a batch of similar samples, Hg appears at an unexpectedly high concentration for a particular sample. Is Hg really present at that amount? The initial thought is that it is probably because there are not any common interferences on Hg. This is further confirmed if the internal standard associated with Hg exhibits the same degree of suppression as other samples in the batch and all the QC standards pass.
However, it still seems strange that this one particular sample would have a significantly higher level of Hg than other similar samples. Therefore, it is decided to perform a semiquantitative analysis on the high Hg sample and another more "normal" sample, for comparison. When the results of the semiquantitative analysis are compared, it is noted that the levels of tungsten (W) are significantly higher in the sample with high Hg compared with the "normal" sample. It is known that W readily forms oxides in the plasma. What's more, because W has multiple isotopes, WO+ falls on the same masses as all the Hg isotopes, so it is not possible to find an interference-free Hg isotope. Therefore, it appears that the high Hg content is the result of WO+ and not Hg. The analyst can then take the appropriate actions to measure the correct Hg concentration.
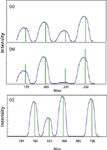
The semiquantitative analysis can be performed in a variety of ways. Figure 3 shows an example of how scanning and looking at peaks identifies the problem. Figure 3a shows the Hg peaks (which do not have isobaric interferences) in a standard; note how the peaks match the natural isotopic abundance ratio, indicated by the green bars under the peaks. Figure 3b shows the same peaks in a sample that contains W. Obviously, the green bars do not match the peaks, indicating that something other than Hg is present. Scanning the W isotopes (Figure 3c) confirms the presence of this element. Taken together, these spectra provide evidence that WO+ is causing an interference on Hg.

Figure 3: Mass spectra of Hg and W isotopes: (a) Spectrum of Hg isotopes that do not have isobaric interferences; (b) spectrum of Hg isotopes in the presence of W, indicating an interference is present; (c) spectrum of W isotopes indicating W is present in the solution used in Figure 2b.
In another example, rhodium (Rh) is a commonly used internal standard for ICP-MS analysis. During an analysis, it is noticed that elements associated with Rh are reading lower than expected in a given sample. Upon closer inspection of the data, it is noticed that the Rh intensities are significantly higher in this sample than in the calibration blank, suggesting that the Rh signal is being enhanced, which would cause concentrations to read lower. Furthermore, it is noticed that other internal standards in the method are slightly suppressed in the sample relative to the blank, as expected. What is going on with Rh?
The initial thought is that there must be an interference on Rh, but what? A quick semiquantitative analysis of the sample will yield the answer: This particular sample has significantly higher levels of copper (Cu) than other samples. Therefore, the problem must be CuAr+ formation in the plasma: 63 Cu40 Ar+ has the same m/z as Rh. The problem can be remedied by either increasing the concentration of the Rh internal standard in all the calibration standards and samples or using a different internal standard that shares many of the characteristics of Rh, such as indium (In).
Summary
This article has described semiquantitative analysis and how it is implemented, as well as shown how it can be used as a complementary analytical tool for quantitative measurements. Certainly semiquantitative analysis is not for every laboratory, but it is another tool that analytical chemists should be aware of and use when applicable.
Kenneth Neubauer is a Senior Scientist of Atomic Spectroscopy at PerkinElmer. Please direct correspondence to: Kenneth.Neubauer@PerkinElmer.com.

Kenneth Neubauer
Laura Thompson is an ICP Product Planning Manager at PerkinElmer. Please direct correspondence to: Laura.Thompson@PerkinElmer.com.

Laura Thompson
High-Speed Laser MS for Precise, Prep-Free Environmental Particle Tracking
April 21st 2025Scientists at Oak Ridge National Laboratory have demonstrated that a fast, laser-based mass spectrometry method—LA-ICP-TOF-MS—can accurately detect and identify airborne environmental particles, including toxic metal particles like ruthenium, without the need for complex sample preparation. The work offers a breakthrough in rapid, high-resolution analysis of environmental pollutants.
Applications of Micro X-Ray Fluorescence Spectroscopy in Food and Agricultural Products
January 25th 2025In recent years, advances in X-ray optics and detectors have enabled the commercialization of laboratory μXRF spectrometers with spot sizes of ~3 to 30 μm that are suitable for routine imaging of element localization, which was previously only available with scanning electron microscopy (SEM-EDS). This new technique opens a variety of new μXRF applications in the food and agricultural sciences, which have the potential to provide researchers with valuable data that can enhance food safety, improve product consistency, and refine our understanding of the mechanisms of elemental uptake and homeostasis in agricultural crops. This month’s column takes a more detailed look at some of those application areas.
Trending on Spectroscopy: The Top Content of 2024
December 30th 2024In 2024, we launched multiple content series, covered major conferences, presented two awards, and continued our monthly Analytically Speaking episodes. Below, you'll find a selection of the most popular content from Spectroscopy over the past year.
