Colorimetric Determination of Tea-Stained Seashells Using the B&W Tek Quest X UV-vis-NIR Spectrometer
This study compares the sensitivity of CIE Lab values, peak area, and yellowness index for the determination of color attributes among a set of white and stained seashells exposed to tea tannins. With its optimized ultraviolet-visible (UV-vis) and near-infrared (NIR) performance, the Quest X linear CCD array spectrometer stands out as a versatile and easy-to-use low-stray light optical bench device, particularly useful in this study for rapid at-line measurements. Our findings show that the peak-area integration method provided greater sensitivity for separating the seashells based on human perception of color. This approach has the potential for accurately measuring the color of samples at various time points, after treatment, for product claims, and for significantly enhancing product quality and performance, thereby instilling confidence in the product development process.
In industries such as food, cosmetics, and consumer products, the ability to measure color quantitatively is an integral part of product development. The pressure to bring new products to market quickly without compromising quality drives scientists and engineers to adopt technologies that facilitate rapid optimization of formulas and processes. In the food industry, color signals a food item's freshness, ripeness, maturity, safety, and spoilage. Yet, in other industries, depending on the product’s design attributes, color, and, in particular, a color change may be an attribute that defines a product’s efficacy, such as consumer products and cosmetics designed to whiten or lighten. In other instances, when the product changes color over time, it may be perceived as a negative attribute, such as poor quality, affecting consumer appeal.
The development of a non-destructive, rapid, and easy-to-use instrumental procedure for the measurement of color attributes is not just important but a game-changer. It verifies quality and provides R&D scientists with information to enhance product formulations, such as when products undergo stability testing in high-temperature and humidity chambers. This study uses a combined UV-vis-NIR diode-array spectrophotometer, for the non-destructive measurement of seashells exposed to tea tannins.The study is intended to demonstrate the speed and performance excellence of the technology to measure color, as well as a practical application of color analysis for industrial use.The study is designed to compare sensitivity between CIE color metric L and b values, and yellowness obtained from transmission spectra with peak area analysis obtained from the same spectral data transformed into absorption spectra.
Experimental
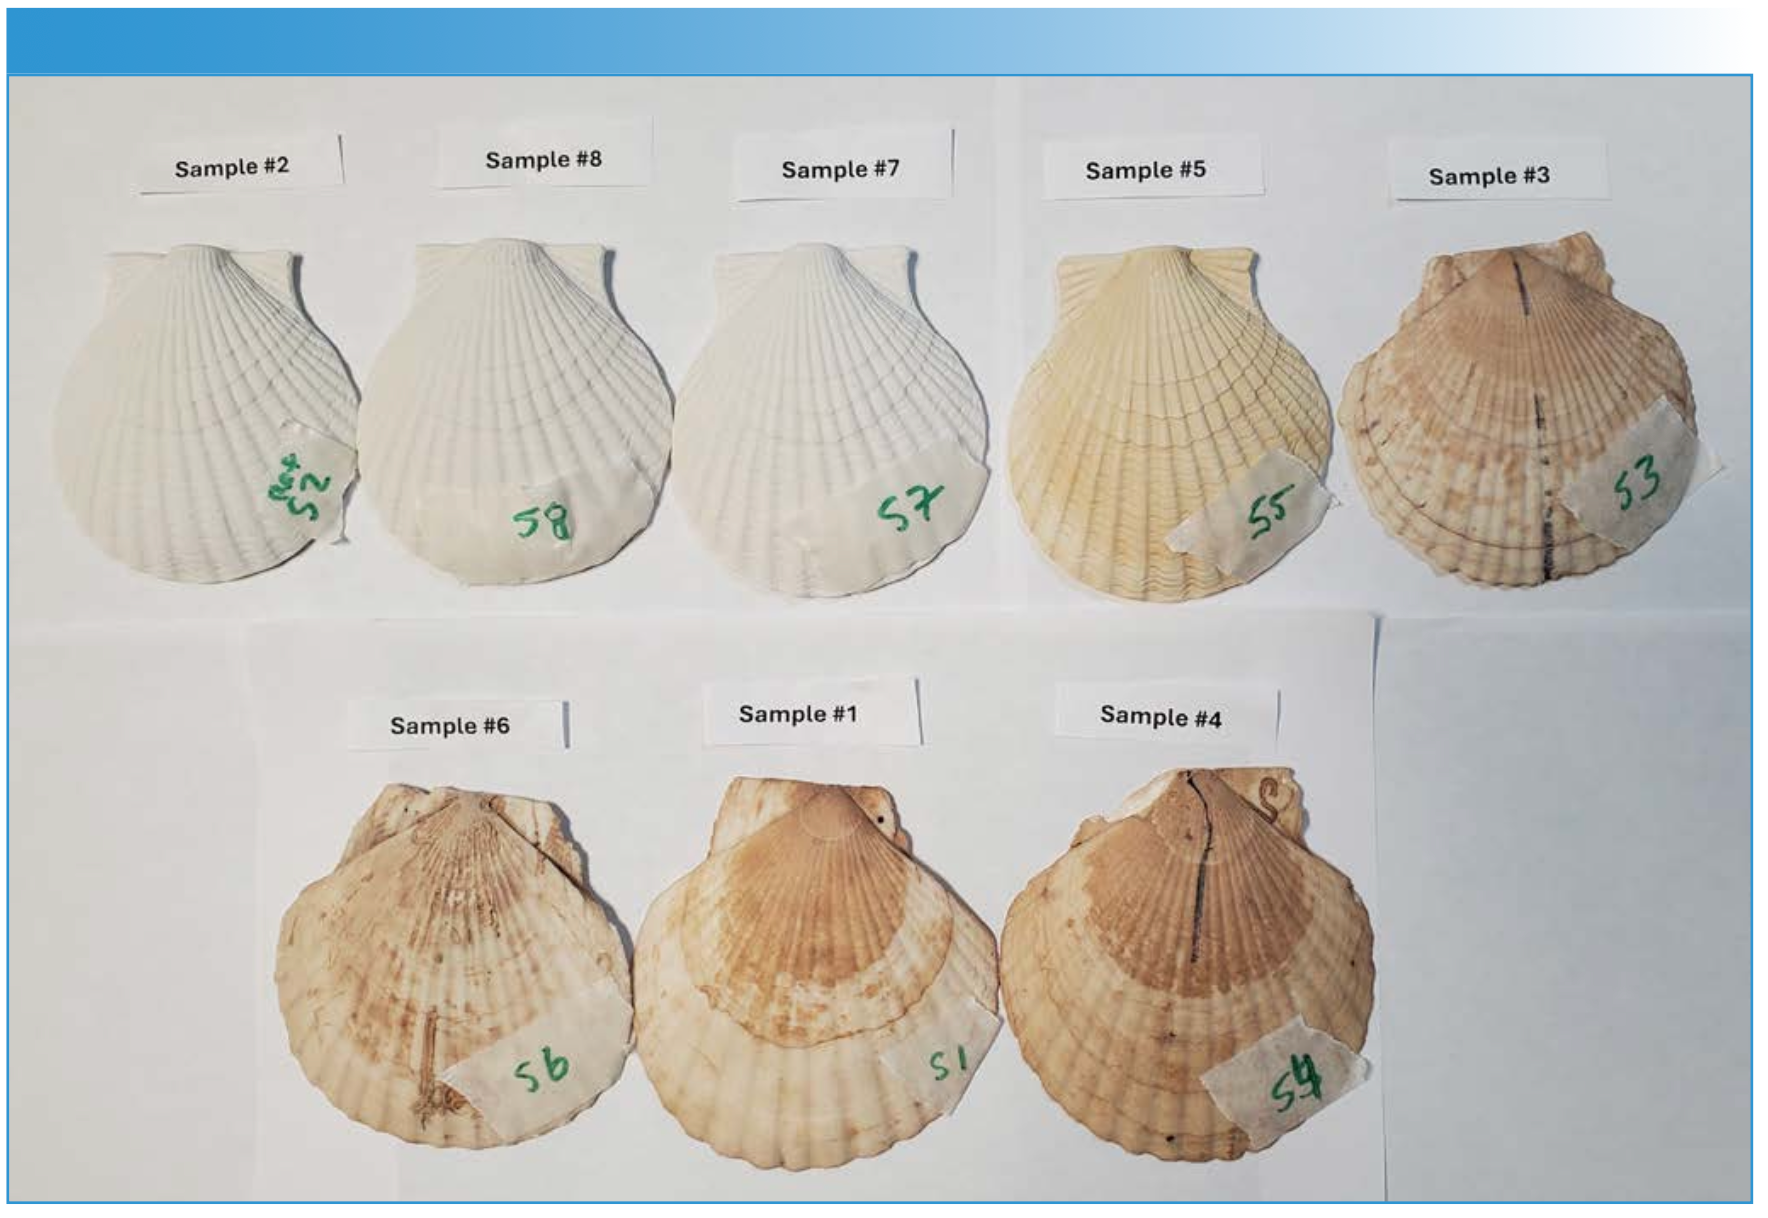
The seashells used in these experiments were 3.5 to 4 in. white natural scallop shells, readily available from Amazon. The set of samples used in this study included three (3) measured “as is” with no exposure to tannins.The other five (5) shells were soaked for an increasing amount of time in a solution of tannins extracted from tea bags in hot water.The tea-stained shells were air-dried for several days before analysis (see Figure 1).
FIGURE 1: White and stained seashells used in the study.

Spectral transmission data were collected using a B&W Tek Questä X high-performance low stray light CCD Spectrometer. The spectrometer is configured with a 600 groove per mm grating to achieve a wavelength range between 350 nm and 1050 nm. It is also installed with a 25 µm slit to achieve a spectral resolution of ~1.5 nm across the sensitive range.A broadband Tungsten/Halogen source is used for illumination. The experimental setup is shown in Figure 2. A diffuse reflectance probe with a 24-inch 400 µm diameter multicore fiber was connected to the spectrometer and light source. A ring stand was used to eliminate movement during data collection. The collection angle was fixed at roughly a 45o angle to maximize light collection.Data was collected using the BWTEK software. The scan time for each measurement was nine milliseconds, with 100 scans collected for each measurement. Three replicate measurements were obtained from each sample.
FIGURE 2: Experimental setup for fast measurement of sea-shell surface color by diffuse reflectance.

The spectra were saved as *.spc files and imported directly into Thermo-Fisher Scientific Galactic’s Grams AI software version 9.3 (Thermo-Fisher Scientific Inc, Waltham, MA). The Color.ab program in Grams AI software was used to determine the CIE chromaticity XYZ values, and corresponding CIE Lab color metrics for a D65 illuminant and a 10o observer angle. Using Grams AI software, the raw transmission spectra were converted to absorbance spectra; Abs=Log (1/R).The AUC (area under the curve), or peak area, was determined from the absorbance spectra using the integration algorithm in Galactic Grams software in the same region used for CIE Lab determination (i.e., 400 nm to 700 nm). A single-point baseline offset was applied to fix the lowest absorbance band to zero before integration. The integration of area was determined using the “Sum” method. In this approach, the individual absorbance values from 400 to 700 nm are summed to determine the peak area.
Each spectral replicate was subjected to post-analysis software, and the averaged results are reported herein.
Results and Discussion
Transmittance Spectra
Figure 3 shows the raw spectral data plotted in % transmittance units (y-axis) versus wavelength (x-axis). The spectral transmission sequentially declines in the region from 400 nm to 500 nm from a high near 60% T (unstained white Shell #7) to a low of about 20% T (stained Shell # 4) and in general as the seashells become increasingly darker with tannin stains.
FIGURE 3: Transmittance vs wavelength with increasing pigment concentration in solution.

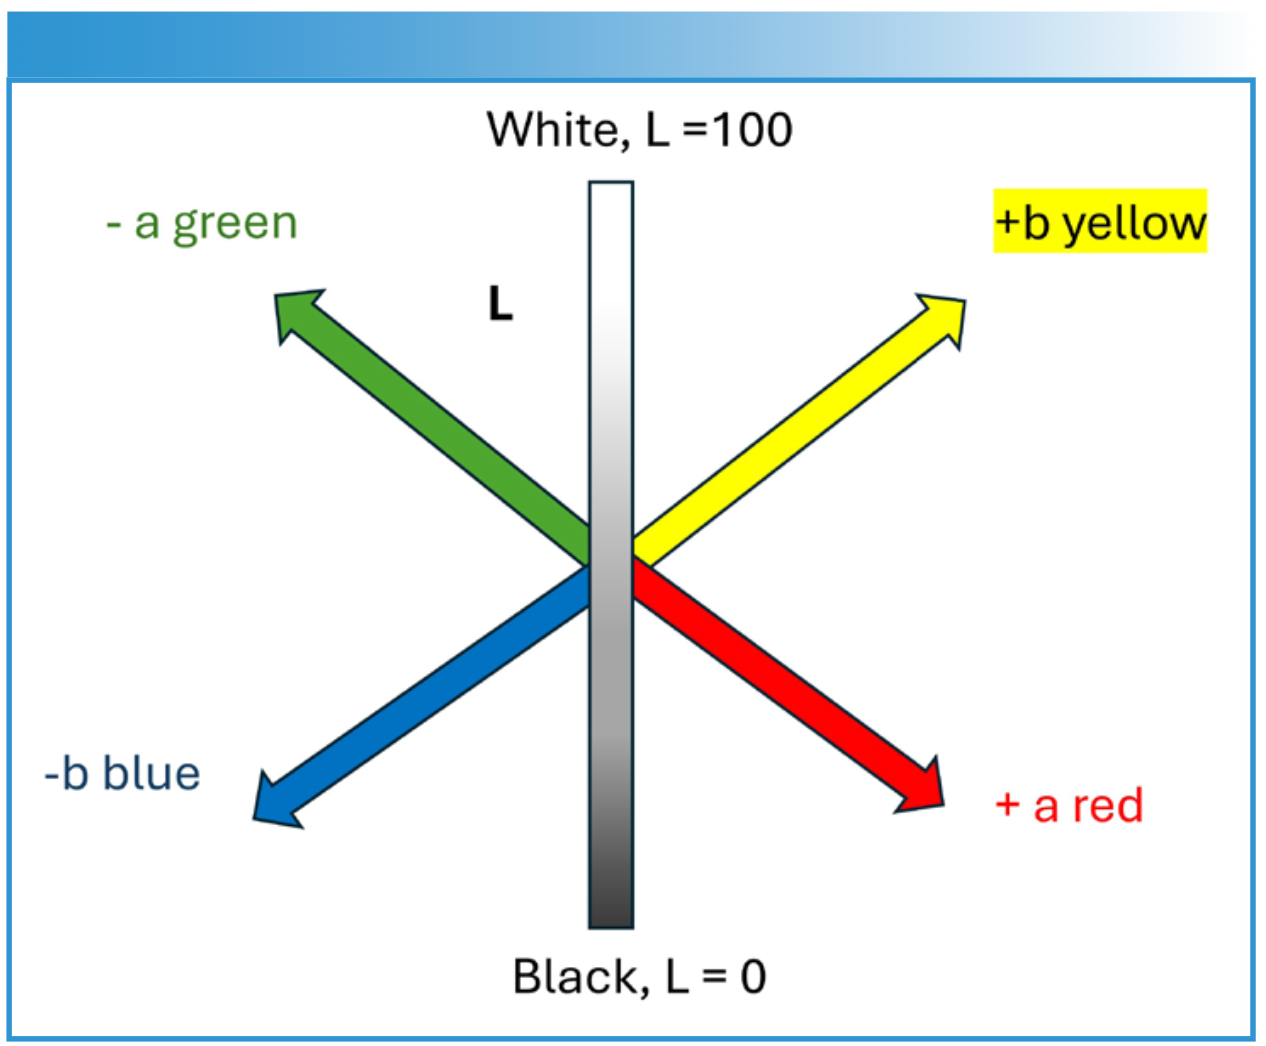
Using the transmittance spectra, the Color.ab program converted the spectral fingerprint from 400 to 700 nm to CIE XYZ chromaticity values. These can be further transformed into common color spaces, such as the CIE Lab parameters that describe how humans perceive color (1-5). Figure 4 depicts the CIE Lab color space. Green objects will have a negative a* value, and red objects will have a positive a* value. Yellow objects will have a positive b* value, and blue objects will have a negative b* value.The hue for materials that make up a mixture of colors is described using a combination of a* and b* values.L describes the degree of whiteness or lightness; ranging from 100 for pure white to 0 for pure black. Thus, as a sample becomes darker in color, the L value will decline. When describing the color of objects, the color temperature of the illumination source and angle are always specified.
FIGURE 4: CIE L*a*b* Color Space depicting range in variables. Source: Deborah Peru.

The yellowness index (Y), defined in ASTM E313-20, was determined for illumination D65 and a 10o observer angle (6).

Cx and Cz are the coefficients used, 1.3013 and 1.1498, respectively (6). A shell with a positive (+ Y) yellowness index describes the presence and magnitude of yellowness. In contrast, a shell sample with a negative (- Y) yellowness index will appear white or sometimes bluish in color.
Comparison of Color Metrics with Peak Area
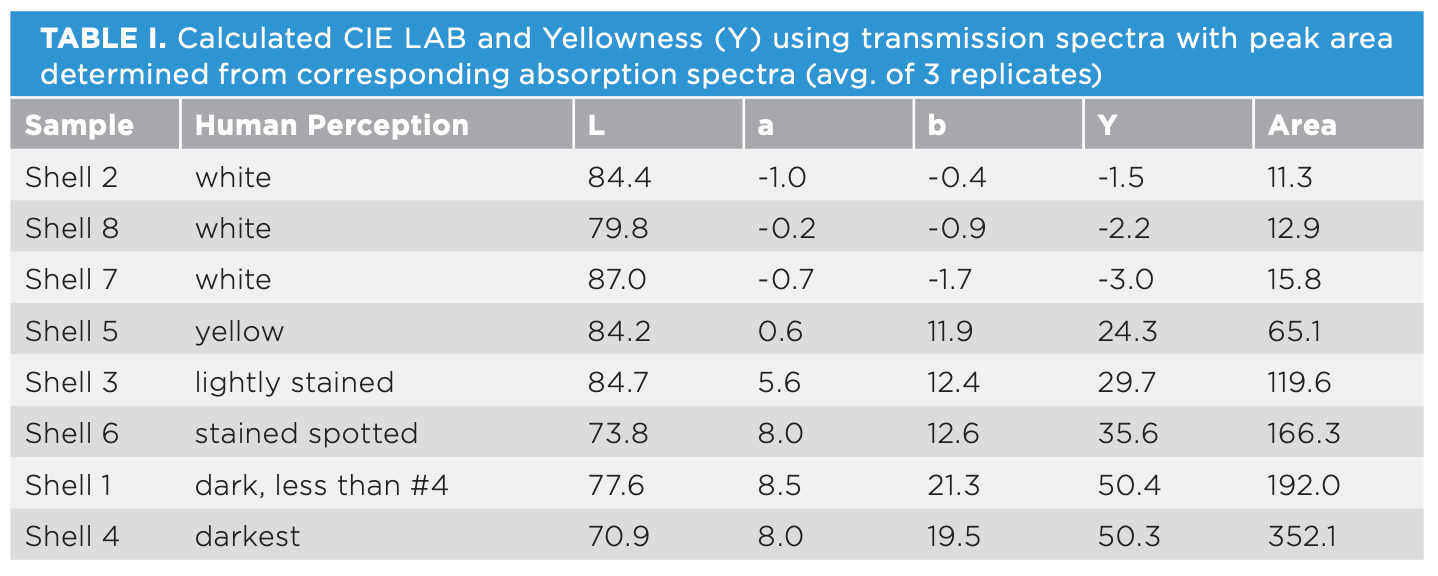
Table I lists the averaged CIE LAB parameters and yellowness index obtained from the transmittance spectra, peak area obtained from the corresponding absorbance spectra, and human perception of color.The integrated peak area shown in Table I directly correlates to chromophore concentration according to Beer’s Lambert Law (Abs = 𝜀lC) and forms the basis for tracking relative change in chromophore concentration in material. 𝜀 is an intrinsic property of each material to absorb light at each specific wavelength used in the integration range. l refers to pathlength, and C describes the total concentration of the chromophores absorbing in the 400 to 700 nm region. As the shell color darkens, the yellowness index, CIE a and b values, and peak area all increase in value, while the L value declines.

Sensitivity of Peak Area
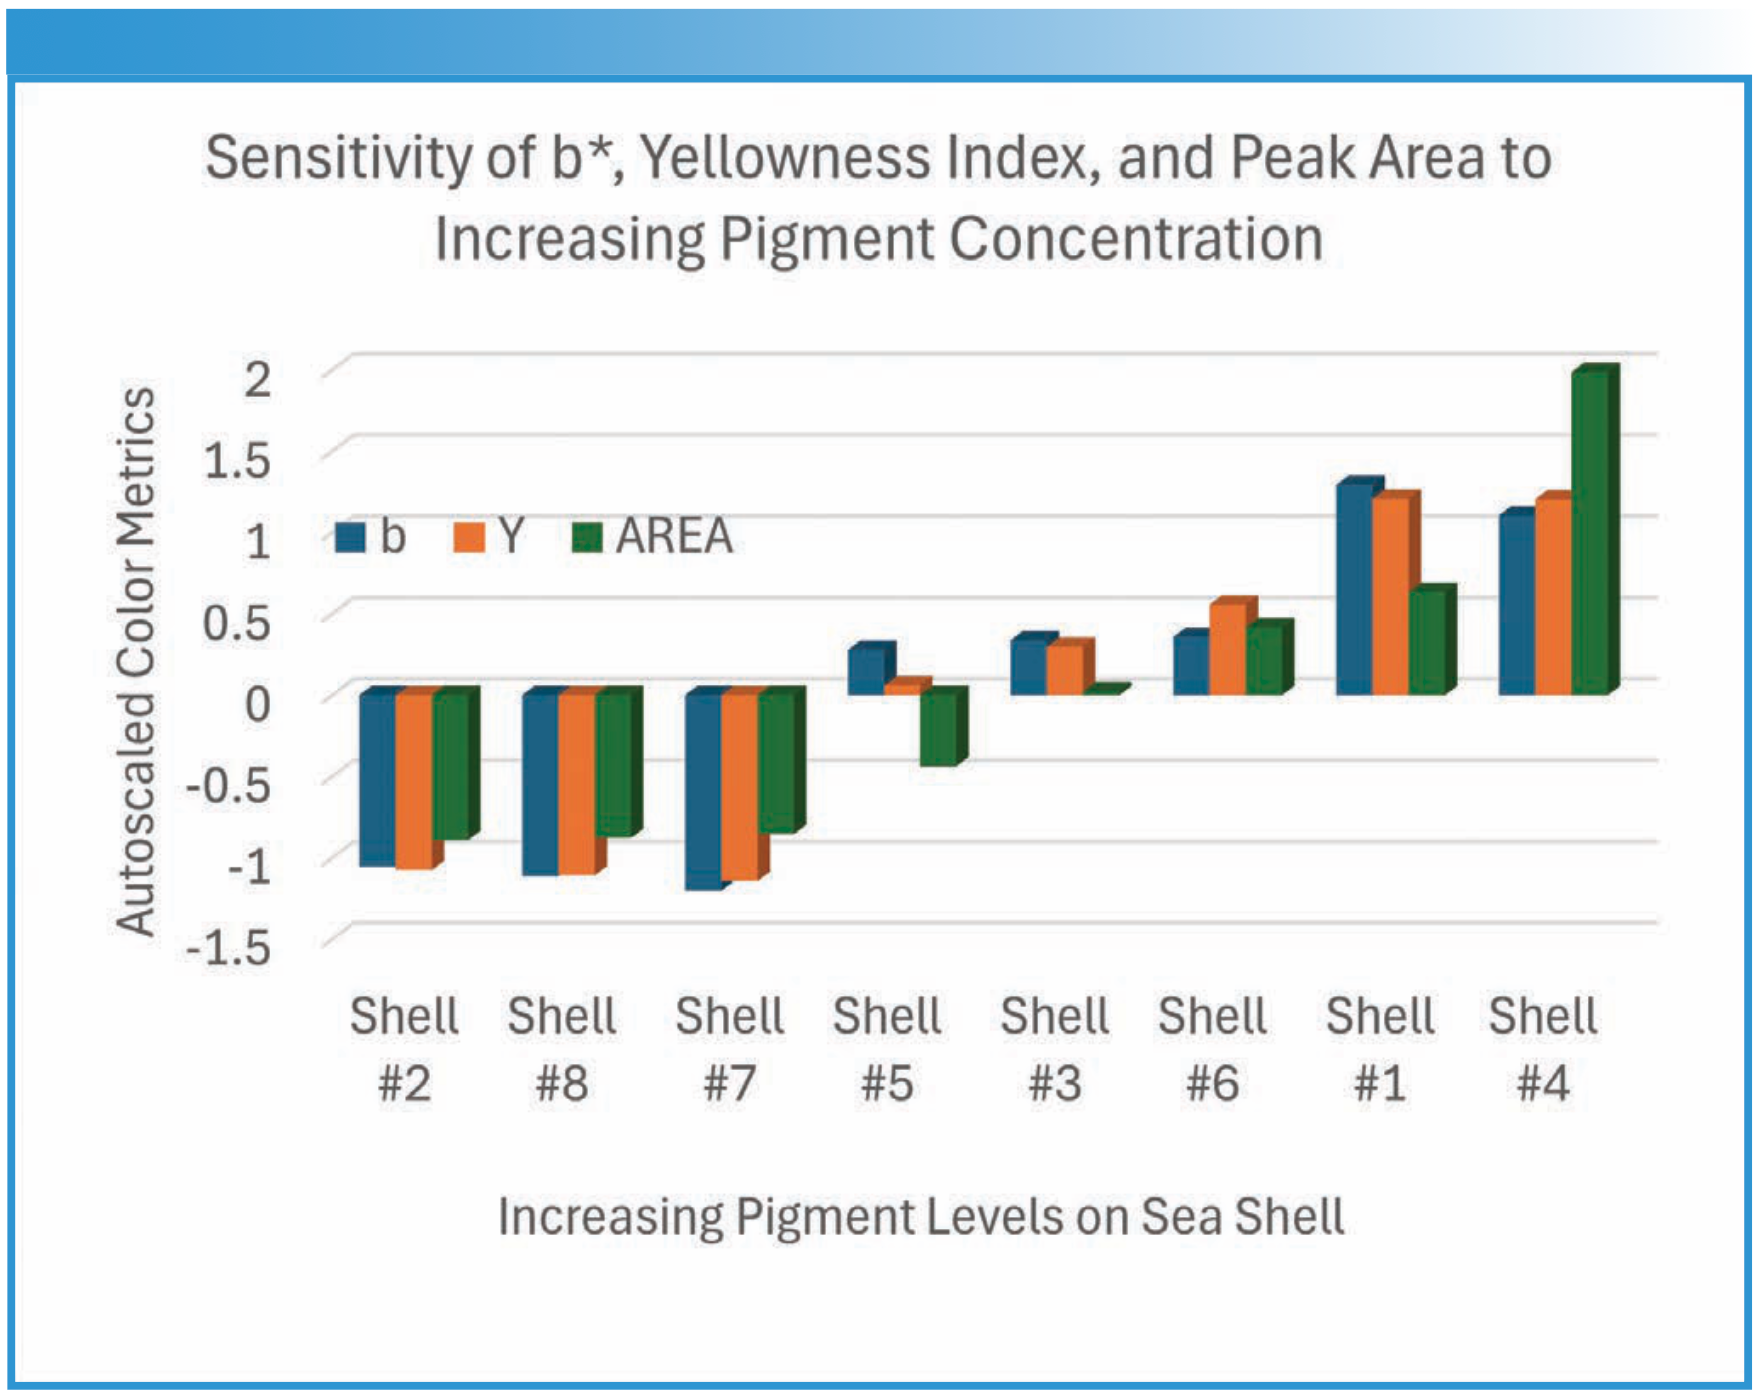
With increasing visual perception of the seashell discoloration, the seashells' peak area markedly increases, as shown in Figure 5. The bar plot demonstrates improved sensitivity in using the peak area value compared to tracking, the CIE b value, and the yellowness index with staining. To eliminate scale differences, these color metrics were autoscaled to allow for a more direct comparison of the results. This involves mean-centering each sample variable by subtracting the variable mean for the eight-sample set, followed by standardization (division by the standard deviation). The unstained white shells #2, #8, and #7 had similar values for all color parameters. As expected, the CIE L declines in value with darkening but shows a higher L value (whiter) color for Shell #1 than Shell #6, which does not agree with the observed color difference. The L values also display some inconsistency in magnitude for the white untreated seashells.
FIGURE 5: Change in CIE b*, yellowness (Y), peak area (AUC), and CIE L with increasing pigment staining. Values are autoscaled to permit display on the same axis.

In contrast, the peak area method provides greater quantitative separation between Shell #1 and Shell #4 than the individual CIE b and the yellowness index values and agrees well with the perceived differences observed in color ranking. The AUC calculation in the visible region provides another way to dimensionalize the color of products beyond the CIE Lab scale, yellowness index, or whiteness index (not used in this study). This study demonstrates the usefulness of using peak area analysis of spectra to obtain relative concentration information for color differences and stains on the surface of a solid substrate. The technique can also be applied to other product forms measured in reflectance or transmission modes.
Conclusion
The UV-vis-NIR diode-array spectrometer has demonstrated excellent performance in determining color differences among these seashell samples. While the instrument is lightweight and compact, it has a surprisingly fast analysis time while maintaining superb sensitivity, reproducibility, and spectral quality. Various sampling accessories are available for lab applications, pilot plants, and manufacturing environments.The system can be configured for multiple applications, and the data collected is compatible with third-party spectral analysis software packages. The methodology is useful for quantitative product claims and performance tracking.
In this study, we compared the determination of CIE Lab and yellowness index with peak area integration. For quantitative applications, the peak area method provides a higher degree of sensitivity and separation in sample color that agrees well with the perceived difference. This approach can quantify the relative differences among samples at different time points, after treatment, for product claims, and for improved quality or product optimization.
References
- Gilchrist, A., Nobbs, J. (2000). Colorimetry, Theory.In Encyclopedia of Spectroscopy and Spectrometry. Academic Press, 2000; pp 328–333.
- CIE Standard Observers and calculation of CIE X, Y, Z color values. 2022. duplicate-of-an-1002.01-standard-observer.pdf (hunterlab.com). Hunter Lab AN 1002.00. (accessed 2024-03-22).
- ASTM International Standard Practice for Computing the Colors of Objects by Using the CIE System. E308‐18; West Conshohocken, PA, 2001. DOI: 10.1520/E0308-22.
- Westland, S. The CIE System. In: Handbook of Visual Display Technology. Springer, Cham. 2016; pp 161–169.
- Precise Color Communication. Konica Minolta. color_communication.pdf (konicaminolta.com) (accessed 2024-08-31).
- ASTM International. Standard Practice for Calculating Yellowness and Whiteness Indices from Instrumentally Measured Color Coordinates. ASTM E313-20; West Conshohocken, PA, 2020. DOI: 10.1520/E0313-20.
NIR Spectroscopy Explored as Sustainable Approach to Detecting Bovine Mastitis
April 23rd 2025A new study published in Applied Food Research demonstrates that near-infrared spectroscopy (NIRS) can effectively detect subclinical bovine mastitis in milk, offering a fast, non-invasive method to guide targeted antibiotic treatment and support sustainable dairy practices.
New AI Strategy for Mycotoxin Detection in Cereal Grains
April 21st 2025Researchers from Jiangsu University and Zhejiang University of Water Resources and Electric Power have developed a transfer learning approach that significantly enhances the accuracy and adaptability of NIR spectroscopy models for detecting mycotoxins in cereals.
Karl Norris: A Pioneer in Optical Measurements and Near-Infrared Spectroscopy, Part II
April 21st 2025In this two-part "Icons of Spectroscopy" column, executive editor Jerome Workman Jr. details how Karl H. Norris has impacted the analysis of food, agricultural products, and pharmaceuticals over six decades. His pioneering work in optical analysis methods including his development and refinement of near-infrared spectroscopy, has transformed analysis technology. In this Part II article of a two-part series, we summarize Norris’ foundational publications in NIR, his patents, achievements, and legacy.
New Study Reveals Insights into Phenol’s Behavior in Ice
April 16th 2025A new study published in Spectrochimica Acta Part A by Dominik Heger and colleagues at Masaryk University reveals that phenol's photophysical properties change significantly when frozen, potentially enabling its breakdown by sunlight in icy environments.