Confocal Raman Microscopy in Forensic Pharmaceutical Investigations
Confocal Raman microscopy can identify particles in the 5–50 ?m range and can bridge the gap between micro-FT-IR and SEM-EDS analyses.
Scanning electron microscopy with energy dispersive X-ray spectrometry (SEM-EDS) and Fourier-transform infrared microspectrophotometry (micro-FT-IR) have been widely demonstrated as complementary analytical tools for the identification of complex mixtures and unknown materials. However, there is a gap between the information provided by these two techniques. Even though elemental and morphological information is obtained on small single particles with SEM-EDS technology, no molecular or structural information is available. Likewise, although chemical information can be acquired using FT-IR, analysis of small single particles is significantly limited. We applied confocal Raman microscopy (CRM) in our laboratory to bridge the gap between FT-IR and SEM, and it provided chemical and vibrational information on a scale approaching the resolution of an SEM. In one application, monomer solutions used during a contact lens manufacturing process exhibited haze that was related to particulate contamination. The particles were isolated and analyzed by CRM, SEM, and micro-FT-IR. The particle size range was about 1–500 µm. Particles <50 µm were analyzed and identified by Raman spectroscopy and SEM. Particles >50 µm were analyzed and identified by micro-FT-IR and SEM. Numerous materials associated with the manufacturing process of the monomer were identified, as well as foreign materials. The identification of the particulate materials causing the haze of the monomer assisted the manufacturer in determining the sources of the contamination and improving the quality of the product.
Raman spectroscopy is an ideal technique for analyzing product contaminants. Many materials can be identified by their Raman spectra, including minerals, dyes and pigments, polymers, and drugs. Raman microscopy has high spatial resolution, excellent sensitivity, and can quickly obtain spectral data. The technique often requires little-to-no sample preparation, and it is possible to collect spectra of materials through glass, plastics, and aqueous solutions. The ability to acquire spectral data without sample preparation limits accidental contamination and loss of the particle or material of interest (1). The technique is nondestructive in most applications. Confocal Raman microscopy (CRM) is especially useful for obtaining depth profiles (x–z scans) without conventional cross-sectioning of the samples (2–4). The ability to obtain vibrational spectra of small particles (<1–50 µm) complements the data obtained by the more traditional techniques of micro Fourier-transform infrared (micro-FT-IR) and scanning electron microscopy with energy dispersive X-ray spectrometry (SEM-EDS) (5–7). Raman spectroscopy is a particularly useful method for applications in the pharmaceutical, biomedical device, and consumer health products industries.
Janet Woodcock's article "The Concept of Pharmaceutical Quality" describes the Food and Drug Administration's (FDA) perspective on the quality of pharmaceuticals and highlights the efforts and financial resources invested to protect the health and safety of consumers (8). Forensic investigations in the pharmaceutical industry began with examinations of counterfeit and adulterated drug products (9,10). This area now extends to quality-related issues in manufacturing processes, including consumer health products, drug tablets and capsules, implantable medical devices, surgical equipment and supplies, and ophthalmic lenses.
Monomer solutions are used in a variety of applications, including hard and soft contact lenses; a novel application reported in the literature is the use of contact lenses for delivery of controlled release drugs directly to the eye (11). Contamination of the monomer may reduce biocompatibility and permeability of the lens. Not only is the biocompatibility of the polymer important, it also must be produced in such a way that any residual monomer or solution does not pose a health risk (12). In general, high quality, inclusion-free polymers are equally important to all industries where a transparent polymer is required. Depending on the application, inclusions may result in reduced visibility and unintentional reflection or refraction of light.
In a recent case, inspection of monomers intended for use in the production of lenses revealed hazy solutions. These monomers did not meet the standard criteria for the final product manufacture, which requires a colorless, transparent polymer lens. MVA Scientific Consultants (Duluth, Georgia) was asked to investigate the nature of the haze in the monomer and intermediate product solutions and determine the source of the problem. The monomer is a proprietary formula consisting of multiple components, including but not limited to, silicone, fluoropolymer, organotin, acrylic, and isocyanate compounds.
This article describes the use of confocal Raman microscopy for the identification of particles in the 5–50 µm range and illustrates how it bridges the gap between micro-FT-IR and SEM-EDS analyses. The use of these complementary techniques in the pharmaceutical and allied industries is widely reported in the literature, especially for analyses and identification of small particles (6,7,10,13–16).
Experimental
Preliminary examination of the monomer solutions and particulate material was conducted using a Zeiss Stemi-C2000 stereomicroscope (Carl Zeiss Microscopy, Thornwood, New York) with a magnification range of 6.5–47×. The monomer solutions were filtered in an ISO Class 5 clean bench for isolation of particulate material using GE Water and Process Technologies (Trevose, Pennsylvania) 47-mm diameter, 0.8-µm pore size, polycarbonate track etch membrane filters. The filters were rinsed with prefiltered (0.2 µm) ethanol. Ethanol blanks and controls were prepared and examined with each sample set to ensure no introduction of significant particulate material during sample preparation. Representative particles were selected using fine tungsten microtools for analyses by micro-FT-IR, SEM-EDS, and CRM.
Micro-FT-IR analyses were conducted with a SensIR IlluminatIR Fourier transform infrared spectrophotometer (Smiths Detection, Danbury Connecticut, formerly SensIR Technologies, Danbury, Connecticut) coupled to an Olympus BX-51 compound microscope (Olympus America, Center Valley, Pennsylvania). Spectra were collected using a 50- or 100-µm aperture, a spectral resolution of 4 cm-1 , 128 scans, and either an all reflecting objective (ARO) or an attenuated total internal reflectance (ATR) objective.
JEOL JSM-6400 and JSM-6500F scanning electron microscopes (JEOL USA, Inc., Peabody, Massachusetts) with Noran energy dispersive X-ray systems (Thermo Scientific Noran, Madison, Wisconsin) were used for SEM-EDS analyses.
Raman spectra were obtained using a WITec (Maryville, Tennessee) alpha 300R confocal Raman microscope with a 532-nm excitation wavelength laser (NdYAG). Images of the particles were obtained before analyses. Typical spectra were collected using a 20× Nikon or a 100× Olympus objective, a 0.1-s integration time, and 100 accumulated scans. The spectrometer grating used was 600 grooves/mm. Both Raman and FT-IR spectra were processed using Thermo Electron Grams AI software (Thermo Fisher Scientific, Madison, Wisconsin).
Results and Discussion
Visual Inspection
More than 20 samples of the monomer solutions were received. The solutions were visually inspected and ranked based on the level of visual clarity and haziness. Preliminary examination suggested the haze was caused by particles in the solutions. Representative samples of the least and most hazy solutions were selected for analyses. Figure 1 shows the representative samples.
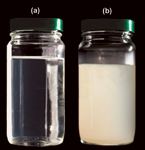
Figure 1: (a) Clear (least hazy) transparent monomer solution; (b) haziest monomer solution.
The two solutions were filtered and particles were retained on the filter membranes, as shown in Figure 2. The predominant particles recovered from the hazy solution had a size range of approximately 20–500 µm. Stereoscopic examination of the filters revealed fine, white-to-colorless particles; opaque-to-transparent flakes and ribbons; brown, red, and orange-yellow particles; colorless, red, tan, and blue fibers; and large fibrous masses.

Figure 2: Photomicrographs showing isolated particulate materials on filter membranes from (a) least hazy solution and (b) haziest solution.
Examination of Particulate Isolated from the Least Hazy Solution
Particles from the least hazy monomer solution ranged in size from about 25 to 150 µm and were primarily clear or colorless and opaque or white. The approximate total weight percent of particulate (post-sampling) isolated from this sample was 0.001%. SEM analysis revealed that most of the particles had a bumpy, textured surface (Figure 3a). The elemental composition of a typical particle (Figure 3b) is consistent with components of the monomer solution including the fluoropolymer and silicone compounds with traces of the organotin compound and other inorganic salts. Analysis by Raman microscopy confirmed highly textured surfaces; a representative image is presented in Figure 4a. The Raman spectra suggested the particles were composed of silicone compounds and fluoropolymer with traces of an isocyanate compound (Figures 4b and 4c) — all components of the monomer solution.

Figure 3: (a) SEM image of bumpy, textured particle isolated from least hazy monomer solution; (b) EDS spectrum from particle shown in (a).

Figure 4
Examination of Particulate Isolated from the Haziest Solution
Several clear or colorless and opaque or white particles in the 20–200 µm range were isolated from the haziest solution for evaluation. The approximate total weight percent of particulate (post-sampling) isolated from this sample was 0.004%. Examination of the 20–200 µm isolated particles by SEM revealed that most were composed of small bead-like features held together by a gelatinous material (Figure 5a). EDS analysis of these particles yielded elemental compositions rich in carbon, oxygen, silicon, and fluorine, with traces of calcium, sodium, and tin present (Figure 5b). Confocal Raman microscopy was used to characterize the small bead-like particles within the gelatinous matrix, many of which were <5 µm in diameter. This technique was especially effective because it allowed us to focus directly on the beads without further isolation from the gelatinous material. A representative particle exhibiting bead-like features is shown in the micrograph presented in Figure 6a; the corresponding Raman spectrum acquired from the marked location is shown in Figure 6b. Matching this Raman spectrum to spectral databases revealed the beads were consistent with a polystyrene-like material (Figure 6b). Raman spectral analysis of the gel-like matrix and colorless irregular shaped particles revealed mixtures of the components in the monomer solution, primarily fluoropolymer, silicone, and isocyanate (Figures 6c and 6d). The peaks at 997 cm-1 and 1602 cm-1 in Figure 6c suggest a trace of a polystyrene-like compound also may be present.
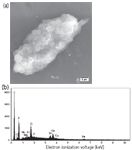
Figure 5: (a) SEM image of clear or colorless particle from the haziest monomer solution exhibiting bead-like features in a gel matrix; (b) EDS spectrum from particle indicates it is carbon (C), oxygen (O), fluorine (F), and silicon (Si) rich.
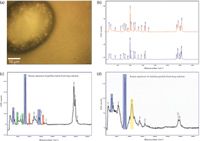
Figure 6
Extraneous materials were identified by micro-FT-IR and Raman spectroscopy. The FT-IR spectrum of a 70-µm clear particle indicated that the particle was a polyether ether ketone (PEEK) polymer (Figure 7a). Another clear particle was characterized as an inorganic carbonate by FT-IR spectroscopy and is presented in Figure 7b. Analysis of white particles by Raman spectroscopy with spectral matching revealed an acrylic polymer consistent with Carboset (Lubrizol Advanced Materials, Inc., Wickliffe, Ohio) products. Representative Raman spectra are presented in Figure 7c. Other extraneous materials identified by light microscopy, FT-IR, and Raman spectroscopy included skin flakes, cellulose particles and fibers (paper, cotton), polyethylene, and poly(tetrafluoroethylene) or PTFE.

Figure 7
Examination of Raw Materials, Intermediate Product, and Process Solvent
To trace the origin of the particles causing the haziness of the monomer solutions, the raw materials and processing solvent were evaluated. A sample of an intermediate product of the polymer (that is, a prepolymerized, viscous liquid that had not yet been cross-linked) also was provided. Evaluation of the Raman and FT-IR spectra obtained from the starting materials, the methyl ethyl ketone processing solvent, the monomer solution, and the prepolymerized intermediate product revealed spectral peaks that could be used as markers for identification of these compounds in particles isolated from the monomer solutions. The spectra obtained from the intermediate product and the monomer solutions were quite similar and distinctions between the two were based on subtle variations of the contributions of the two isocyanate compounds. When identifying particles, the distinction between the monomer and intermediate product is not made, so both are referred to as monomer. The key peak positions for the raw materials, methyl ethyl ketone solvent, intermediate product, and monomer are provided in Table I.

Table I: Raman peak frequencies (cm-1) of monomer and raw materials
Dilution of the viscous intermediate product solution with methyl ethyl ketone, followed by filtration, yielded clear or colorless and opaque or white particles that ranged in size from approximately 20 to 400 µm. Representative particles were selected for analysis by FT-IR, Raman microscopy, and SEM-EDS. FT-IR analyses of selected particles revealed materials associated with the monomer components, primarily fluoropolymer and silicone. Both surface texture and the elemental composition were evaluated by SEM-EDS. The data indicate bumpy, textured particle morphologies mainly composed of carbon, oxygen, silicon, and fluorine. Raman analyses showed that most of the particles were mixtures of the monomer components, primarily the fluoropolymer and isocyanate. (These data are consistent to the spectra presented in Figures 4, 6c, and 6d.)
Extraneous materials recovered from the viscous intermediate product following dilution with methyl ethyl ketone were identified by SEM-EDS and Raman microscopy. A representative 300-µm opaque or white particle was selected for analysis by SEM-EDS; the elemental composition is consistent with silicon. One 70–80 µm clear or colorless particle yielded a Raman spectrum consistent with an acrylic material, such as the Carboset acrylic material previously observed. An opaque or white particle exhibiting a bumpy, textured surface is shown in Figure 8a. The Raman spectrum of this particle indicates it is a mixture of fluoropolymer, residual monomer or intermediate product, and a polystyrene-like compound (Figure 8b).
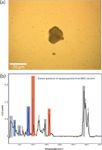
Figure 8
The results of the preparation of the intermediate with methyl ethyl ketone led to the investigation of the methyl ethyl ketone solvent as a potential source of the polystyrene-like material. Evaporation of the methyl ethyl ketone yielded insufficient residue for analyses. A small volume (2 mL) of remaining methyl ethyl ketone solvent was mixed with particle-free deionized water to reduce the solubility of any polystyrene, if present, in the solvent. During the addition of the water to the methyl ethyl ketone, a small amount of white residue was observed forming on the container walls, immediately above the liquid level. Evaporation of the methyl ethyl ketone and water blend yielded additional white residue for evaluation. However, the overall residue collected was minimal; the amount was estimated to be in the microgram range based on the overall weight percents of particulate collected from the monomer solutions and volume of methyl ethyl ketone used for the dissolution and evaporation study. FT-IR and Raman spectroscopy were used for analyses of the white residue and yielded spectra that suggested polystyrene or a related aromatic impurity was present in the methyl ethyl ketone solvent. The FT-IR spectra are presented in Figure 9a, and the corresponding Raman spectra are shown in Figure 9b.

Figure 9
Conclusion
Analyses of monomer and intermediate product solutions exhibiting particulate materials led to the evaluation of the raw materials and processing solvents as potential sources of extraneous particles. Most of the particles in the least hazy solution were determined to be related to the starting materials used in the formulation. Results indicated that most of the particles were mixtures of monomer components. Extraneous materials not related to components of the monomer were also identified.
Differences between the least hazy and haziest monomer solutions were primarily due to the presence of 2–10 µm polystyrene beads encapsulated in gel-like aggregated clumps of mixtures of the monomer components in the haziest solution. These individual polystyrene beads were identified using the high spatial resolution capabilities provided by CRM. The polystyrene-like component was rare or absent in the least hazy solution. The polystyrene contamination was traced back to the methyl ethyl ketone solvent. Although FT-IR spectroscopy suggested polystyrene might be present, Raman microscopy provided supporting results indicating the presence of a polystyrene-like material; detection of small particles of extraneous polystyrene-like material demonstrates the advantages achieved with confocal Raman microscopy.
The use of FT-IR and Raman spectroscopy along with SEM-EDS provided complementary analytical results to solve a challenging quality control problem during a contact lens manufacturing process. Identification of the particulate materials causing the haze of the monomer, as well as the source of it, assisted the manufacturer in improving the quality of the product.
Mary A. Miller, Michelle R. Cavaliere, Ming Zhou, and Pronda Few are with MVA Scientific Consultants in Duluth, Georgia. Direct correspondence to: mmiller@mvainc.com.
References
(1) E. Caudron, A. Tfayli, C. Monnier, M. Manfait, P. Prognon, and D. Pradeu, J. Pharm. Biomed. Anal. 54, 866–868 (2011).
(2) T. Vankeirsbilck, A. Vercauteren, W. Baeyens, and G. Van der Weken, Trends Anal. Chem. 21, 869–877 (2002).
(3) M. Miller, M. Cavaliere, and D. Drew, "Evaluation of Controlled Release Products by Light Microscopy, Scanning Electron Microscopy and Confocal Raman Microscopy," presented at 37th Annual Meeting and Exposition of the Controlled Release Society, Portland, Oregon, 2010.
(4) M. Cavaliere, M. Miller, and T. Vander Wood, "Microscopical Characterization of Controlled Release Pharmaceuticals: A Complementary Approach," proceedings of Microscopy and Microanalysis, Portland, Oregon, 2010. J. Shields, S. McKernan, J. Mansfield, B. Foran, J. Frafjord, D. Beniac, and D. O'Neil, Eds. (Cambridge University Press, New York, New York, 2010).
(5) M. Miller, "Identification of Impurities in a Pharmaceutical API: Is Meeting USP Compendial Testing Enough?," presented at the American Association of Pharmaceutical Scientists (AAPS) Annual Meeting and Exposition, Los Angeles, California, 2009.
(6) M.A. Miller and T.B. Vander Wood, "Microanalysis in the Pharmaceutical and Biomedical Industry," proceedings of Microscopy and Microanalysis, San Antonio, Texas, 2003; D. Piston, J. Bruley, I.M. Anderson, P.Kotula, G. Solorzano, A. Lockley, and S. McKernan, Eds. (Cambridge University Press, New York, New York, 2003).
(7) T. Barber, Instrumental Analysis of Particulate Matter, in Liquid-and Surface-Borne Particle Measurement Handbook, J. Knapp, T. Barber, and A. Lieberman, Eds. (Marcel Dekker, New York, New York, 1996).
(8) J. Woodcock, Amer. Pharma. Rev. 7, 10–15 (2004).
(9) N. Macleod and P. Matousek, Pharm. Res. 25, 2205–2215 (2008).
(10) M. Witkowski, Amer. Pharma. Rev. 8, 1–5 (2005).
(11) C. Alvareze-Lorenzo, H. Haruyuki, and A. Concheiro, Amer. J. Drug Deliv. 4, 131–151 (2006).
(12) J. Bergin, "Contact Lens Polymers: A Technical Overview of the Development, Manufacturing, and Future of Contact Lenses," presentation from Introduction to Polymers Course, State University of New York at Buffalo, Buffalo, New York, 2000.
(13) D. Alonso, "Microscopy Techniques in Pharmaceutical and other Manufacturing Industries," proceedings of Microscopy and Microanalysis, Honolulu, Hawaii, 2005. R. Price et al., Eds. (Cambridge University Press, New York, New York, 2005).
(14) D.S. Aldrich, "Particulate Matter in Air and in Liquids- Isolation, Quantitation and Identification Considerations," proceedings of Microscopy and Microanalysis, Honolulu, Hawaii, 2005. R. Price et al., Eds. (Cambridge University Press, new York, New York, 2005).
(15) G. Torraca and Z. Wen, "Forensic Investigation of Biopharmaceutical Manufacturing Incidents by Light Microscopy, FT-IR Microscopy, Scanning Electron Microscopy and Energy Dispersive X-ray Spectrometry," proceedings of Microscopy and Microanalysis, Honolulu, Hawaii, 2005. R. Price et al., Eds. (Cambridge University Press, New York, New York, 2005).
(16) F. Adar, G. leBourdon, J. Reffner, and A. Whitley, Spectros. 18(2), 34–40 (2003).

AI-Powered SERS Spectroscopy Breakthrough Boosts Safety of Medicinal Food Products
April 16th 2025A new deep learning-enhanced spectroscopic platform—SERSome—developed by researchers in China and Finland, identifies medicinal and edible homologs (MEHs) with 98% accuracy. This innovation could revolutionize safety and quality control in the growing MEH market.
New Raman Spectroscopy Method Enhances Real-Time Monitoring Across Fermentation Processes
April 15th 2025Researchers at Delft University of Technology have developed a novel method using single compound spectra to enhance the transferability and accuracy of Raman spectroscopy models for real-time fermentation monitoring.
Nanometer-Scale Studies Using Tip Enhanced Raman Spectroscopy
February 8th 2013Volker Deckert, the winner of the 2013 Charles Mann Award, is advancing the use of tip enhanced Raman spectroscopy (TERS) to push the lateral resolution of vibrational spectroscopy well below the Abbe limit, to achieve single-molecule sensitivity. Because the tip can be moved with sub-nanometer precision, structural information with unmatched spatial resolution can be achieved without the need of specific labels.