Classical Least Squares, Part VIII: Comparison of CLS Values with Known Values
The series on classical least squares continues with a comparison of experimental results and theoretical expectations.

A comparison of the experimental results to the theoretical expectations showed appreciable discrepancies. We consider possible problems in the execution of the experiment as the cause of these discrepancies.
This column is an installment in a series of our discussion of the classical least squares (CLS) approach to calibration (1–7). Where do we stand as of now? At this point, we have developed the theory of the CLS approach to calibration (1,2), described the measurement procedures and the data (3,4), and shown that when we apply the mathematical theory to the data we can reconstruct the spectra of the mixtures (5).
However, the theory of CLS only considers the relationship of the spectrum of a mixture to the spectra of the components of that mixture; the theory tells us nothing about the relationship of the spectrum to other properties of the mixture. In particular, it is silent on the question of the concentrations of the various mixture components. The numerical results of the CLS calculations are fractions, each representing the fraction that each mixture component contributes to the total mixture spectrum.
Therefore, the remaining task is to verify whether the coefficients calculated for the spectra in fact represent the concentrations of the various components in the different mixtures. We begin this task by presenting the actual concentrations in the experimental mixtures made. The values in the experimental design, as we presented them in our May 2011 installment as Figure 5 (5), are the target values for the various mixtures comprising the design. The actual mixtures were made up gravimetrically to be close to the target values, but the true weight percentages were calculated from the actual weights of the various components added to the mixtures. Table I presents those actual values.
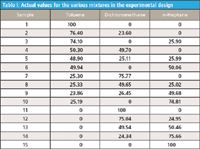
Table I: Actual values for the various mixtures in the experimental design
In our previous columns (5,6), we found that by computing the regression coefficients for the spectra of the pure components using the CLS algorithm and then applying those coefficients to those same pure component spectra, we were able to reproduce the spectra of mixtures of those materials very well. Our interest now is to ascertain whether the coefficients we calculated do, in fact, represent the concentrations of the corresponding materials.
Theoretically, any of the spectral regions having the absorbance bands that we previously noted should give equivalent results, the same results, and the correct results. It therefore makes sense to use both the entire spectral region we measured and each of the individual spectral regions that we previously separated out and plotted.
Table II presents the coefficients calculated from the various spectral regions for one of the ternary mixtures (25% toluene, 25% dichloromethane, and 50% n-heptane). We see that there is some variation in the percentage of each component calculated at the different wavelength ranges. Thus, we also calculated the mean percentage of each mixture component and include that as an entry in the table.

Table II: Results from sample with nominal composition: 25% toluene, 25% dichloromethane, 50% n-heptane. All tabled values are wt %.
By "splitting the difference" this way, we expect that the mean composition we calculate will be a better estimate of the "true" calculated value in any of the individual calculated values. We are now ready to present the results for all of the different mixtures that our experimental design specified. These are given in Table III, which also contains the actual gravimetric values for the composition. We use the term "actual" because even though the experimental design illustrated in Figure 5 of the May 2011 installment (5) specified the design points to use, the individual samples were made up according to the "dispense approximately and measure exactly" paradigm for preparing samples.
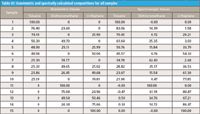
Table III: Gravimetric and spectrally calculated compositions for all samples
What do we observe in the results of Table III?
Although sporadic readings (such as toluene in sample 9) showed good agreement between the gravimetric and spectrally calculated values, for the most part the two readings disagreed markedly, often by several percent or more. We therefore have to conclude that this isn't working very well.
Troubleshooting
Why isn't the CLS method working? The first call to action is to suspect the experimental procedures. The two obvious potential causes for the disagreement are problems with the model or spectral data and problems with the composition values (that is, what we normally attribute to "reference laboratory error").
Let us examine these potential causes: Is the problem with the model?
- The reconstruction of the spectra is nearly perfect (for the whole spectrum and at all subranges).
- The results from the whole spectrum and from all subranges are consistent.
- The results for samples with similar compositions are consistent. Some spectra were measured more than once; those gave virtually identical results.
- Closure: the spectrally computed compositions add to 100%.
- B0 => 0 (not shown in the tables, but the constant term of each CLS calibration approximates zero very well).
The conclusion we drew from this evidence was that the spectral values were correct, and there is no problem with the spectra or with the model.
Is the problem with the composition values (that is, "reference value" error)?
- Proper care was taken to avoid changes because of evaporation. Checks performed (such as loss of weight on standing) showed no effect.
- The samples were made up gravimetrically, so their compositions are precisely and accurately known.
- The laboratory technique of mixing was excellent. Ron Rubinovitz, who did the experimental work, is an experienced and careful worker.
- The possibility of evaporation was further considered:
(a) n-Heptane has a lower boiling point than toluene, therefore evaporation should cause the n-heptane to decrease faster than toluene and thus show a decrease in relative percent. However, it showed a relative increase.
(b) Proper care was taken to avoid changes caused by evaporation.
(c) Multiple measurements of spectra showed no changes in spectra with time
(d) Dichloromethane is the lowest-boiling material in the samples. Thus, samples with zero dichloromethane should have shown no effect from this cause, but despite this, there were differences between samples, counter to what we expected from evaporation.
(e) Evaporation should have caused ternary samples to show an effect proportional to the concentration of dichloromethane, (again because that is the lowest-boiling component), but this was not observed.
Conclusions from this evidence:
- The samples were made up correctly.
- Evaporation was not a cause of the variations.
- The component values were correct, there was no problem with the sample compositions.
Thus, we see that there is no reason to suspect problems with any of the experimental data, neither the gravimetric values nor the spectral values. So, what is the cause of the discrepancy?
After considering the potentials for error in the measurements (both in the spectra and in the reference values) we concluded that those were both correct, and therefore the discrepancy is because of a fundamental problem in the interpretation: When we measure spectra and when we measure weight percentages we are measuring different things. Normally when we do spectroscopic calibration, the calibration calculations connect the different types of measurements and implicitly make the appropriate corrections for the differences in the units used as well. There is an implicit and unstated assumption that except for scaling factors, all measures of concentration are equivalent.
Our conclusion here is that the problem is in the interpretation of the meaning of "concentration". There is a fundamental difficulty: What is it that we are measuring? The mathematics of CLS calculations ensure that the calibration calculations allow us to determine the fraction of the spectral information from each component in the various mixtures, but because there is no connection with the physical properties of the mixtures, there is no a priori reason to expect that the weight percentage is the correct physical property to use.
Because we so often use weight percent as the operative composition variable when performing near-infrared (NIR) calibrations, we normally assume that the spectrally active molecules are present in proportion to their weights. However, upon reflection on the subject, it is clear that this cannot be true. Molecules with the same number of, say, methyl groups, could have considerably different molecular weights. Thus, a calibration model that happened to key in on the absorbance of methyl groups might have the same coefficients for the spectral absorbances of the methyl groups, but this clearly could not correctly translate into the same weight percentage for the two different molecules. When we do "ordinary" types of NIR calibrations the weight percent of the analyte is generally given as one of the pieces of the input data.
Therefore, coefficients that are calculated for multiple linear regression (MLR), principal components regression (PCR), or partial least squares (PLS) calibrations implicitly incorporate into themselves whatever conversion factors are needed to convert the spectral changes into the weight percent compositions of the samples. In the current experiment, we don't have that information to put into the calibration calculations. We have seen that the model we developed does, in fact, accurately predict the spectrum of the mixture, if not the weight percent. It is clear that the coefficients of the pure materials that were calculated are solely functions of the spectral behavior of the materials, whereas the composition information we are trying to relate that to is defined in terms of the weight percent, and we have nothing to draw a connection with between the two disparate types of units.
A dimensional analysis can show this, also:
Units for spectra:
AT + AD + AH = Amix
Units for reference values:
Wt%T + Wt%D + Wt%H = Wt%mix
Even worse, although each set of units is self-consistent, not only are the nominal units for the two types of measurement different, they are incompatible. When we use CLS to calibrate the spectra for the mixture composition, that has nothing to do with the weight percentages of the mixture components, and nothing in the calibration process creates that connection.
Therefore, we see that although the CLS algorithm gives us the contribution of each pure component to the spectral mixture, as noted above it does not create a connection to the physical mixtures that are being measured. The experimenter has to create, or find, the connection between the weight percentages that were used to specify the mixtures and the spectral results obtained from those mixtures. The reference results, therefore, need to be converted into units that relate to the fundamental composition of the samples as measured by the spectroscopy, not their weight percentages.
The Search for Composition
It's clear that the spectral results must be reflecting some physical characteristic of the samples. Although we don't know yet what that characteristic is, from the data it's also clear that it's not weight percentages. This actually shouldn't be too surprising. The weight of a molecule is determined mainly by the nuclei of the atoms in the molecule and, those do, after all affect the vibrational frequencies. On the other hand, there is no direct connection between what happens in the atomic nuclei and the interactions of the electromagnetic radiation with the atoms, because those interactions involve the electron clouds surrounding the atoms and molecules, but not the nuclei.
After some thought, it also becomes almost intuitively obvious that at this fundamental level, there's no reason to expect a relationship between the spectroscopy and the weights of the materials. The weight of a substance, after all, comes from the nuclei of the atoms in that substance. The nuclei, however, at most play an indirect role in the interactions between electromagnetic radiation and the electron clouds of the materials that give rise to the absorbance. The conclusion here is that there is no reason to expect a relationship between the nuclei and the spectroscopy.
First Alternate Unit Considered
Our initial guess in this direction was that absorbance is proportional to the number of molecules absorbing. Ordinarily, weight percent is a surrogate for that, with unit conversions implicit in the standard calibration algorithms "filling in the holes."
Therefore, in the absence of that mathematical connection and to connect the spectroscopy to the gravimetry, our initial approach is to convert the weight percent into a measure of the relative number of molecules (that is, mole percent). This is a fairly straightforward calculation. Knowing the molecular weights of the pure materials we are using, we can perform our calculations; for example, by assuming 100 g of mixture so that the weight percent of each material in the mixture equals the actual weight (strictly speaking, mass) of each material, which is known. Dividing the weight of each material by its molecular weight gives us the number of moles of each material, and then the mole percent of each material can be calculated. For our example, we will use the mixture 25% toluene, 25% dichloromethane, and 50% n-heptane (sample 9 in Table III) as our benchmark mixture. This is convenient because we already used the results from that mixture in Table II, and that can serve as a comparison value for us. Table IV shows, step-by-step, the results of converting the weight percent values to mole percent values, as described above. We also include the spectral (CLS) value on the right hand side of the table, for comparison.

Table IV: Converting the weight % values to mole %
We can similarly compute the values for all the samples in the study, as we did in Table III for the gravimetric results. Those data are presented in Table V.
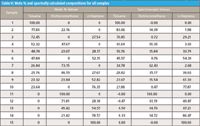
Table V: Mole % and spectrally calculated compositions for all samples
Comparing the mole percent values with the weight percent values (from Table II) we see that while the value for toluene is almost unchanged, the values for the other two components differ even more from the spectrally computed values than they previously did. This correction seems to have resulted in a degradation of the results, rather than an improvement. Thus, we see that the mole percent still doesn't adequately represent the spectroscopic results. We need to look further.
Second Alternate Unit Considered
After further cogitation, the realization dawned that when we measure spectra in the NIR region, we are not necessarily measuring the amount of different molecules. One of the first lessons learned by anyone doing NIR spectroscopy is that virtually all absorbance bands that are NIR-active are caused by the various vibrations of hydrogen atoms in the samples. Indeed, while we have not extensively discussed the point, we noted early on in this study that the absorbance bands of the different molecules are grouped together in some fairly well defined ranges (for example, 4500–5000 cm-1). In fact, we even used those various ranges when we plotted the data, because all three materials' absorbance bands fell into the same ranges. Considering the various underlying molecular vibrations, we know, for example, that the 4500–5000 cm-1 range (corresponding to 2200–2000 nm), corresponds to the combination of the stretching and bending vibrations of -CH2 and the 5000–6500 cm-1 range (which corresponds to 1530–2000 nm) is because of the second overtone of the various CH stretching vibration, and so forth.
From this we conclude that it is not necessarily the number of moles (or molecules) of each compound that are present that should matter, but the number of moles of hydrogen atoms from the various sources, because those are the atoms that are spectroscopically active. For the compounds used in this study, one molecule can have anywhere from two (dichloromethane) to 16 (n-heptane) hydrogen atoms. This difference needs to be taken into account. In Table VI we copy the pertinent information from Tables IV and V, add the information about the number of hydrogen atoms per molecule, and then compute the percentage of hydrogen atoms from each material in the mixture.

Table VI: Composition corrected for molecular weight and number of hydrogen atoms
We see in Table VI that the mole percent of hydrogen atoms still doesn't adequately represent the spectroscopic results. If anything, the correction went too far. The toluene value, which was in reasonably good agreement before, now also deviates wildly from the spectral value. The dichloromethane, whose weight percent and mole percent values were much higher than the spectral value is now far too low, and the n-heptane went from being too low to being too high.
Third Alternate Unit Considered
The next guess as to the nature of the physical characteristic that might conform to the spectroscopic behavior was to correct the percentage of the number of hydrogen atoms for the volume they occupy by applying a correction for the density of each component. This volume density of hydrogen atoms was calculated as follows:
- First, we note that to correct for density we need to know the weight (mass) of each component. Therefore, for the purpose of this calculation we again make the assumption that we are working with 100 g of mixture, so that the weight of each component is the same as the weight percent in the mixture.
- The volume occupied by a mole of each pure component is calculated from its density and molecular weight.
- The volume occupied by the given concentration of a component in the mixture is calculated from the molar volume and the weight percentage in the mixture.
- From the results of those three steps, we calculate the fraction of volume occupied by each component.
- Multiply that by the number of hydrogen atoms in each component.
- Compute the fraction of hydrogen atoms from each component contributing to the spectrum.
As we can see in Table VII, this transformation did not make any appreciable improvement, either.

Table VII: Hydrogen percentage corrected for density
We continue in our next column with a report on the results of a repetition of the work.
References
(1) H. Mark and J. Workman, Jr., Spectros. 25(5), 16–21 (2010).
(2) H. Mark and J. Workman, Jr., Spectros. 25(6), 20–25 (2010).
(3) H. Mark and J. Workman, Jr., Spectros. 25(10), 22–31 (2010).
(4) H. Mark and J. Workman, Jr., Spectros. 26(2), 26–33 (2011).
(5) H. Mark and J. Workman, Jr., Spectros. 26(5), 12–22 (2011).
(6) H. Mark and J. Workman, Jr., Spectros. 26(6), 22–28 (2011).
(7) H. Mark and J. Workman, Jr., Spectros. 26(10), 24–31 (2011).
Jerome Workman, Jr. serves on the Editorial Advisory Board of Spectroscopy and is the executive vice president of Engineering at Unity Scientific, LLC, (Brookfield, Connecticut). He is also an adjunct professor at U.S. National University (La Jolla, California), and Liberty University (Lynchburg, Virginia). His email address is JWorkman04@gsb.columbia.edu

Howard Mark serves on the Editorial Advisory Board of Spectroscopy and runs a consulting service, Mark Electronics (Suffern, New York). He can be reached via e-mail: hlmark@prodigy.net


AI Shakes Up Spectroscopy as New Tools Reveal the Secret Life of Molecules
April 14th 2025A leading-edge review led by researchers at Oak Ridge National Laboratory and MIT explores how artificial intelligence is revolutionizing the study of molecular vibrations and phonon dynamics. From infrared and Raman spectroscopy to neutron and X-ray scattering, AI is transforming how scientists interpret vibrational spectra and predict material behaviors.
Real-Time Battery Health Tracking Using Fiber-Optic Sensors
April 9th 2025A new study by researchers from Palo Alto Research Center (PARC, a Xerox Company) and LG Chem Power presents a novel method for real-time battery monitoring using embedded fiber-optic sensors. This approach enhances state-of-charge (SOC) and state-of-health (SOH) estimations, potentially improving the efficiency and lifespan of lithium-ion batteries in electric vehicles (xEVs).
New Study Provides Insights into Chiral Smectic Phases
March 31st 2025Researchers from the Institute of Nuclear Physics Polish Academy of Sciences have unveiled new insights into the molecular arrangement of the 7HH6 compound’s smectic phases using X-ray diffraction (XRD) and infrared (IR) spectroscopy.