The Determination of Nitrogen and Other Essential Elements in Fertilizers by ICP-OES
As the demand for accurate soil analysis increases, agriculturalists will need faster, less expensive analytical methods to determine the type and amount of fertilizer required for optimum crop growth. Today, inductively coupled plasma–optical emission spectroscopy (ICP-OES) is the most commonly employed technique for the determination of nutrient elements in fertilizers, while combustion analysis is used for nitrogen. Until recently, ICP-OES could not achieve the accuracy and precision necessary to measure nitrogen due to the elevated background effects caused by atmospheric nitrogen, as well as the inherent stability limitations associated with older instrument designs. This paper describes a new ICP-OES configuration and sample introduction system designed to greatly reduce nitrogen backgrounds and thereby facilitate nitrogen determinations by ICP-OES. Furthermore, the nitrogen determinations are carried out concurrently with the other nutrient elements previously reported by ICP-OES without..
Some estimates indicate that the human population will exceed 10 billion by the year 2070. Feeding such a large number of people (and their livestock) will increase the demand for nitrogen-based fertilizers used on the world's farmlands significantly. To ensure abundant harvests, and to control costs, farmers need to know the amount of nitrogen (and other nutrients) in their soil and need to match the fertilizer applied to the requirements of the soil. As the demand for accurate soil analysis increases, agriculturalists will need faster, less expensive analytical methods to determine the type and amount of fertilizer required for optimum crop growth.
Today, inductively coupled plasma–optical emission spectroscopy (ICP-OES) is the most commonly employed technique for the determination of nutrient elements (for example, Ca, Fe, K, Mg, Na, P, and S) in fertilizers, while combustion analysis is used for nitrogen. Combustion analysis is relatively slow and expensive in terms of manpower and consumables costs. Until recently, ICP-OES could not achieve the accuracy and precision necessary to measure nitrogen due to the elevated background effects caused by atmospheric nitrogen as well as the inherent stability limitations associated with older instrument designs.
This article describes a new ICP-OES configuration and sample introduction system designed to reduce nitrogen backgrounds greatly and thereby facilitate nitrogen determinations by ICP-OES. Furthermore, the nitrogen determinations are carried out concurrently with the other nutrient elements previously reported by ICP-OES without additional sample preparation.
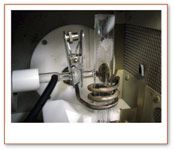
Figure 1. Custom-designed torch.
Experimental
Instrumentation. This work employed a Prodigy High Dispersion ICP system (Teledyne Leeman Labs) equipped with a custom torch (Figure 1) and automated sample-sparging system (Figure 2). Together the modified torch and automated sparging system virtually eliminate the high background that historically has caused problems with nitrogen determination by ICP. The automated sparging system resides in-line between the normal solution autosampler and the pneumatic nebulizer. Samples and standards were loaded into the ICP system's autosampler in the same manner they would be for any other analysis.
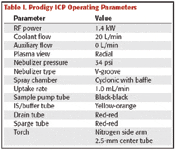
Table I. Prodigy ICP Operating Parameters
Torch Design. The key design features of the "nitrogen torch" are the addition of a sidearm viewing port and extended tailflame guard. The side-arm port is purged with argon to facilitate superior deep UV performance. A ground glass joint makes an airtight seal between torch arm and the spectrometer preoptics. The extended tailflame guard reduces the back diffusion of atmospheric nitrogen into the plasma-viewing zone.

Table II. DAP Weight Added
Instrumental Operating Parameters. For the determination of nitrogen and other elemental constituents, the conditions shown in Table I were used. In an effort to achieve the best possible accuracy for the determination of nitrogen, this analysis employs internal standardization, ionization buffering, and matrix-matched standards. The scandium internal standard minimizes potential variations caused by differences in sample matrix (for example, nebulization efficiency or sample uptake rate). The lithium chloride ionization buffer stabilizes the atom-to-ion ratio of analytes and prevents reporting errors caused by large variations in the concentration of easily ionized elements (EIEs). Because it is critical that all calibration standards be free of nitric acid and other nitrogen-containing compounds, calibration standards were made from well characterized proficiency check samples (1) dissolved in high-purity hydrochloric acid. Although this rigorous approach has been found to yield exceptional data quality, it might be possible to eliminate both the ionization buffer and internal standard. This will be investigated in future work.
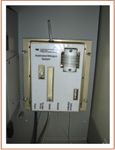
Figure 2. The automatic sparging system.
Reagents. Triton X surfactant stock solution (EM Science, Gibbstown, NJ): 1% Triton X100 in 5% HCl
Scandium internal standard and lithium buffer solution (PlasmaPure, Teledyne Leeman Labs):
- 20 ppm Sc
- 0.01% Triton–X100 [from stock]
- 1% HCl (w/v), ACS grade
- 2% LiCl (w/v) Alfa Aesar Stock # 36217 (Cas# 7447-41-8)
Calibration Standards Preparation. The appropriate amount of check standard (see Table II) was weighed into three 250 mL flasks, 10 mL 1:2 HCl acid was added, and the standards were digested on a hotplate for 15 min. 50 mL deionized water was added and the solutions were cooled to room temperature. They then were filtered and diluted to 250 mL. Relative standard concentrations for each analyte were calculated from the referenced concentration and appear in Table III.
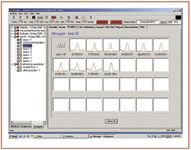
Figure 3. Thumbnail spectra for analytical wavelengths.
Sample Digestion. The digestion of samples was identical to that of the standards except the weight of sample added remained constant at 1 g.

Table III. Calibration Standard Concentrations (Includes dilution factor for 1 g/250 mL)
Analysis
The diammonium phosphate (DAP) matrix is spectrally complex. Because Prodigy provides continuous wavelength coverage and full detailed spectral information at each analytical wavelength, the best analytical lines can be selected and background correction points for each wavelength customized to eliminate potential interferences. Figure 3 shows the spectral thumbnails for a typical DAP sample (shown in green) with associated blank solution (internal standard and ionization buffer added to deionized water shown in red). For accurate positioning of background correction points at each wavelength, double-clicking the desired thumbnail will display the analytical wavelength with background points indicated.

Table IV. Results for Nitrogen with Modified Torch and NSS-2000 Automated Sparging System
For each analytical wavelength, the nearby spectrum accumulates in 15 pixels and appears with wavelength increasing from left to right. The background correction points can be set on one or both sides of the peak. Figure 4 shows Prodigy's Calculation Validation Page where the intensities for each pixel are reported and graphically displayed along with designated peak and background points (green bars).
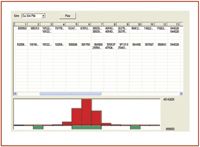
Figure 4. Calculation validation with intensity histogram and designated peak and background locations.
Sample Introduction. Early on in our research, we discovered that when the autosampler probe moved from one solution to the next, it aspirated air and produced a significant increase in nitrogen background. To eliminate the air introduced when the sample probe was in motion, the operating software was modified to stop the peristaltic pump whenever the probe was raised. Figure 5 shows the "pause pump between samples" feature. With the automated sparging system in-line (between the autosampler and the nebulizer), a larger sample volume must be pumped before the sample reaches the plasma. An uptake time of 90 s at high pump speed before the start of integration was sufficient to achieve a stable signal. The rinse station was 5% HCl and the probe rinsed for 4 s before proceeding to the next sample. Integration for all elements and internal standard occurs simultaneously and the integration time was 30 s.
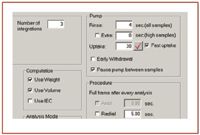
Figure 5. Sample introduction.
The Importance of Sparging. Dissolved nitrogen gas must be removed before an accurate determination of the inorganic nitrogen (that is, NO3-) from all standards and samples can be achieved. In our early experiments, we bubbled helium through distilled water and monitored the reduction of dissolved nitrogen gas with time. Figure 6 shows that after about 8 min, equilibrium is achieved and no further reduction in signal occurred. It is interesting to note that if the pump is paused during the measurement — that is, only argon passes through the plasma — the signal drops to zero parts-per-million nitrogen.
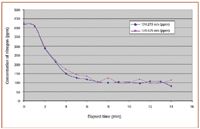
Figure 6. Effect of manual sparging on absorbed nitrogen.
Figure 7 shows a schematic of the sparging accessory plumbing. The ICP system uses two peristaltic pump channels to transport sample and internal standard–ionization buffer solutions through a tee and mixing chamber. The fourth peristaltic pump channel drains the excess liquid from the spray chamber to waste.
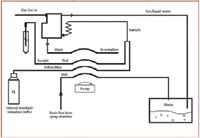
Figure 7. The NSS-2000 sparging system plumbing.
Results
The calibration curve for nitrogen produced by various dilutions of the AFPC proficiency sample appears in Figure 8. Note that the intercept (C in the Calibration Data area) has an equivalent concentration of about 2.2%. With a dilution of 250:1 the background equivalent concentration of nitrogen is 87 ppm. This yields a detection limit of approximately 8.7 ppm.
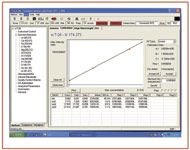
Figure 8. Nitrogen background with all system modifications.
Table IV shows the replicate and average concentration for nitrogen in a variety of phosphate proficiency samples. The standard deviation, reference value, and absolute difference are reported for each sample. All values are reported in percent nitrogen. Typically, the fertilizer industry requires the error in the determination of nitrogen to be less than 0.5% absolute.
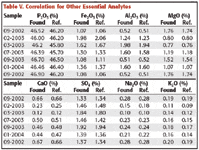
Table V. Correlation for Other Essential Analytes
The analytes traditionally measured by ICP were determined along with nitrogen without complications. Calibrations created from the same proficiency sample dilutions used for the nitrogen determination produced linear fits for each of the other elements. Each was present in sufficient concentration to exceed the QC requirements of the analysis. Table V shows excellent correlation between reference and reported concentrations.
Conclusions
The Prodigy ICP with the NSS-2000 automatic sparging system and sideview torch enable the simultaneous determination of nitrogen and other elemental components in fertilizers. This system provides three replicate readings with industry-required accuracy in a full sample cycle of less than four minutes, eliminating the need for a secondary measurement technique for nitrogen.
Reference
1. DAP check sample 2002-09 (di-ammonium phosphate) from the Association of Fertilizer and Phosphate Chemists (AFPC), Bartow, FL.

High-Speed Laser MS for Precise, Prep-Free Environmental Particle Tracking
April 21st 2025Scientists at Oak Ridge National Laboratory have demonstrated that a fast, laser-based mass spectrometry method—LA-ICP-TOF-MS—can accurately detect and identify airborne environmental particles, including toxic metal particles like ruthenium, without the need for complex sample preparation. The work offers a breakthrough in rapid, high-resolution analysis of environmental pollutants.
Trending on Spectroscopy: The Top Content of 2024
December 30th 2024In 2024, we launched multiple content series, covered major conferences, presented two awards, and continued our monthly Analytically Speaking episodes. Below, you'll find a selection of the most popular content from Spectroscopy over the past year.