Determining Trace Elements in Edible Oils Using Inductively Coupled Plasma–Optical Emission Spectrometry
Special Issues
This paper describes the analysis of edible oils radial view ICP-OES. Information is provided regarding the most suitable wavelengths, background correction, and integration times. Results of a detection limit study are presented. The accuracy of the analytical method is validated using soybean, olive, and corn oil matrices.
This article describes the analysis of edible oils using radial-view inductively coupled plasma-optical emission spectrometry (ICP-OES) and discusses the most suitable wavelengths, background correction, and integration times. Results of a detection limit study are presented. The accuracy of the analytical method is validated using soybean, olive, and corn oil matrices.
Edible oils are derived from a wide variety of plants and plant seeds and are used in many aspects of world-wide food production. After the oil has been extracted from a plant seed, it is refined as needed for use in foods such as salad dressings, margarine, shortenings, snack foods, and frying oil.
Oils contain unsaturated fatty acids and relatively high levels of phospholipids that can react with oxygen to produce unpleasant flavors and odors in the oil. The presence of trace concentrations of metals such as Ca, Cu, Fe, Mg, and Ni promote oxidation and can significantly reduce the shelf life of edible oils. To increase their chemical stability and resistance to oxidation, oils are often partially or fully hydrogenated. Oils are also hydrogenated to increase their melting point, making them suitable for use with fried foods or baked goods and pastries.
To ensure quality, parameters such as free fatty acids (FFA), neutral oil loss, moisture, and peroxide content are monitored throughout the refining process. One of the more important quality controls is trace metals analysis at various stages of the refining process.
Vegetable oils are very high in phosphorus, calcium, and magnesium and also contain traces of iron. The levels of these metals are continuously reduced during refining. Significant concentrations of these metals in the final product affect the flavor, color, and stability of the product. In addition, part of the refining process may include hydrogenation to produce shortening and margarine bases. In the hydrogenation process, a nickel catalyst is used. Total removal of nickel is required because it is a pro-oxidant. Any nickel present in the final product results in a shorter shelf life because of the increased rate of oxidation, which turns the oil rancid.
Accurate elemental analysis of edible oils requires analytical methodology that is sensitive and selective. Inductively coupled plasma-optical emission spectrometry (ICP-OES) meets these requirements and has the capability of determining up to 70 elements in a sample. ICP-OES permits close monitoring of element content throughout processing-starting with the raw oil and continuing through to the finished products. Trace-element analysis is an important part of quality control as well as final quality checks.
This article describes the analysis of edible oils using radial-view ICP-OES. Information is provided regarding the most suitable wavelengths, background correction, and integration times. Results of a detection limit study are presented. The accuracy of the analytical method is validated using soybean, olive, and corn oil matrices.
Instrument and Method
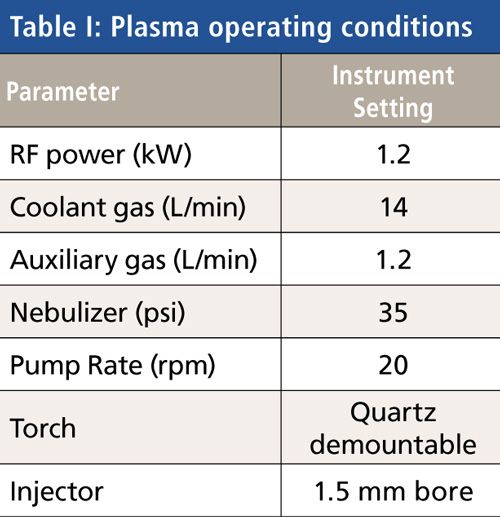
This study was performed using a Teledyne Leeman Labs Prodigy7 ICP system configured for radial viewing. The conditions used in this study are given in Table I. These conditions were found to be optimum for this application. However, these would not be expected to change significantly even for very different oil matrices.
Sample Introduction
The sample introduction system consists of the following components:
- cyclonic spray chamber with a center knockout tube
- Ryton V-groove nebulizer
- four-channel peristaltic pump
The volume of the cyclonic spray chamber is low, which allows for fast washout between samples, while its knockout tube or baffle efficiently reduces the amount of sample aerosol reaching the torch. Virtually impossible to clog, the nebulizer in this system is sensitive, inert, and requires no adjustment.
The torch is mounted in the instrument using a twist-lock cassette system. This design permits operators to remove and replace the torch to the exact same position, enhancing day to day reproducibility and simplifying training. In addition, the twist-lock design also automatically connects the coolant and auxiliary gas flows, eliminating potential errors.
Operating Parameters
For all elements of interest, background correction was performed simultaneously with the peak measurement, resulting in improved detection limits. All samples were analyzed with the radial view. The operating conditions used for all data collection are listed in Table I. Optimal operating conditions were not expected to be significantly different for each oil matrix because the viscosity of the calibration standards was closely matched to that of the samples analyzed in this work. As a result, one set of operating conditions was used for all sample analyses.
Calibration Standards
To prevent matrix effects in the sample introduction system, the viscosities of samples and standards were matched as closely as possible. The viscosities of all oils tested were approximately the same. Under these conditions, an internal standard to correct for differences in aerosol transport efficiencies is unnecessary. High-purity kerosene was used as a solvent for all samples and standards, and all dilutions were performed on a weight-to-weight basis. The edible oil matrices were prepared by diluting them 1:10 with kerosene. The calibration standards for the detection limit and spike recovery studies were prepared by diluting VHG V23 metallo-organic standards using a dilution ratio of 1:10. Standards were prepared at 0.00, 1000, 2500, and 5000 ppb levels. For matrix-matching purposes, the 0.00 ppm standard was prepared by diluting VHG base oil 75 in a 1:10 ratio.
Wavelength Parameters
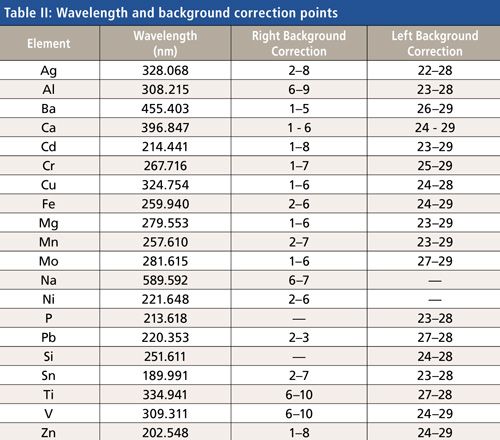
The ICP-OES system typically uses a 27-pixel-wide subarray, centered on the wavelength of interest, to collect data for each analyte. However, subarrays can be up to 57 pixels in width if needed. The analytical peaks and background correction points are defined in each subarray with pixel position and width values. The wavelength and background correction points used in this method are outlined in Table II. For elements in which background correction included more than one pixel on the same side, multiple values are listed to indicate the positions for all the pixels used. The default starting position and pixel width was used for all analytical peaks. For each analyte of interest, background correction was performed simultaneously with the peak measurement. Additionally, all pixel data are saved, which allows for future data recalculation.
An example of the data collection that takes place in each subarray is illustrated graphically in Figure 1. This figure represents the data collected for the 1000 ppb multielement standard (standard 2) at the Cd 214.441-nm line. In Figure 1, the left and right background correction points are illustrated at pixel positions 1 and 23, with a width of 6 and 7, respectively. The pixels used for integrating the analytical peak are at pixel positions 11–17.
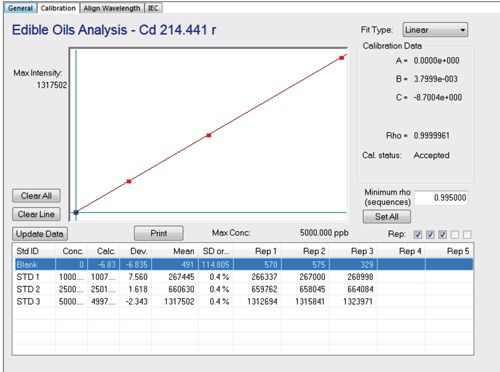
An example of a typical calibration curve is illustrated in Figure 2. The figure is based on calibration data for the Cd 214.441-nm line and demonstrates typical precision and linearity for the range of concentrations included in the calibration.

Results and Discussion
Samples
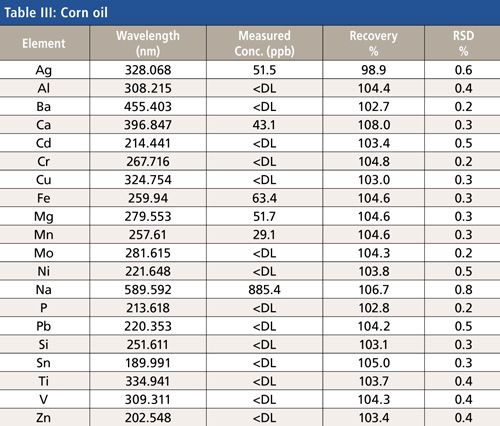
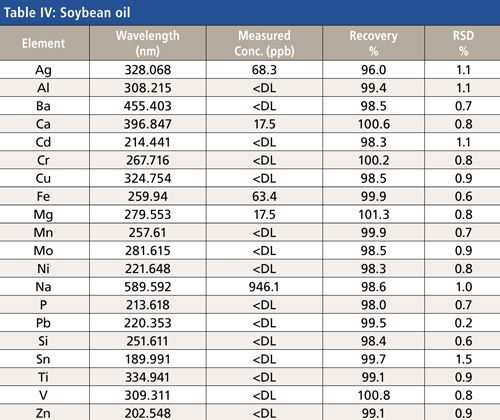
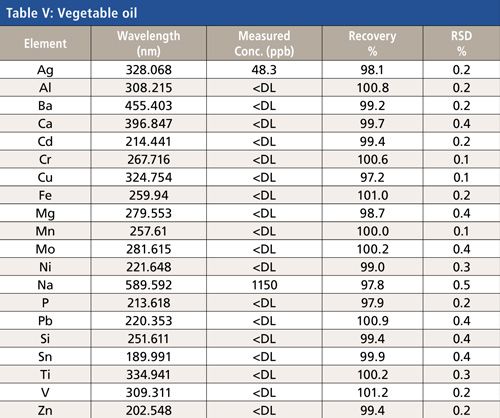
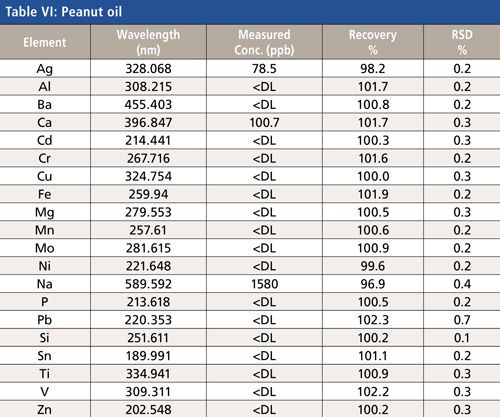
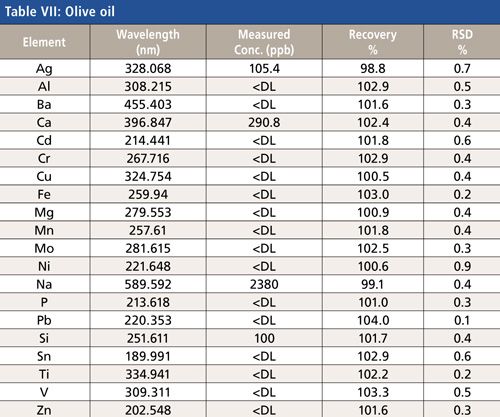
After the plasma was ignited and the instrument was allowed to warm up for 15 min, the instrument was calibrated using the calibration blank and standards listed in Table II. Following calibration, the edible oil samples were analyzed. Results for the corn, soybean, vegetable, peanut, olive and canola oil samples are presented in Tables III–VIII, respectively. Results for each oil sample are reported in units of parts per billion (ppb) and are corrected for the 1:10 dilution. Results are also presented for the recoveries of the 2 ppm spikes, along with %RSD values for the measured spike concentrations. Elements are listed as not detected (<DL) if the measured concentration was below the instrument’s detection limits (Table IX).
Detection Limits
A study was performed to determine the instrument’s detection limits in radial view mode for the elements of interest. Detection limits were calculated based on three times the standard deviation of 10 replicate measurements of the calibration blank. Results for the detection limit study are listed in Table IX. The detection limits are corrected for the typical 1:10 dilution done for analysis of edible oils.
Conclusion
Edible oils are easily analyzed using radial-view ICP-OES . The spike recovery results presented in this work indicate that all analytes were measured within ±10% of the spiked concentrations. Those results, along with their associated %RSD values, demonstrate that the approach can be used to provide accurate and reliable results with edible oil sample matrices. The use of kerosene to dilute all standards and samples eliminated the need for an internal standard to correct for differences in aerosol transport efficiencies between samples.
Manuel Almeida is the ICP Product Manager and Karolina Carpenter is an Applications Specialist at Teledyne Leeman Labs in Hudson, New Hampshire.
Direct correspondence to: leemanlabsinfo@teledyne.com

High-Speed Laser MS for Precise, Prep-Free Environmental Particle Tracking
April 21st 2025Scientists at Oak Ridge National Laboratory have demonstrated that a fast, laser-based mass spectrometry method—LA-ICP-TOF-MS—can accurately detect and identify airborne environmental particles, including toxic metal particles like ruthenium, without the need for complex sample preparation. The work offers a breakthrough in rapid, high-resolution analysis of environmental pollutants.
Trending on Spectroscopy: The Top Content of 2024
December 30th 2024In 2024, we launched multiple content series, covered major conferences, presented two awards, and continued our monthly Analytically Speaking episodes. Below, you'll find a selection of the most popular content from Spectroscopy over the past year.