Development of a High-Throughput LC–MS Assay for Drugs of Abuse from Biological Matrices
A high-throughput LC–MS method using core-shell UHPLC columns to screen for a panel of 11 drugs of abuse (expanded SAMHSA) was developed. The corresponding SPE method allowed the reproducible separation and quantitation of these 11 components in less than 2 min. This method demonstrates the power of new-generation HPLC media as well as some of the factors one must consider when developing such methods for LC–MS analysis.
Over the last few years, technological advances in electrospray mass spectrometry (MS) have led to a migration of clinical and forensic toxicology analytical methods from gas chromatography–MS (GC–MS) to liquid chromatography–MS (LC–MS). LC–MS provides sensitivity, speed, and simplified sample preparation protocols that have all contributed to its widespread adoption in the toxicology industry. Introduction of fast LC technology has further increased the throughput of many assays, but not without some integration challenges between the ultrahigh-pressure LC (UHPLC) column and the mass spectrometer. Of great importance is optimizing MS parameters to properly quantitate the narrow peak widths that UHPLC columns generate. Another critical aspect in developing any robust UHPLC–MS assay of biological compounds is optimizing the sample preparation method so that MS-interfering matrix components do not compromise the quantitation of critical analytes (1).
Efforts were undertaken to develop a high-throughput LC–MS method using core-shell UHPLC columns to screen for a panel of 11 commonly tested drugs of abuse. This panel is an expansion of the list established by the Substance Abuse and Mental Health Service Administration (SAMHSA). A corresponding SPE method was developed that allowed the reproducible separation and quantitation of these 11 components in less than 2 min. This new high-throughput method demonstrates the power of new-generation high performance liquid chromatography (HPLC) media as well as some of the factors one must consider when developing such methods for LC–MS analysis (2).
Drug abuse in the workplace continues to be an area of concern for certain areas of employment, especially in the transportation industry. In many cases drug testing is a requirement for certain positions, or can be part of a recovery program for an affected employee suffering from mental health or substance problems. The expanded SAMHSA panel of 11 commonly abused, federally scheduled drugs is one of the more popular screening assays. Initial drug screening often uses ELISA assays to test for presumptive positives followed by an analytical technique for confirmation. In the past that analytical method was often a GC or GC–MS method. However, with major advances in electrospray MS and HPLC column technology, many are moving such methods to LC–MS systems.
Technology advances in HPLC columns and MS systems have been on a parallel track in reducing analysis time and increasing sensitivity of assays. Higher efficiency HPLC columns have allowed method developers to shorten run times while maintaining resolution of key components in a mix; "narrower" peaks in a chromatogram are more concentrated, resulting in increased sensitivity for analytes. Mass spectrometers have become more sensitive with faster cycle times, and advances in instrument programming now allow for time-dependant control of data acquisition for specific ions, delivering further improvement in speed and sensitivity. Key in developing any high-throughput method is integrating the chromatography with the capabilities of the mass spectrometer used.
Materials and Methods
All reagents were obtained from Sigma Chemical (St. Louis, Missouri) and solvents were purchased from EMD (San Diego, California). Multiple urine samples from donor patients were spiked with various physiologically relevant concentrations of the 11 drug analytes and their d3 internal standards to validate any developed method across a wide range of analyte concentrations (from nanograms per milliliter to micrograms per milliliter). A representative list of the compounds and their structures is shown in Figure 1. Urine samples were hydrolyzed to release glucuronide metabolites using beta glucuronidase. A 50-mg/mL solution of beta glucuronidase was prepared and 100 µL was added per 1 mL of urine analyzed (approximately 6200 units/mL urine). Upon enzyme addition, the urine sample was vortexed and incubated at 60 °C for 2 h and then centrifuged to remove precipitants.

Figure 1: Chemical structures of the analytes in the expanded SAMHSA panel. These are 11 commonly abused federally scheduled drugs often tested in the workplace and for abuse screenings. Immunoassays are typically used as a screen for presumptive positives and chromatographic methods are required for confirmation of positive results.
Treated samples were cleaned up by solid-phase extraction (SPE) before analysis by LC–MS. Samples were diluted 1:1 with 0.1 M HCl, then loaded on a Strata-X-C 30 mg/3 mL mixed-mode SPE cartridge (Phenomenex, Torrance, California) that previously had been conditioned with methanol and equilibrated with 0.1 M HCl. The cartridge was washed twice with 0.1 M HCl and once with 30% acetonitrile–0.1 M HCl; the analyte was eluted with an ethyl acetate–isopropanol–ammonium hydroxide mixture (60:24:16). The sample was evaporated to dryness under a nitrogen gas stream and then reconstituted in 5% methanol–0.1% formic acid in water before analysis by LC–MS.
HPLC analysis of the samples was performed on a 1200SL binary pump with on-line degasser, autosampler, and column oven (Agilent Technologies, Palo Alto, California). MS-MS detection was performed using a QTrap 4000 mass spectrometer (AB SCIEX, Foster City, California) in positive ion mode; a scheduled list of multiple reaction monitoring (MRM) ions was used for quantitation of specific analytes and their internal standards to maximize the scan rate of mass spectrometer to get good peak quantitation (Table I). A 50 mm × 2.1 mm Kinetex core-shell 2.6-µm C18 column was used for all separations (Phenomenex). A gradient separation method was used with an aqueous mobile phase of 0.1% formic acid in water (A) and organic mobile phase of acetonitrile (B). The gradient used was from 5% to 95% B in 1.7 min followed with a 0.2 min hold at 95% B and re-equilibration at initial conditions for a total cycle time of 2.6 min. The flow rate was 1.2 mL/min and the column oven was set at 25 °C.
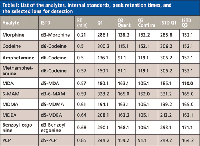
Table I: List of the analytes, internal standards, peak retention times, and the selected ions for detection
Results and Discussion
Core-shell media, a recent innovation in UHPLC, utilizes optimized particle geometry to generate high-efficiency separations on par with sub-2-µm UHPLC columns. A major advantage of core-shell media over traditional sub-2-µm columns is that they operate at relatively low back pressures such that standard HPLC systems with 400-bar limits can be used for many high-speed separations (in this application the HPLC system had a 600-bar limit). Care must be taken, however, to match detector acquisition rate with core-shell column performance. Such columns can deliver efficiencies close to 300,000 plates/m, resulting in peak widths for some analytes in fast LC separations as narrow as 1 s. Because accurate shape and quantitation generally requires 20 points across a peak, a minimum sampling frequency of 20 Hz is ideal when using core-shell columns (or any other UHPLC column) for separation.
While adjusting the sampling rate with UV detection is a rather trivial task, it can be a critical step when MS detection is used. For the detection of analytes from a complicated biological matrix, an MRM MS-MS mode is used for quantitation and positive identification. Specific parent-daughter transitions along with a known retention time are considered a positive identification of a particular analyte. For single-analyte detection by MRM mode, newer mass spectrometers can acquire spectra at the desired 20-Hz frequency with reasonable dwell time to obtain good sensitivity. However, for developing an LC–MS method like this 11-drug panel (and their deuterated internal standards), most mass spectrometers cannot acquire data fast enough to obtain adequate quantitation and sensitivity of all 22 MRM transitions if all ions are being acquired at the same time. Fortunately, newer mass spectrometers allow one to set up a program that acquires only specific MRM transitions at a given time during the LC–MS run. The list of the elution times using the C18 column and their MRM transitions shown in Table I was used to develop an acquisition program for the panel of drug analytes (and their deuterated internal standards).
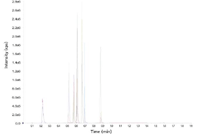
Figure 2: LCâMS chromatogram of the drug abuse panel. The 11 analytes were spiked andanalyzed from SPE-extracted human urine samples using a core-shell Kinetex 2.6 µm C18 column(50 mm à 2.1 mm) along with their deuterated internal standards.
A sample preparation method using SPE was developed to analyze the drug panel from urine samples. Because some of the analytes can have glucuronide metabolites in urine that can reduce the sensitivity and accuracy of the assay, the samples were first treated with beta glucuronidase to hydrolyze all the glucuronides. A simple method using a mixed-mode SPE sorbent was developed, which allowed for rapid and easily multiplexed sample cleanup. This contrasts with other methods that use either liquid–liquid extraction (LLE) or a combination of LLE with traditional SPE for sample cleanup. These methods are laborious and not amenable to automation, which can be an issue for those who need to analyze large numbers of samples. In our studies, the mixed-mode SPE cleanup method appeared adequate for removing matrix interference (data not shown) and delivered a good column lifetime for the hundreds of injections performed for this assay. A representative LC–MS chromatogram for the separation of the drug analytes spiked into urine samples using the core-shell column is shown in Figure 2. Note the good separation and peak shape for most of the analytes achieved in under a minute. This contrasts with typical methods developed using either 3-µm or 5-µm fully porous media, which typically require 6–12 min to achieve a similar resolution between the components in this mixture. Good retention-time reproducibility across over a hundred samples enabled the acquisition window for specific MRM transition to be set at very narrow (3–5 s) widths without any drifting out of the parameters we set for our studies.
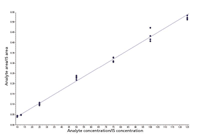
Figure 3: Calibration curve for benzoylecognine extracted from urine. Quantitation ranged from 10 to 125 ppb with an RSD under 15% for this component.
Multiple samples with different analyte levels from several patients were analyzed to establish calibration curves and assay detection limits. Figure 3 shows an example of a calibration curve for benzoylecognine, one of the analytes in the panel. Note the good linearity and reproducibility over a log scale of concentrations. Table II lists the specific analytes and their lower and upper limits of quantitation, precision, and accuracy. For most analytes, the lower level of quantitation was 25 ng/mL or lower. Morphine and codeine had higher quantitation limits — around an order of magnitude higher (around 200 ng/mL). The good linearity and accuracy across several patients suggest that matrix effects are not a factor in the quantitation of the target analytes and the method appears rugged and reliable for analyzing large numbers of patient samples.
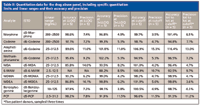
Table II: Quantitation data for the drug abuse panel, including specific quantitation limits and linear ranges and their accuracy and precision
Conclusion
The need for higher throughput clinical assays has led many groups to evaluate replacing older GC–MS methods with LC–MS techniques for analyzing specific mixtures. LC–MS methods also eliminate the need to derivatize samples before analysis (which is common for GC methods), further reducing sample preparation requirements. Recent innovations in MS instrumentation and chromatography, such as core-shell UHPLC columns, have allowed for faster LC–MS methods and more sensitive assays. In this article, we demonstrated the development of a simplified sample preparation and LC–MS analysis method for the expanded SAMHSA drug-of-abuse panel. The sample preparation method is simplified greatly by using the mixed-mode SPE cartridges, which minimize issues with matrix interference. The LC–MS method using the core-shell column results in a baseline separation of the components in the mixture with a run time of less than 2 min. The developed method is sensitive and accurate and provides a significant improvement over existing GC–MS or LC–MS methods using standard HPLC columns.
Michael McGinley and Carl Sanchez are with Phenomenex, Torrance, California.
References
(1) M. McGinley and C. Sanchez, Current Trends in Mass Spectrometry, May 2010, 36–41.
(2) SAMHSA Workplace Homepage: http://www.workplace.samhsa.gov.

High-Speed Laser MS for Precise, Prep-Free Environmental Particle Tracking
April 21st 2025Scientists at Oak Ridge National Laboratory have demonstrated that a fast, laser-based mass spectrometry method—LA-ICP-TOF-MS—can accurately detect and identify airborne environmental particles, including toxic metal particles like ruthenium, without the need for complex sample preparation. The work offers a breakthrough in rapid, high-resolution analysis of environmental pollutants.
The State of Forensic Science: Previewing an Upcoming AAFS Video Series
March 10th 2025Here, we provide a preview of our upcoming multi-day video series that will focus on recapping the American Academy of Forensic Sciences Conference, as well as documenting the current state of the forensic science industry.
Previewing the American Academy of Forensic Sciences Conference
February 14th 2025This year, the American Academy of Forensic Sciences Conference is taking place from February 17–22, 2025. We highlight the importance of spectroscopy in this field and why we’re covering the conference this year.