Effect of Azimuthal Angle on Infrared Diffuse Reflection Spectra of Fabrics
Spectroscopy
Infrared spectroscopy is an appealing technique for application to forensic samples because it offers the benefits of being non-destructive and non-hazardous, fast, reasonably sensitive, and resistant to some of the interferences of many commonly used techniques. Our research team has been focusing on detecting biological fluids on fabrics, which are inherently anisotropic substrates for spectroscopy. The work presented here investigates the effect of azimuthal angle of the sample on the infrared diffuse reflection spectra of fabrics with a goal of removing sampling differences as a source of analytic variation.
Infrared spectroscopy is an appealing technique for forensic investigations, offering the benefits of being nondestructive and nonhazardous. While detection of biological fluids is generally the goal, understanding the spectral variability of the substrate (such as fabric) on which these fluids are found is critical for optimizing detection capabilities. To that end, we investigated how the spectra of cotton fabric varied as a result of the azimuthal angle of the sample during infrared diffuse reflection spectroscopy. In this article, we demonstrate how to minimize the influence of azimuthal angle variability on the spectra.
Infrared (IR) spectroscopy is an appealing technique for application to forensic samples because it offers the benefits of being nondestructive, nonhazardous, fairly sensitive, and resistant to some of the interferences of many commonly used techniques. Our research team has been focusing on detecting biological fluids on fabrics, which are inherently anisotropic substrates for spectroscopy (1). Consequently, we felt it was important to understand how variations in surface morphology and sampling methodology influence the spectra so that data acquisition can be made most consistent. Understanding the variability of fabric spectra also informs the experimental and data processing steps necessary to detect analyte coatings on fabric surfaces. Fabric surfaces are very irregular because of variability in the surface morphology as well as the fabric weave (2). The work presented here investigates the effect of azimuthal angle of the sample on the IR diffuse reflection spectra of fabrics, and shows that a common type of normalization can be used to compensate for much of the effect.
Experimental
One square (5 x 5 cm) sample of triple-dyed, unfinished red cotton was cut from a large textile roll. The face of the fabric was arbitrarily designated and was consistent throughout the measurements. IR diffuse reflection spectra were collected using a Thermo-Nicolet Nexus 670 Fourier transform infrared (FT-IR) system (Thermo Fisher Scientific) with the U-Cricket (Harrick Scientific Products) accessory and a gold diffuse reflection standard (Optronics Laboratories, Inc.). Spectra were collected using the following parameters: 600–4000 cm-1 spectral range, 4 cm-1 resolution, gain of 8, 128 scans, laser modulation frequency of 10 kHz, Happ-Genzel apodization, and Mertz phase correction. The spectrometer used a DTGS detector with a CsI beamsplitter and was operated by OMNIC software (Thermo Fisher Scientific). Spectra were saved as text files and processed using MATLAB software (The MathWorks, Inc.).
A protractor to estimate angles was attached to the gold standard and both were set atop the fabric on the U-Cricket accessory. The protractor was used to mark the azimuthal angle of fabric rotation in increments of approximately 45°: 0°, 46°, 90°, 134°, 180°, 222°, 270°, and 314°. At each angle, 20 replicate spectra were taken by laterally translating the sample across the accessory aperture. The first four angles were collected 2 weeks before the final four angles.
Results and Discussion
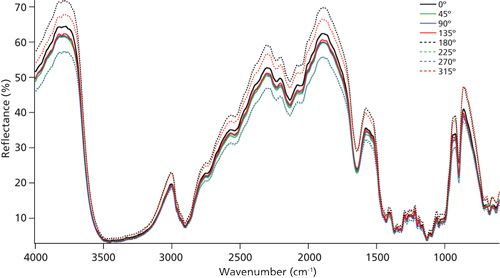
There are two primary sources of variability in the collected data: fabric rotation and instrument drift (Figure 1). These changes mostly influence the magnitude of reflection, but they produce much less of an effect on the spectral shape. Because of this lesser effect on the spectral shape, regions of high fabric absorption (such as the O-H stretching region around 3400 cm-1) show minimal change related to fabric orientation. In contrast, regions with lower absorption (higher reflectance) are more susceptible to variation. For any set of spectra acquired with nearly the same instrument alignment, the same pattern of spectral intensity in relation to rotation appears, though this pattern is much more visible in the second set of spectra (180-315° measurements). The greatest difference appears between the perpendicular axes of the 0/180° measurement and the 90/270° measurement. While one might expect each 45° rotation to create a similar change, this is not the case. Rotating the fabric from 180° to 222° causes a dramatic effect, while rotating again to 270° creates very little difference. Taking one more step to 314° creates another pronounced intensity increase.

Figure 1: Each trace represents the average of 20 replicate spectra collected upon translational movement at each rotation angle (Savitzky-Golay smooth, quadratic, 21-point window). Solid lines correspond to spectra collected 2 weeks before those represented by broken lines.
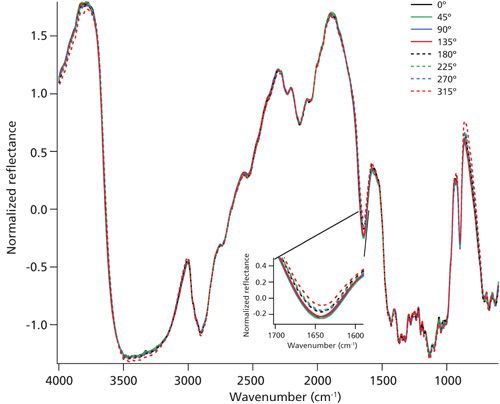
Unfortunately, regions of highest fabric reflectance are regions where one might expect the most sensitivity to coatings on the fabric surface. Previous work has explored how the relationship between fabric substrate absorbance and coating absorbance influence the ability to analyze surface coatings (2). To enable detection of these minor spectral contributions, we must be able to minimize the variability in the fabric spectrum. The relative variability between fabric orientations can be minimized by normalizing the data. Figure 2 shows the effect of applying a standard normal variate (SNV) type of normalization, for instance (3).

Figure 2: The same data as shown in Figure 1 after a standard normal variate transformation to reduce scattering effects on the spectra.
After normalization, it is possible to see changes in the spectra of samples at particular absorption frequencies (particularly at the absorption band below 1650 cm-1), where we would expect bands for water adsorbed in the fabric to appear. This type of variability probably results from variability in the relative humidity of the laboratory, which we have observed to vary substantially over the course of days and weeks, because fabrics are well known to quickly absorb water from the environment (4).
Although the SNV transform reduces the influence of the fabric orientation on the appearance of the spectra, closer inspection with principal component analysis demonstrates that residual variance related to the orientation is still present. In addition to this residual variance, orientation effects on highly ordered synthetic fabrics including those with heterogeneous coatings are probably more difficult to correct with SNV than the relatively randomly arranged fibers of cotton fabrics. These factors suggest that it is preferable to control the variability of the spectra related to fabric orientation during data collection, rather than relying on data processing transforms to reduce its influence.
Conclusion
Changing the azimuthal orientation of a sample fabric mainly alters the absolute reflectance observed in diffuse reflection, without a very pronounced chance in the normalized shape of the fabric spectrum. These changes are largely (though not entirely) remediated by normalization techniques such as the SNV transform. After normalization, subtler chemical effects in the spectra are more readily observed. Consequently, spectral effects related to a surface coating rather than variability in the substrate spectrum will be more readily detected.
Acknowledgment
This research was supported by award 2011-IJ-CX-K055 from the National Institute of Justice, Office of Justice Programs, U.S. Department of Justice. The opinions, findings, and conclusions or recommendations expressed in this publication are those of the authors and do not necessarily reflect those of the Department of Justice. Mention of commercial products does not imply endorsement on the part of the National Institute of Justice or the University of South Carolina.
References
- H. Brooke, M.R. Baranowski, J.N. McCutcheon, S.L. Morgan, and M.L. Myrick, Anal. Chem. 82(20), 8412–8420 (2010).
- M.R. Pearl, H. Brooke, J.N. McCutcheon, S.L. Morgan, and M.L. Myrick, Appl. Spectrosc. 65(8), 8 (2011).
- R.J. Barnes, M.S. Dhanoa, and S.J. Lister, Appl. Spectrosc. 43(5), 772–777 (1989).
- J.F. Fuzek, Ind. Eng. Chem. Prod. Rd.24(1), 140–144 (1985).
Stephanie A. DeJong, Brianna M. Cassidy, Zhenyu Lu, Raymond G. Belliveau, Stephen L. Morgan,M. L. Myrick, and Megan R. Pearl are with the Department of Chemistry and Biochemistry at the University of South Carolina in Columbia, South Carolina. Jessica N. McCutcheon is with the Department of Chemistry at Francis Marion University in Scranton, South Carolina. Wayne O’Brien is with Georgia Pacific-Cellulose, LLC in Memphis, Tennessee. Nicholas D. Boltin is with the Department of Biomedical Engineering at the University of South Carolina. Direct correspondence to: myrick@sc.edu

AI Shakes Up Spectroscopy as New Tools Reveal the Secret Life of Molecules
April 14th 2025A leading-edge review led by researchers at Oak Ridge National Laboratory and MIT explores how artificial intelligence is revolutionizing the study of molecular vibrations and phonon dynamics. From infrared and Raman spectroscopy to neutron and X-ray scattering, AI is transforming how scientists interpret vibrational spectra and predict material behaviors.
Real-Time Battery Health Tracking Using Fiber-Optic Sensors
April 9th 2025A new study by researchers from Palo Alto Research Center (PARC, a Xerox Company) and LG Chem Power presents a novel method for real-time battery monitoring using embedded fiber-optic sensors. This approach enhances state-of-charge (SOC) and state-of-health (SOH) estimations, potentially improving the efficiency and lifespan of lithium-ion batteries in electric vehicles (xEVs).
New Study Provides Insights into Chiral Smectic Phases
March 31st 2025Researchers from the Institute of Nuclear Physics Polish Academy of Sciences have unveiled new insights into the molecular arrangement of the 7HH6 compound’s smectic phases using X-ray diffraction (XRD) and infrared (IR) spectroscopy.