Establishing a Calibration Procedure for the Energy-Shift Axis in Diverse Raman Spectrometers
Special Issues
A procedure was developed to calibrate the wavenumber (energy shift) axis in Raman spectrometers, and it was tested in both portable and laboratory-based instruments.
The tremendous growth in optical measurement technology based on Raman scattering has delivered a diverse range of instruments with varying levels of performance and cost. The core technology within these instruments is based on the dispersion of Raman scattered light by a single grating. The calibration of these devices is essential to ensure correct instrument operation and establish confidence in the quality of recorded data. To achieve these goals, we have developed a procedure to calibrate the wavenumber (energy shift) axis in four different Raman spectrometers. We use a robust, stable reference material (a polymer) and apply this to a range of portable and laboratory-based system spectrometers and determine the error in displayed wavenumber axis values relative to established reference spectra. We evaluate these data with respect to sources of uncertainty in the wavenumber axis calibration (for example, spectrometer resolution and excitation laser characteristics).
The use of Raman spectroscopy has increased dramatically in the past 15 years thanks to improvements in laser, detector, and optical component technologies (1). A new market has been created through the invention of handheld Raman spectrometers, resulting from research into the reduction of instrument size and cost. These handheld instruments are typically used for identification of materials outside the traditional laboratory environment (2) whereas larger laboratory-based instruments are used routinely for precise measurement of sample characteristics (for example, crystallinity) (3).
A core technology in both instrument types is the single grating used to disperse Raman scattered light from a sample. The calibration of this dispersion and the subsequent sampling by a pixel array detector is crucial to ensure measurement accuracy and repeatability. This calibration is valuable to instrument manufacturers, who must prove their systems work as intended, and for end users, including academics and industrial users who are increasingly required to ensure that their measurements are performed in accordance with agreed standards (4) or frameworks (5). We report the development of a calibration procedure for the energy shift (or frequency) axis for spectrometers that measure spontaneous, Stokes-shifted Raman scattering.
A specific molecular vibration is represented by a peak in the Raman spectrum that occurs at wavelength λi (with an energy shift νi). This wavelength is measured with a spectrometer using an excitation laser wavelength λ0 as given by the equation below:

The measurement of λ0 is therefore an important parameter when calibrating a Raman spectrometer. Previous work has measured λ0 by locating its associated laser peak, which should occur at 0 cm-1 when observed with a Raman spectrometer (6). This approach is limited by the resolution of the spectrometer, which is typically 0.3 nm, or 5 cm-1 when using a laser wavelength of 785 nm (7). In contrast, we used a wavemeter to determine λ0 to femtometer precision (8).
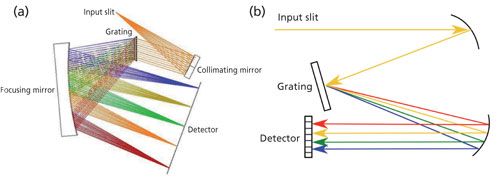
Today, Raman spectrometers are based on a single-grating spectrograph that comes in two variations defined by the interaction of the incident light and the grating: transmission (where incident light is dispersed by transmission through the grating, see Figure 1a) and reflection (where incident light is reflected from the grating’s front surface, see Figure 1b). Reflection gratings can operate over a wide range of wavelengths and can be tuned by adjusting the angle of light incident on the grating. (9). For compact systems, the reflection grating needs high dispersion, but this results in reduced diffraction efficiency. To solve this problem, transmission gratings have been developed that provide high efficiency at high dispersion. A full discussion of spectrograph designs can be found in a paper by Slater and colleagues (9). The aim of our work is to test our calibration process for commercially available spectrometers built using either type of grating.
Figure 1: Diagrams of grating configurations: (a) transmission and (b) reflection.
Calibrating the energy shift axis has been accomplished typically using light from the atomic emission lines of neon or argon lamps (10), providing calibration to well-known, precise peaks but only when sufficient light is coupled from the source to the Raman spectrometer system (for example, via an optical probe). This situation can be difficult to reproduce when applied in confined areas.
The American Society for Testing and Materials (ASTM) has produced a standard for calibrating Raman spectrometers (4) that includes the use of several solvents. The use of solvents outside of the laboratory can be prohibitive in terms of safety and cost, so the use of polymers offers a chemically-safe and robust alternative. Indeed, polystyrene is included in the ASTM standard and has been applied in previous studies (11). We measured Raman spectra from polystyrene and compared the data to the latest edition of the European Pharmacopeia standard (12), which reports a reference spectrum for polystyrene and suggests limits for measurement conformity.
We apply a metrological method to assess uncertainty in the spectrometer calibration, known as the Guide to Expression of Uncertainty in Measurement (13). This method allows for the evaluation of calibration results with respect to sources of uncertainty such as spectrometer resolution and excitation laser characteristics.
Experimental
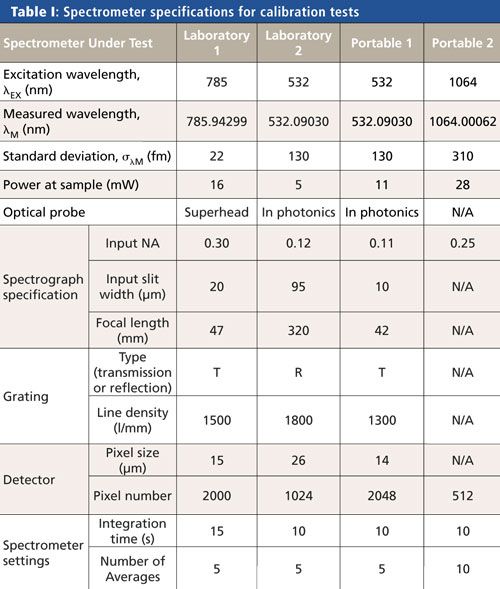
Spontaneous Raman spectroscopy was carried out in a backscattering configuration. Four spectrometers were calibrated and are described in Table I. They comprised two laboratory spectrometers and two portable spectrometers. To avoid promoting one manufacturer’s instruments over another, we name the spectrometers according to their usage (laboratory or portable). One portable spectrometer (Portable 2) had an integrated laser and probe with the spectrometer, while the other spectrometer systems had separate lasers and optical probes as shown in Table I. Entries in Table I marked “N/A” show that the specification was not made available by the manufacturer. Three spectrometers had fixed gratings but one spectrometer (Laboratory 2) had an adjustable grating. This spectrometer was set so that the peaks required for the calibration were displayed within one window (that is, the grating was stationary during calibration). The excitation laser wavelengths were measured with a wavemeter (High Finesse WS 7UV) as shown in Table I.
A polystyrene sheet was obtained with a thickness of 2 mm, a width of 25 mm, and a length of 75 mm. This sheet was transparent and in the atactic form of polystyrene as defined in reference 14. The Raman spectrum of polystyrene is shown in Figure 2 and agrees with those obtained in previous studies (15–17). Spectra were collected using the spectrometer settings as shown in the bottom two rows of Table I. All spectra were corrected for unwanted background signals by subtracting a spectrum measured while the polystyrene sample was not present. This process was repeated for each spectrometer calibrated.
Figure 2: (Left) Raman spectrum and (top right) peak assignments for atactic polystyrene used in this work. Peak assignments taken from references 13, 14, and 15. Bottom right: chemical diagram of polystyrene.
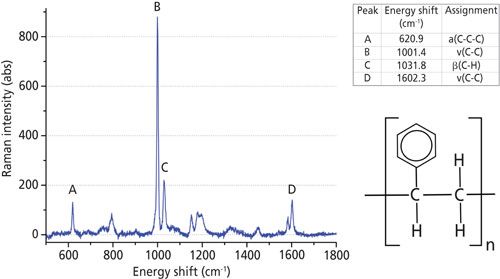
The spectra consisted of light intensities Ii measured by a single pixel i = 1, . . .N in a linear detector array of N pixels. A conversion file was provided by the manufacturers that converted each pixel (i = 1, . . .N) into an equivalent wavelength. The data were then analyzed in sets of (λi,Ii), i = 1, . . .N. Four peaks from the recorded spectra (labeled A, B, C, and D in Figure 2) were manually identified and fitted to a profile. We chose to use Gaussian profiles because they produced the smallest fitting residuals. Peak A is an isolated single peak, so its energy shift νA is determined by fitting a single Gaussian line profile and a linear background to a subset of data points covering the peak and the background surrounding the peak:

where Δ:νA is the line width and IA is the maximum intensity of the peak, and where I(0,A) and αA are parameters of a linear background around the peak. We apply equation 1 to convert wavelength values to energy shift. Peaks B and C interfere with each other, so in this case the positions νB and νC of the peaks are determined by fitting two Gaussian line profiles and a linear background to extracted data points (λi, Ii) covering the two peaks and a small part of the surrounding background:

Peak D interferes with an unlabeled peak X (occurring at 1583 cm-1 in Figure 2) and so we apply equation 3 using corresponding values for νD and νX. The fitting was performed using a generalized least squares method (18) that takes into account uncertainties assigned to the measured quantities (the extracted data points [λi, Ii] and the pump wavelength λ0) and propagates them to the quantities inferred solely from the measured quantities through the measurement models (the Raman shifts νi corresponding to the extracted wavelengths λi, and the center frequencies νA, . . . ,νX, the line widths ΔνA, . . .,ΔνX, and the maximum intensities IA, . . . , IX of the five peaks A, B, C, D, and X).
Results and Discussion
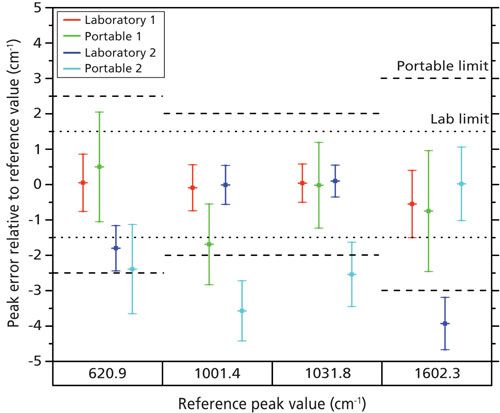
The differences between the peak positions for the fitted data and the reference values were compared, as shown in Figure 3. The error bars in the plot represent the standard deviation in the measured peak position. This is equal to the standard uncertainty, which is expressed as the root square sum of uncertainties in the independent variables that influence the measured data, for example laser wavelength, reference peak position (based on the error in peak positions reported in reference 4), and the results from the peak fitting algorithm. The permitted limits for these errors are described in the literature (12) and are displayed accordingly in Figure 3. The results show that the Laboratory 1 spectrometer conforms to the permitted variation in the peak position. The Portable 1 spectrometer conforms partially except for one peak (at 1001.4 cm-1) where the measurement uncertainty exceeds the permitted range. The spectrometer with an adjustable grating (Laboratory 2) deviates significantly for the peaks at the extremes of the spectrum (620 and
1602 cm-1). A possible explanation is that the grating in the spectrometer has unwanted optical aberrations at its edges, leading to nonideal projection of the spectrum onto the detector array. We can exclude sources of error such as small, unwanted positional changes in the grating position or a fixed computational error in data display, because such errors would produce an error for all peaks. The results for Handheld 2 do not conform to the requirements. This can be explained by a combination of unwanted optical aberrations and the instrument’s specification. It has the highest laser wavelength variation and the lowest number of detector pixels (512) of all the spectrometers tested.
Figure 3: Scatterplot comparing variation in peak position for spectrometers, with permitted variation levels indicated by the dotted and dashed lines for laboratory and handheld units, respectively.
Conclusion
We calibrated four Raman spectrometers over three wavelength regions using polystyrene as a robust and stable reference material. The results confirm the need for spectrometer calibration to ensure measurement validity and accuracy. We note that each calibration is unique to the specific instrument and we cannot infer the calibration of a group of the same instrument type from this work alone. The calibration results suggest the need to correct the x-axis in recorded spectra, which can be expressed as a polynomial function and is a topic for future work. We plan to investigate other factors that affect spectrometer calibration such as the size of the spectrometer input aperture (and any numerical aperture mismatch) and the geometry of the pixel array (including pixel width, fill factor, and number of pixels). Our results indicate the need for stable laser wavelengths (standard deviation < 150 fm) and appropriate resolution of Raman spectra and this could be considered for inclusion in future standardization.
Acknowledgments
This work was funded by the Danish Ministry for Innovation and Research (Applied Raman Spectroscopy, 2016–18). We thank the School of Pharmaceutical Sciences, Copenhagen University for the loan of a handheld Raman spectrometer and Jan C. Petersen (DFM A/S, Denmark), Thomas Rasmussen (Ibsen Photonics A/S, Denmark), and Gerard Freeman (Horiba Ltd, UK) for their helpful discussions.
References
- D.I. Ellis, D.P. Cowcher, L. Ashton, S. O’Hagana, and R. Goodacre, Analyst138, 3871 (2013).
- M.D. Hargreaves, K. Page, T. Munshi, R. Tomsett, G. Lynch, and H.G.M. Edwards, J. Raman Spectrosc.39, 873 (2008).
- C.J. Strachan, T. Rades, K.C. Gordon, and J. Rantanen, J. Pharm. Pharmacol. 59, 179–192 (2007).
- Standard Guide for Raman Shift Standards for Spectrometer Calibration, ASTM E1840 – 96 (2007), in: Annual Book of ASTM Standards, West Conshohocken, Pennsylvania.
- COST Action BM1401 - Raman4Clinics, see https://www.raman4clinics.eu/ (accessed Jan 2017).
- T.W. Bocklitz, T. Dörfer, R. Heinke, M. Schmitt, and J. Popp, Spec. Acta A149, 544–549 (2015).
- Specification for Eagle Raman-S spectrometer, Ibsen Photonics A/S website, http://ibsen.com/products/oem-spectrometers/eagle-spectrometers/eagle-raman-s/ (accessed Jan 2017).
- Specification for High Finesse WS 7UV wavemeter, http://www.highfinesse.com/en/wavelengthmeter/28/high-precision-wavelength-meter (accessed Feb 2017).
- J.B. Slater, J.M. Tedesco, R.C. Fairchild, and I.R. Lewis, in Handbook of Raman Spectroscopy, I.R. Lewis, Ed. (Marcel Dekker Inc, New York, 2001), pp. 41–144.
- D.A. Carter and J.E. Pemberston, Appl. Spectroscopy49(11), 1550–1560 (1995).
- P. Víteka, E.M.A. Alib, H.G.M. Edwards, J. Jehlicka, R. Cox, and K. Page, Spec. Acta A86, 320–327 (2012).
- European Pharmacopeia Supplement 8.7 (Strasbourg, France, 2015), chap. 2.2.48.
- Joint Committee for Guides in Metrologoy (JCGM) 100:2008 Evaluation of Measurement Data-Guide to the Expression of Uncertainty in Measurement (GUM 1995 with minor corrections).
- D.I. Bower and W.F. Maddams in The Vibrational Spectroscopy of Polymers, E.A. Davis and I.M. Ward, Eds. (Cambridge University Press, Cambridge, UK, 1992), p. 9.
- C.H. Jones and I.J. Wesley, Spec. Chim. Acta47a(9/10), 1293–1298 (1991).
- D.I. Bower and W.F. Maddams in The Vibrational Spectroscopy of Polymers, E.A. Davis and I.M. Ward, Eds. (Cambridge University Press, Cambridge, UK, 1992), pp. 194–199.
- F.A. Miller, J. Raman. Spec. 19, 219–221 (1988).
- L. Nielsen in Algorithms for Approximation IV, J. Levesley, Ed. (University of Huddersfield, Huddersfield, UK, 2002), pp. 170–186.
M.R. Pollard, S. Duraipandian, and L. Nielsen are with the Danish National Metrology Institute (DFM A/S), in Lyngby, Denmark. R. Møller-Nilsen is with Ibsen Photonics A/S in Farum, Denmark. Direct correspondence to: mp@dfm.dk

Nanometer-Scale Studies Using Tip Enhanced Raman Spectroscopy
February 8th 2013Volker Deckert, the winner of the 2013 Charles Mann Award, is advancing the use of tip enhanced Raman spectroscopy (TERS) to push the lateral resolution of vibrational spectroscopy well below the Abbe limit, to achieve single-molecule sensitivity. Because the tip can be moved with sub-nanometer precision, structural information with unmatched spatial resolution can be achieved without the need of specific labels.
Raman Spectroscopy Aflatoxin Detection Enhances Peanut Safety
March 11th 2025A research team from Jiangsu University has developed a Raman spectroscopy-based method to detect aflatoxin B1 (AFB1) in peanuts with improved accuracy and efficiency. By employing a two-step hybrid strategy integrating backward interval partial least squares (BiPLS) and variable combination population analysis (VCPA), the new model significantly enhances the precision of AFB1 detection, providing a more reliable approach for food safety monitoring.