Exploring the Unknown with Correlative Raman Imaging and Scanning Electron Microscopy
Special Issues
Confocal Raman imaging and scanning electron microscopy are techniques that are ideally suited to correlating structural and chemical information as shown here on a variety of samples.
It’s said that “seeing is believing.” Unfortunately no single imaging technique can reveal every feature of a sample because each relies on a different interaction with the material being investigated. A more comprehensive understanding can be achieved by using several techniques and correlating the results. This advantage is particularly pronounced when using methods that, on the one hand, deliver images of the morphology of a sample and, on the other hand, give information suitable for determining its molecular composition. Confocal Raman imaging and scanning electron microscopy are techniques that are ideally suited to correlating structural and chemical information as shown here on a variety of samples.
As has been demonstrated in the past, correlating morphological, molecular, and chemical properties from the same region of interest (ROI) of a complex specimen yield a much better understanding than confining oneself to studying only one of these characteristics. On the micrometer or even nanometer scale, the use of two complementary microscope technologies is the method of choice for such a thorough analysis. Over the past decade, high-performance analytical techniques relevant to correlative microscopy have come to include optical microscopy, scanning electron microscopy (SEM), atomic force microscopy (AFM), tomography, energy dispersive X-ray spectroscopy (EDS), focused ion beam (FIB), and secondary ion mass spectrometry (SIMS), among others. For example, the combination of a confocal light microscopy and electron microscopy (CLEM) has been used more, especially in cell biology, to characterize not only fixed but also living cells in great detail (1).
The combination of SEM-EDS and Raman imaging is an ideal correlative technique for many applications. It includes SEM's ability to image structural surface features of a specimen at extremely high resolution, down to 1 nm, with a remarkable depth-of-field, resulting in images of great three-dimensional (3D) structural detail. EDS, often incorporated in an SEM system, can identify the chemical elements of the sample. Additionally, Raman spectroscopy can identify the sample's molecules and their characteristics. By acquiring a Raman spectrum at every pixel of the ROI, a Raman image can be generated, visualizing the local distribution of the constituent molecules, degree of crystallinity, crystal symmetry and orientation, and stress and strain states in the sample. The resolution of this technology is diffraction limited to about 150 nm. The three technologies-SEM, EDS, and Raman imaging-are well established and robust (2,3). The development of approaches for correlative Raman imaging and SEM has been described elsewhere (4).
Materials and Methods
Since the first Raman-SEM instrument was assembled from home-built parts nearly 20 years ago, the development of Raman-SEM systems has significantly advanced to meet the requirements of scientists. Retrieving the ROI, which had long been a tedious and difficult procedure, has been made easy by locating the Raman unit within the SEM vacuum chamber and guiding it with integrated software. By automatically transferring the sample between the electron beam and the Raman microscope within the vacuum chamber, confocal Raman imaging can be performed without compromising SEM performance (5). Here, correlative Raman imaging-SEM (named RISE microscopy) was performed with several systems. In all of them, the objective and the scanning stage of a confocal Raman microscope (apyron, WITec) was located inside the vacuum chamber of the SEM. The location of the objective is offset from the SEM column, thus freeing space for other detectors that require the electron beam within the small chamber. After EDS and SEM imaging, the sample is simply transferred to the Raman measuring position using the SEM stage (Figure 1). Samples are automatically transferred from one measuring position to the other and stay within the vacuum chamber of the SEM system for the entirety of the procedure, thus streamlining the workflow and drastically improving the instrument's ease of use.
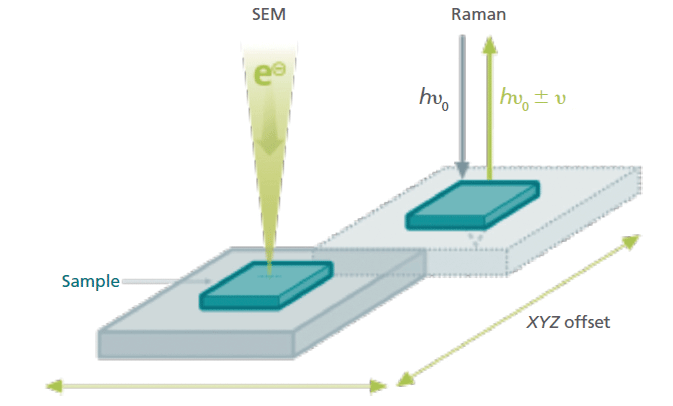
Figure 1: The principle of correlative Raman-in-SEM imaging. For easy correlation of Raman and SEM images, a setup was developed that allows Raman imaging within the vacuum chamber of a stand-alone SEM system. The samples are automatically transferred from one measuring position to the other, streamlining the workflow and drastically improving the instrument's ease of use.
Two different SEM systems (Mira, Tescan, and Sigma 300, ZEISS) were used for the analysis of cassiterite and pearl, and hematite, respectively.
The Raman systems were equipped with a spectrometer (UHTS 300, WITec), a 100x vacuum objective (N.A. 0.75) and a 532-nm excitation laser. Raman spectra were analyzed with multivariate spectral analysis methods (6).
Inspection of Cassiterite
Cassiterite (SnO2) is the main source of tin (Sn) and has been extensively studied. In this ore, Sn is often associated with other metals such as titanium (Ti), niobium (Nb), tantalum (Ta), indium (In), and tungsten (W). These elements can be identified and distinguished from SnO2 by Raman imaging. SnO2 has characteristic Raman bands at 638 and 741 relative wavenumbers (Figure 2). The inclusion of other elements as well as variations in the crystal lattice structure influences this typical spectrum. For example, the Raman band at 840 relative wavenumbers (red spectrum in Figure 2) is produced by a vibrational mode of Nb. SEM and cathodoluminescence (CL) imaging were used to determine the precise ROI, EDS identified trace elements, and the following Raman analysis showed the distribution and crystal orientations of the molecules in the SnO2 crystal (7). This example also convincingly illustrates that confocal Raman imaging can be a quick procedure: The confocal Raman image comprising 40,000 pixels was acquired in less than 1 h and displays both very high spectral sensitivity and local resolution simultaneously.
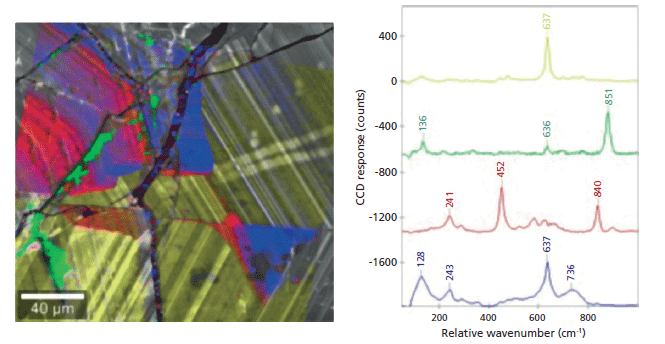
Figure 2: Raman-SEM image of cassiterite. The confocal Raman image that was generated based on the spectrum of each pixel of the ROI was superimposed onto a CL image of the same area. The Raman bands at 638 and 741 relative wavenumbers identify SnO2 while the other spectra with additional Raman bands result from additional elements and varying lattice compositions in the crystal. Raman image parameters: 200 × 200 µm2; 200 × 200 spectra, integration time of 80 ms per spectrum, 1 mW laser power.
Iron Ore Analysis
Iron ore contains many minerals, including variations of iron oxide. Thus, before processing iron ore, an extensive mineralogical characterization is required. Today, this characterization is done by optical microscopy and SEM (8). Differentiation of iron ore minerals that have similar oxygen contents with SEM is difficult. However, Raman spectroscopy can easily distinguish iron oxides from one another. Here, a piece of hematite (Fe2O3) was analyzed first with SEM, then with the integrated confocal Raman microscope as shown in Figure 3. SEM admittedly depicts some structural characteristics, but cannot differentiate between the oxides. However, the Raman spectra indicate the occurrence of several crystal forms of hematite and goethite (FeO(OH)). The distribution of these minerals is shown in the Raman image that has been overlaid onto the SEM image.
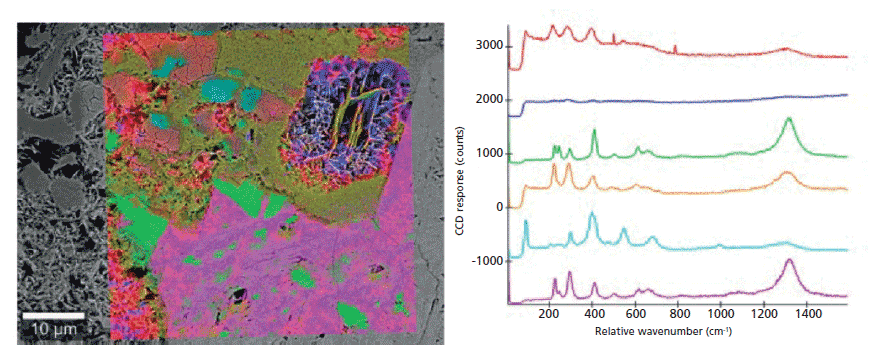
Figure 3: Raman-SEM image of hematite. The analyzed sample consists of several crystal forms of hematite (red, blue, green, orange, pink) and of goethite (light blue, cyan). The Raman image was derived from the Raman spectra acquired with the Raman microscope of the combined Raman-SEM system and overlaid onto the SEM image. Raman image parameters: 50 x 50 µm2; 150 × 150 spectra, integration time of 150 ms per spectrum, 10 mW laser power.
A Pearl's Shell
The shiny opalescence of pearls results from the mineral aragonite, an orthorhombic polymorph of calcium carbonate that is produced by a biomineralization process. This structure can be visualized with SEM. Some pearls show biomineralization defects characterized by reduced iridescence (also called "milky pearl") (9). These defects are related to the change in the mineralization form of calcium carbonate, from orthorhombic aragonite to hexagonal vaterite. Such a defect was studied with correlative Raman imaging and SEM. The crystallographic structures of the two polymorphs are indicated in the SEM image (Figure 4). The polymorphs have different Raman spectra, so they can be easily identified, imaged, and correlated with the morphology determined from the SEM data. Furthermore, small changes in relative Raman peak intensities highlight anisotropies in the aragonite phase.
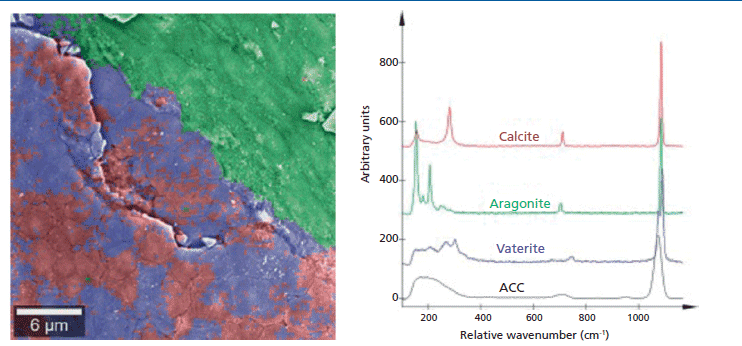
Figure 4: Raman-SEM imaging of a pearl's surface. Raman spectroscopy can differentiate not only aragonite (blue, red) and vaterite (green), two polymorphs of calcium carbonate, but also different phases of aragonite in the pearl. The image is an overlay of the SEM image of the pearl's surface with the confocal Raman image that was created from the Raman spectra at each pixel of the ROI. Raman image parameters: 40 × 40 µm2; 150 × 150 spectra, integration time of 100 ms per spectrum, 5 mW laser power.
Conclusion
Here, the feasibility and usefulness of correlative Raman imaging and scanning electron microscopy was explored on several samples, namely cassiterite, hematite, and CaCO3 polymorphic components of a pearl. All three example measurements reveal the power of Raman imaging as a complementary method to EDS in the determination of the molecular composition of minerals. The locating of trace elements in the cassiterite sample by combining confocal Raman imaging with SEM and EDS imaging is demonstrated. The sensitivity of Raman imaging to polymorphism and small changes to crystal lattice vibrations is highlighted in the measurements on iron ore and pearl. Because Raman imaging reveals the kind of molecules in a sample and their locations in detail, these chemical data can be precisely correlated with the morphological features revealed by high-resolution electron microscopy and the elemental distribution obtained by EDS.
References
(1) A.B. Mironov, J. Microsc. 235, 308–321 (2009).
(2) D. Goldstein et al., Scanning Electron Microscopy and X-Ray Microanalysis, 3rd Ed. (Springer, Heidelberg, Dordrecht, London, and New York, 2003).
(3) O. Hollricher, Confocal Raman Imaging, J. Toporski, T. Dieing, and O. Hollricher, Eds. (Springer Int. Publishing, Cham [CH], 2018).
(4) C. Cardell and I. Guerra, TrAC, Trends Anal. Chem. 77, 156–166 (2016).
(5) J. Jiruse, M. Hanicinec, M. Havelka, O. Hollricher, W. Ibach, and P. Spizig, Microsc. Microanal. 20, 990–991 (2014)..
(6) T. Dieing and W. Ibach, Software Requirements and Data Analysis in Confocal Raman Microscopy, 2nd Edition, J. Toporski, J. Dieing, and O. Hollricher, Eds., (Springer Int. Publishing, Cham [CH], 2018).
(7) G. Wille, C. Lerouge, and U. Schmidt, J. Microscopy Vol. 270, 309–317 (2018).
(8) E. Donskoi, J. Manuel, P. Austin, A. Poliakov, M. Peterson, and S. Hapugoda, Appl. Earth Sci. 122, 217–229 (2013).
(9) X.E. Bourrat, Mater. Charact. 72, 94–103 (2012).
Karin Hollricher and Ute Schmidt are with WITec GmbH in Ulm, Germany. Guillaume Wille is with BRGM in Orleans, France. Direct correspondence to: Ute.Schmidt@WITec.de

Best of the Week: AI and IoT for Pollution Monitoring, High Speed Laser MS
April 25th 2025Top articles published this week include a preview of our upcoming content series for National Space Day, a news story about air quality monitoring, and an announcement from Metrohm about their new Midwest office.
LIBS Illuminates the Hidden Health Risks of Indoor Welding and Soldering
April 23rd 2025A new dual-spectroscopy approach reveals real-time pollution threats in indoor workspaces. Chinese researchers have pioneered the use of laser-induced breakdown spectroscopy (LIBS) and aerosol mass spectrometry to uncover and monitor harmful heavy metal and dust emissions from soldering and welding in real-time. These complementary tools offer a fast, accurate means to evaluate air quality threats in industrial and indoor environments—where people spend most of their time.