Halogenated Organic Compounds
Almost all of the compounds whose spectra we have discussed so far in this column series have contained carbon, hydrogen, oxygen, and nitrogen only. However, there are a number of important compounds that contain other elements that are still considered organic, such as halogenated organics. In this column, we will discuss the spectra of halogenated compounds generally, then specifically discuss the spectra of some common halogenated polymers.
This review may seem ridiculously basic for a magazine perused by chemists and physicists, but bear with me here, as a refresher has never hurt anybody. The current form of the Periodic Table of the Chemical Elements is seen in Figure 1. The table is periodic because the properties of the chemical elements repeat themselves. For example, the left-most column containing lithium, sodium, and potassium, otherwise known as the alkali metals (hydrogen is a special case and will be ignored here), are all shiny reactive metals at room temperature that tend to give up electrons during chemical reactions and form ions with a +1 charge. In the Periodic Table, the elements to the left and below are metals, and the elements to the right and above are non-metals. So far, in the many years I have been writing this column,
almost all the compounds we have discussed were organics and contained the non-metals carbon, hydrogen, nitrogen, and oxygen.
FIGURE 1: The Periodic Table of the Elements. Figure courtesy of Thermo Fisher Scientific.
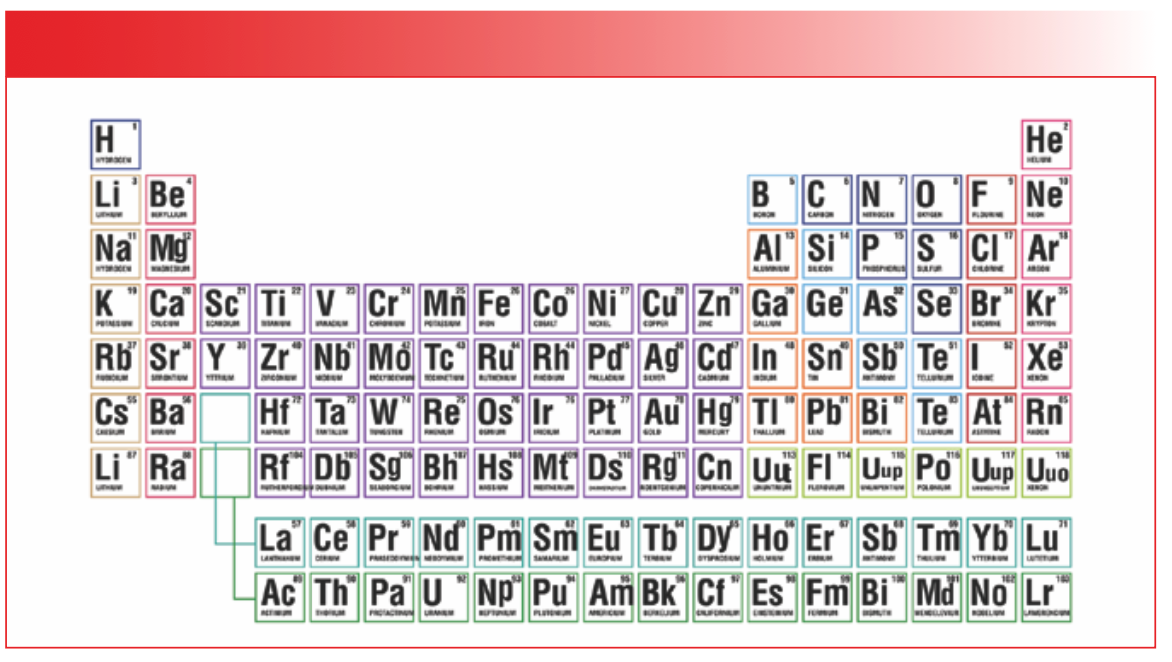
Note that to the far right of the periodic table, there is a column of elements containing fluorine, chlorine, bromine, and iodine. These are called the halogens, from the Greek words for “salt forming.” Halogens tend to gain electrons during chemical reactions and are normally quite electronegative. The most electronegative element, fluorine, is a halogen. Our focus here will be the first four members of the halogen family – fluorine, chlorine, bromine, and iodine – because they are the halogens most commonly found in organic compounds.
Halogenated Organics and Their Infrared Spectra
Carbon forms stable bonds with fluorine (F), chlorine (Cl), bromine (Br), and iodine (I). In the ensuing discussion, I will sometimes use the letter “X” to stand for any or all of these four elements. Thus, the phrase “C-X bonds” refers to C-F, C-Cl, C-Br, and C-I bonds. The atomic masses of these four elements, rounding for simplicity, are fluorine at 19, chlorine at 35, bromine at 80, and iodine at 127. Recall (1) that the peak positions in infrared spectra depend upon force constant and atomic mass, as given by equation 1:
W = (1/2πc)(k/MR)1/2 [1]
where W equals peak wavenumber position in cm-1, c equals the speed of light, k equals force constant, and MR equals reduced mass, as given by equation 2:
MR = (M1M2)/(M1+M2) [2]
where MR equals reduced mass, M1 equals mass of atom 1 in a chemical bond, and M2 equals mass of atom 2 in a chemical bond.
Note in equation 1 that reduced mass is in the denominator, so as the mass of the atoms in a chemical bond goes up, peak position goes down, which we have referred to before as a mass effect (1). This phenomenon should then hold true for C-X bonds; we would expect the C-X stretching vibration peak positions to go in the order C-F > C-Cl >C-Br > C-I. This turns out to be true, as illustrated by the spectra in Figure 2.
FIGURE 2: Infrared spectra from top to bottom: (a) polytetrafluoroethylene (Teflon) or [CF2]n; (b) methylene chloride or CH2Cl2; (c) methylene bromide or CH2Br2; and (d) methylene iodide or CH2I2. The spectra displayed have been expanded to show the 1300 to 500 cm-1 region.
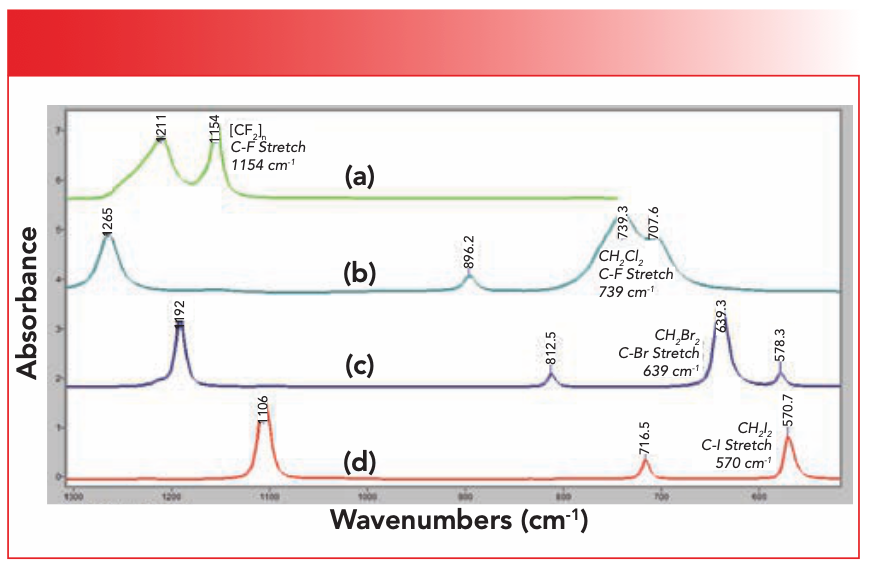
The spectra in Figure 2 from top to bottom are of polytetrafluoroethylene (Teflon) or [CF2]n in green, methylene chloride or CH2Cl2 in aqua, methylene bromide or CH2Br2 in blue, and methylene iodide or CH2I2 in red. The spectra displayed have been expanded to show the 1300 to 500 cm-1 region.
These four spectra are good examples, as each of them contains the CX2
functional group.
Note that the spectra are in order of increasing halogen mass from top to bottom. As we go from a C-F stretch at the top to a C-I stretch at the bottom, we see that Teflon’s C-F stretch is at 1154 cm-1 (all peak position going forward will be in cm-1, even if not so noted), methylene chloride’s C-Cl stretch is at 739, methylene bromide’s C-Br stretch is at 639, and methylene iodide’s C-I stretch is at 570. Thus, C-X stretches obey equation 1; as the atomic mass of the halogen goes up, the peak position goes down.
The spectrum of the common halogenated solvent chloroform is seen in Figure 3. The C-Cl stretch here is at 758, similar to that of CH2Cl2 at 739. Chloroform is a common organic solvent, and was one of the first substances ever used as an anesthetic.
FIGURE 3: The infrared spectrum of chloroform (CHCl3).
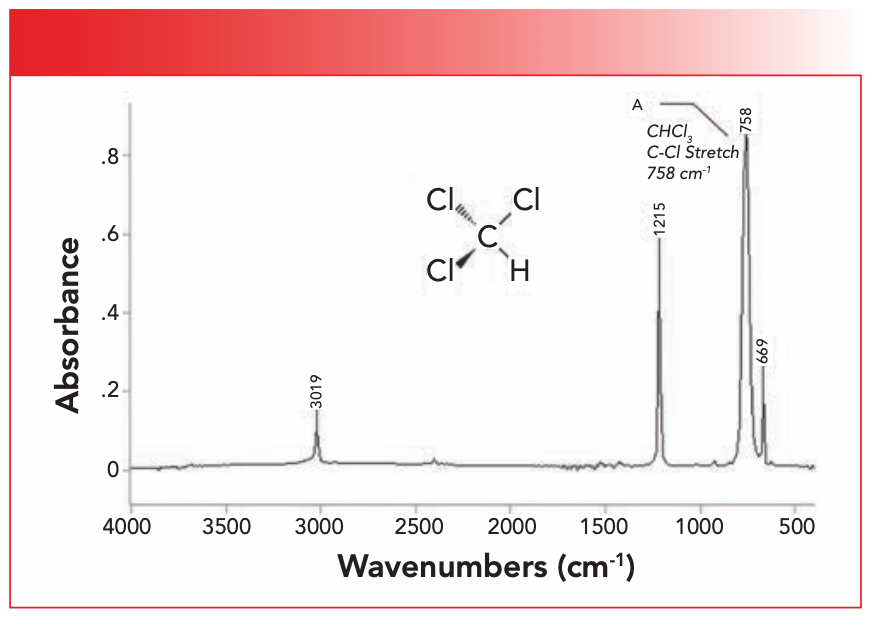
Note from Figure 2 that all C-X stretches are at relatively low wavenumbers. Note from Figure 3 that the C-Cl stretch here is quite intense. Recall (1) that infrared peak intensities depend upon (dµ/dx)2, the change in dipole moment with respect to distance during a vibration. C-X stretches are generally intense because C-X bonds tend to have large dipole moments due to the electronegativity differences between carbon and the halogens.
Table I shows the peak position ranges for C-X stretches. The good news in Table I is that C-X stretching ranges follow equation 1 as expected, with the C-X stretching peak position ranges going down as halogen mass goes up. However, the bad news is that there is significant overlap in some of the ranges in Table I. Specifically, if a C-X stretch falls between 650 and 600, it could be from a C-Cl or C-Br bond, and if a C-X stretch falls between 570 and 550, it could be a C-Br or C-I bond. In a perfect world, Table I would be unambiguous, and we could use C-X stretches to tell us what halogen is present in an organic compound. As it turns out, Table I works sometimes, but not all of the time. This occasionally limits our ability to determine the halogens present in a sample from infrared spectroscopy by itself. In cases where Table I is ambiguous, other analytical methods such as mass spectrometry may be needed to determine the halogens present in a halogenated organic compound.

Halogenated Polymers
The last 13 columns (2–14) have been devoted to the infrared spectra of polymers. It has taken us almost three years to cover this topic.
This is justified because, in my experience, the analysis of polymers is the most common application of infrared spectroscopy (15). However, it is about time to wrap up the “analysis of polymers” topic. I present here what will be the last spectra of polymers we will discuss, at least for a while.
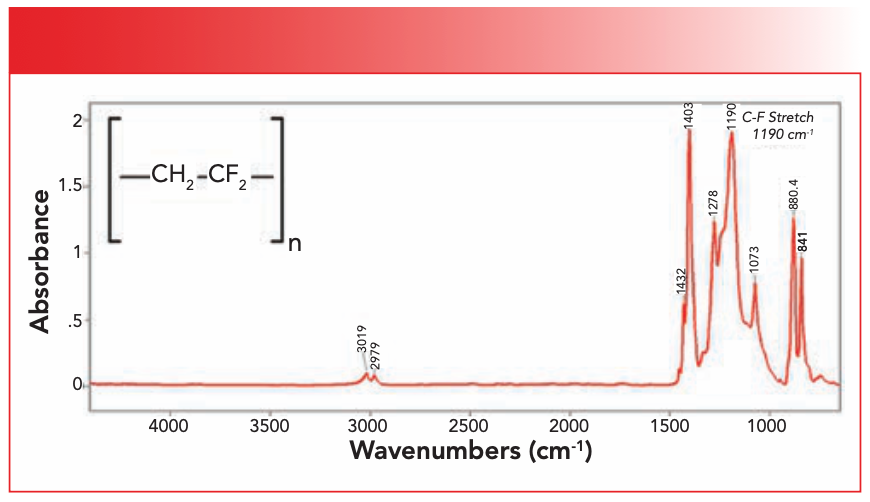
Figure 4 shows the spectrum of polyvinylidene fluoride. This polymer is sold under tradenames Kynar and Hylar, and is made into wire coatings and durable paints. The C-F stretch for this polymer is seen at 1190, as noted in the figure. As is typical for a C-X stretch, this peak is intense and at a relatively low wavenumber.
FIGURE 4: The infrared spectrum of polyvinylidene fluoride.
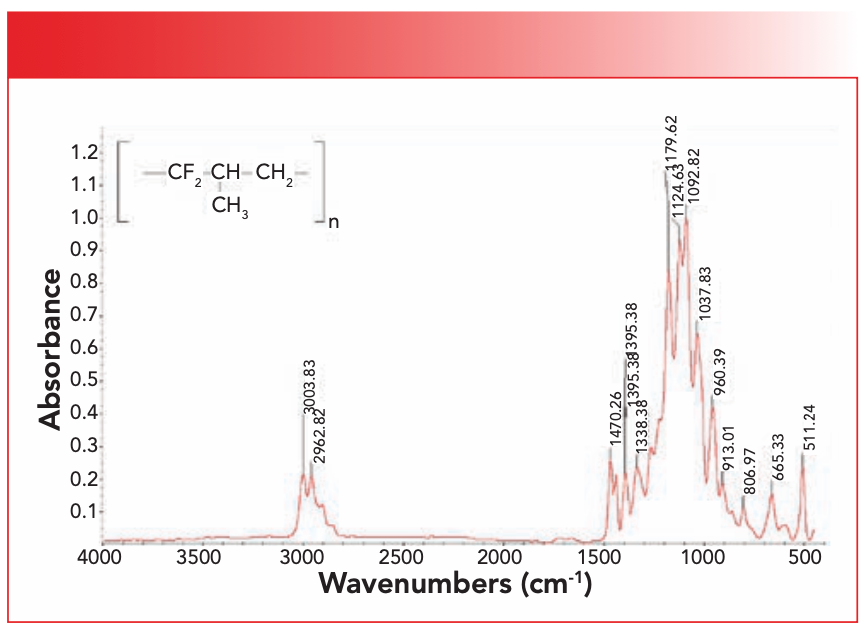
The vitons are a family of elastomers that contain fluorine (16). Widely used as gaskets, sealants, and O-rings, the stability of the C-F bonds lends them good chemical resistance. The spectrum of a viton (in this case a co-polymer of tetrafluoroethylene and propylene) is seen in Figure 5. The series of peaks between 1200 and 1000 are assignable as C-F stretching vibrations.
FIGURE 5: The infrared spectrum of a Viton co-polymer, made from tetrafluoroethylene and propylene.
Weird C-H Stretches
As previously mentioned, every rule I teach about infrared spectral interpretation has exceptions. One of the best rules I have taught you is that saturated carbons, including methyl (CH3), methylene (CH2), and methine (C-H) groups have C-H stretching peaks below 3000 (17). I also stated that unsaturated carbons including alkenes (C=C), alkynes (C≡C), and aromatic rings have C-H stretching peaks above 3000 (17). This is where I make a liar out of myself. Take a look at Figure 6, which shows the infrared spectra of three compounds in Figure 2 (methylene chloride [CH2Cl2], methylene bromide [CH2Br2], and methylene iodide [CH2I2]), but expanded from 4000 to 400. The Teflon spectrum has been left out because it lacks C-H bonds. These compounds contain saturated carbons, yet methylene chloride has a C-H stretch at 3054, methylene bromide has one at 3065, and methylene iodide has one at 3046. Additionally, in Figure 3, chloroform has a C-H stretch at 3019, Figure 4 shows that vinylidene chloride also has a C-H stretch at 3019, and our viton polymer in Figure 5 has a C-H stretch at 3003.
FIGURE 6: The infrared spectra of (a) methylene chloride (CH2Cl2); (b) methylene bromide (CH2Br2); and (c) methylene iodide (CH2I2) displayed from 4000 to 400 cm-1.
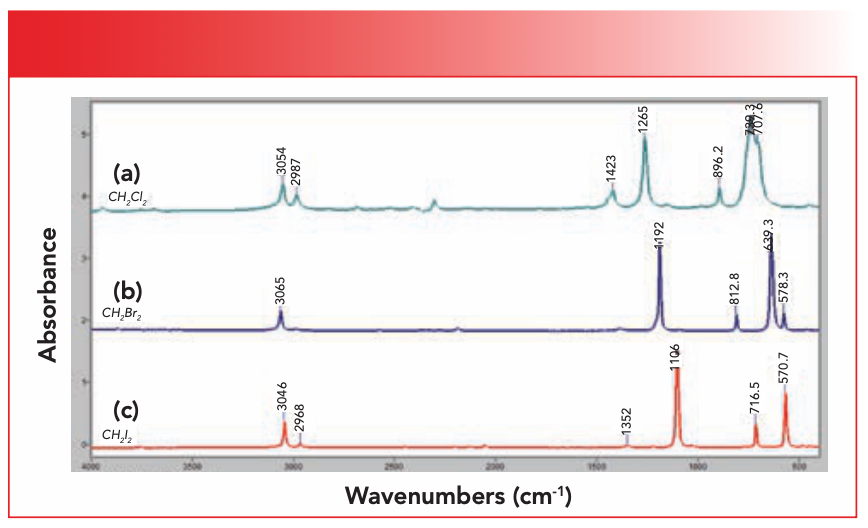
What’s going on here? I wish I knew. My perusal of the literature has not yielded any satisfactory answers. It is possible that the presence of electron withdrawing groups, such as the halogens on a carbon atom, messes with the force constant of the C-H bonds attached to that carbon, thus altering the expected C-H stretching peak position.
Conclusion
In addition to C, H, N, and O, organic compounds can contain the highly electronegative elements that are the main halogens – fluorine (F), chlorine (Cl), bromine (Br), and iodine (I). The infrared spectra of carbon halogen or C-X bonds are characterized by intense and low wavenumber C-X stretching vibration peaks. The ranges for C-X stretching peaks go down as the mass of the halogen goes up, as seen in Table I. However, the ranges for some of these peaks overlap, sometimes limiting our ability to identify halogens in a compound by infrared spectroscopy alone. The presence of halogens on carbon atoms also containing C-H bonds can cause the C-H stretching peaks to appear higher than expected. It is possible that the presence of electron withdrawing groups such as the halogens on a carbon atom messes with the force constant of the C-H bonds attached to that carbon, thus altering the expected C-H stretching peak position.
References
(1) Smith, B. C. IR Spectral Interpretation Workshop. Spectroscopy 2015, 30 (1), 16–23.
(2) Smith, B. C. The Infrared Spectra of Polymers, Part I: Introduction. Spectroscopy 2021, 36 (7), 17–22.
(3) Smith, B. C. The Infrared Spectra of Polymers II: Polyethylene. Spectroscopy 2021, 36 (9), 24–29. DOI: 10.56530/spectroscopy.xp7081p7
(4) Smith, B. C. The Infrared Spectra of Polymers III: Hydrocarbon Polymers. Spectroscopy 2021, 36 (11), 22–25. DOI: 10.56530/spectroscopy.mh7872q7
(5) Smith, B. C. The Infrared Spectra of Polymers IV: Rubbers. Spectroscopy 2022, 37 (1), 8–12. DOI: 10.56530/spectroscopy.mz6968v1
(6) Smith, B. C. The Infrared Spectra of Polymers V: Epoxies. Spectroscopy 2022, 37 (3), 17–19. DOI: 10.56530/spectroscopy.mg2473z4
(7) Smith, B. C. The Infrared Spectra of Polymers, VI: Polymers With C-O Bonds. Spectroscopy 2022, 37 (5), 15–19, 27. DOI: 10.56530/spectroscopy.ly3071f5
(8) Smith, B. C. The Infrared Spectra of Polymers, VII: Polymers with Carbonyl (C=O) Bonds. Spectroscopy 2022, 37 (8), 10–13. DOI: 10.56530/spectroscopy.tz9280y5
(9) Smith, B. C. Infrared Spectroscopy of Polymers, VIII: Polyesters and the Rule of Three. Spectroscopy 2022, 37 (10), 25–28. DOI: 10.56530/spectroscopy.ta9383e3
(10) Smith, B. C. Infrared Spectroscopy of Polymers, IX: Pendant Ester Polymers and Polycarbonates. Spectroscopy 2022, 37 (11), 16–19, 31. DOI: 10.56530/spectroscopy.xn9369p8
(11) Smith, B. C. Infrared Spectroscopy of Polymers X: Polyacrylates. Spectroscopy 2023, 38 (1), 10–14. DOI: 10.56530/spectroscopy.mi9381w4
(12) Smith, B. C. Infrared Spectroscopy of Polymers, XI: Introduction to Organic Nitrogen Polymers. Spectroscopy 2023, 38 (3), 14–18. DOI: 10.56530/spectroscopy.vd3180b5
(13) Smith, B. C. Infrared Spectroscopy of Polymers XII: Polyaramids and Slip Agents. Spectroscopy 2023, 38 (5), 16–18. DOI: 10.56530/spectroscopy.np7466n5
(14) Smith, B. C. Infrared Spectroscopy of Polymers XIII: Polyurethanes. Spectroscopy 2023, 38 (7), 14–16. DOI: 10.56530/spectroscopy.fn3378a3
(15) Smith, B. C. Infrared Spectral Interpretation: A Systematic Approach; CRC Press, 1999.
(16) Viton High-Performance Fluoroelastomers. https://www.viton.com/en (accessed 2023-08-21)
(17) Smith, B. C. The Infrared Spectroscopy of Alkenes. Spectroscopy 2016, 31 (11), 28–34.
Brian C. Smith, PhD, is the founder and CEO of Big Sur Scientific, a maker of portable mid-infrared cannabis analyzers. He has over 30 years experience as an industrial infrared spectroscopist, has published numerous peer-reviewed papers, and has written three books on spectroscopy. As a trainer, he has helped thousands of people around the world improve their infrared analyses. In addition to writing for Spectroscopy, Dr. Smith writes a regular column for its sister publication Cannabis Science and Technology and sits on its editorial board. He earned his PhD in physical chemistry from Dartmouth College. He can be reached at: SpectroscopyEdit@MMHGroup.com ●


AI Shakes Up Spectroscopy as New Tools Reveal the Secret Life of Molecules
April 14th 2025A leading-edge review led by researchers at Oak Ridge National Laboratory and MIT explores how artificial intelligence is revolutionizing the study of molecular vibrations and phonon dynamics. From infrared and Raman spectroscopy to neutron and X-ray scattering, AI is transforming how scientists interpret vibrational spectra and predict material behaviors.
Real-Time Battery Health Tracking Using Fiber-Optic Sensors
April 9th 2025A new study by researchers from Palo Alto Research Center (PARC, a Xerox Company) and LG Chem Power presents a novel method for real-time battery monitoring using embedded fiber-optic sensors. This approach enhances state-of-charge (SOC) and state-of-health (SOH) estimations, potentially improving the efficiency and lifespan of lithium-ion batteries in electric vehicles (xEVs).
New Study Provides Insights into Chiral Smectic Phases
March 31st 2025Researchers from the Institute of Nuclear Physics Polish Academy of Sciences have unveiled new insights into the molecular arrangement of the 7HH6 compound’s smectic phases using X-ray diffraction (XRD) and infrared (IR) spectroscopy.