Heterocorrelation Using Polarized Raman Spectra in the Characterization of Polymers
Spectral changes revealed by two-dimensional correlation spectroscopy can be used to interpret structural changes in polymers determined by processing conditions, so that materials can be rationally engineered for particular applications with known mechanical requirements.
This edition of "Molecular Spectroscopy Workbench" discusses the use of two-dimensional Raman correlation spectroscopy (2D-COS) in the characterization of polymer fibers. We will show how the heterocorrelation of polarized spectra of a polyethylene terephthalate (PET) provides another means to characterize the changes in the local bonding of the atoms in the polymer that are extracted from the orientation dependence of the spectra. We will use again the spectra of PET fibers, because the spectral bands of this polymer have been extensively interpreted so that the 2D correlations can be used to analyze the structural changes without the need to employ band-fitting, which is known to sometimes produce non-unique results. In particular, the 2D-COS algorithms will enable us to identify which changes occur simultaneously (either in the same direction or in the opposite direction), and which changes occur non-simultaneously or sequentially, and which changes are necessary in order for the polymer to crystallize. At the end, we will note how this information can be useful to polymer engineering.
We have previously described the use of two-dimensional Raman correlation spectroscopy (2D-COS) in the analysis of PET fibers (1), and a melt-quenched pellet (2). In the case of the fibers, we examined only the behavior of the ZZ spectra (both laser and Raman light polarized along the fiber axis), and for the melt-quenched pellet, which will not exhibit any orientation, there was no polarization analysis. For this column, we will look at the ZZ vs. RR components (polarizations parallel to vs. normal to the fiber axis) in heterospectral analysis. It is important to keep in mind that the intensities in the 2D-COS plots are related to changes in the spectra with temperature, and not to the intensities themselves.
Preparation of Spectra for Analysis
When Raman spectra are used for any kind of quantitative work, it is necessary to introduce a protocol for "normalizing" the spectra. Unlike infrared (IR) or ultraviolet–visible spectroscopy (UV–Vis) absorption spectroscopy, Raman spectroscopy is a single beam technique, so the spectral intensities can only be compared under well-defined conditions. Initially, I chose to normalize to the strongest feature in the spectrum, the aromatic band near 1614 cm-1. But, because we would be using both the ZZ and RR spectra, and it is known that the ratio of this band increases when the fiber becomes oriented (3,4), we considered the possibility that this might not be the best method. Instead, we decided to normalize all spectra (in both the ZZ and RR sets) to the band at 632 cm-1, which is known to be depolarized (4,5). In fact, if you examine the spectra of the fibers that we measured in the early 1980s, you can see that the intensities of both the 800 and 632 cm-1 bands were higher in the off-diagonal configuration (ZR) than either of the diagonal configurations (ZZ or RR) confirming their Bg character (4).
Normal Modes Analysis in PET-Identifying the Atomic Motion in the Raman Bands
Numerous authors have performed normal modes analysis of PET on which we will rely. The earliest ones were published starting in the early 1970s (3,5,6,7,8 and 10).
Definition of Crystallinity in PET
The crystalline phase of a polymer will have all of its chains in the same conformation and orientation, and all the chains will exhibit translational symmetry. Spectroscopically, this state can be measured definitively by measuring the "phonon" mode in the very low frequency region that is attributed to the chains beating against each other in the unit cell. But this condition requires that there is more than one chain in the unit cell, which is not the case with PET (9). On the other hand, the chemical unit in PET contains two carbonyl units at the para positions across the aromatic ring, so their motion has the potential to interact providing two component bands; in the centrosymmetric crystalline form, the symmetric combination will be Raman active and the anti-symmetric component will be IR active. The best measure of crystallinity of which we are aware is the behavior of the carbonyl peak, which is known to sharpen in the crystalline phase (10) as determined by X-ray diffraction (XRD). This sharpening is attributed to resonance stabilization of the π electrons between the carbonyl and the aromatic ring. In fact, when we band-fit this spectral line in the amorphous phase, we find that we can fit to two fairly broad lines; in the amorphous phase, both the symmetric and the asymmetric combination will be Raman active. The band-fitted spectrum of an amorphous fiber is shown in the bottom spectrum in Figure 1, assigning the lower frequency band to the asymmetric combination, and the higher frequency band to the symmetric combination. After the fiber was drawn at RT, the intensity of the lower frequency band grows relative to the higher band, and its frequency shifts up towards the frequency seen in the crystalline phase. This change suggests that the drawing of the fiber has oriented the chains, which requires that the gauche configurations around the single bonds (C-C and C-O) are effectively eliminated; the lower frequency band is now close in frequency to that of the crystalline phase (as we shall see later), but much broader because of the rotational freedom around the single bonds. In the partially crystalline material (Figure 1, 3rd spectrum from the bottom) there are three bands in the fitted spectrum; we assign the lowest and highest frequency bands to the asymmetric and symmetric carbonyl stretches to the cis configuration in the amorphous phase, and the middle band to the symmetric combination when the carbonyls are trans to the ring. This positioning would be the configuration in the crystal form, but because of the heterogeneity of the angle between the carbonyls and the plane of the ring, the band is broad. When this fiber is drawn at RT, the lowest frequency band disappears and then two overlapping bands around 1727 cm-1 appear. Because the lowest frequency band is presumably the asymmetric combination of carbonyl stretches (that is the IR type band in the amorphous phase), and the drawing operation eliminates the cis configuration, this combination becomes less Raman active, and is replaced by a more intense broad band at 1727 cm-1, well resolved from the small sharper contribution from the "crystalline" trans component. In addition, the intensity of the highest frequency band drops significantly after drawing as the number of carbonyls oriented randomly to the aromatic plane decreases.
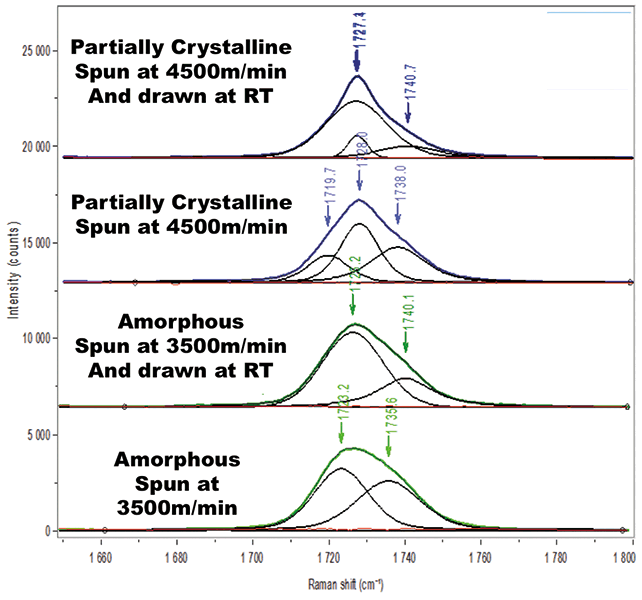
Figure 1: Band-fitted ZZ spectra (from bottom to top) of amorphous fiber spun at 3500m/min, same fiber drawn at room temperature, fiber spun at 4500m/min (partially crystalline), and then the same fiber drawn at RT.
While it is possible to put together a story based on this band-fitting, the possibility to derive similar information from 2D-COS is very attractive. In particular, these features that can only be separated spectroscopically by band-fitting are expected to be apparent in the 2D-COS plots without special spectral treatment. In addition, by determining which other features correlate with which of these carbonyl bands, one can infer which changes in the molecular conformation of the entire chain determine the appearance of the different contributions to the carbonyl envelope. Remember that in examining the 2D-COS results, higher intensity means larger changes in intensity, and not higher spectral intensity.
We have chosen to explore the 2D-COS of the two components of the polarized spectra, because it is clear from previous work that information is encoded in the polarization/orientation dependence.
Description of Measurements
We have a series of polarized Raman spectra of a PET fiber immobilized in a chuck in the Linkam tensile stage, and then measured as the temperature was raised. As described earlier, we normalized all spectra to the asymmetric band at 632 cm-1. We performed 2D-COS separately on the ZZ spectra, then the RR spectra, and then on the ZZ spectra against the RR spectra. It will be immediately clear that the different plots are indicating that different information is provided.
Figure 2 shows the ZZ and RR spectra of the fiber held in the chuck and measured at 40 °C (bottom) and 100 °C (top). It is known that the response of the instrument will be better when the light is polarized normal to the grating grooves, which means normal to the slit, so a scrambler is mounted between the microscope and the entrance slit for all measurements to correct for the grating dichroism. A half wave plate was mounted in the laser entry path in order to control the orientation of the laser polarization. Because there can be some drift during the time that the temperature is raised, the alignment was checked routinely, but, just as importantly, all spectra were normalized so that the intensity in the 632 cm-1 band was identical in all spectra.
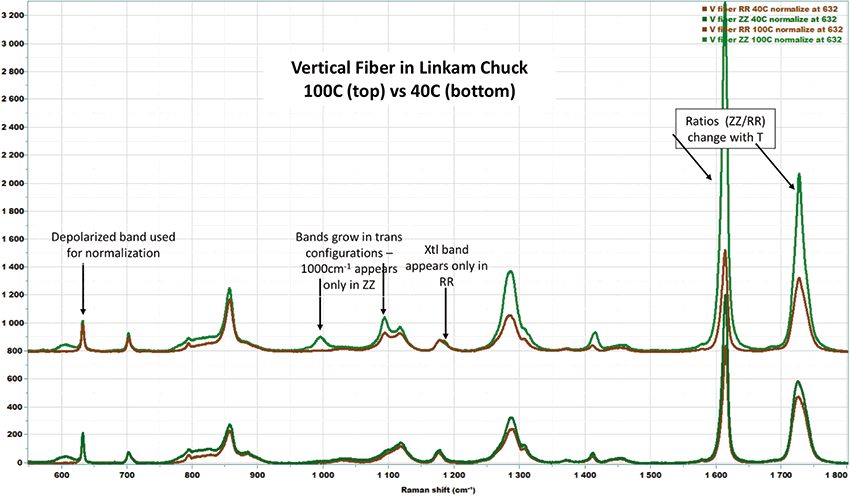
Figure 2: Polarized Raman spectra of a fiber of PET held in a chuck in a Linkam tensile stage at 40 °C (bottom) and 100 °C (top). In each case, the ZZ spectrum (colored green) has higher intensity in almost all bands (the RR spectrum is colored brown in order to differentiate the two).
We will focus on the following features in these spectra when we examine the 2D-COS plots:
- The carbonyl band sharpens in the crystalline phase, as discussed earlier. We will look to see if we can detect the 3 components discussed in the band-fitted spectra earlier.
- The band at 1175 cm-1 seems to broaden in the crystalline phase, but, in fact, is shifting to a higher frequency; the crystalline component is seen spectrally only in the RR spectrum but in the 2D-COS there is evidence for it in ZZ as well.
- In all spectra, there is a band at about 1124 cm-1, with close to the same intensity in the ZZ and RR plots, but there is a shoulder at 1096 cm-1 in the spectra of the amorphous material that grows in intensity in the high temperature spectrum, with the ZZ intensity surpassing that of the RR.
- There is a band near 1030 cm-1 of approximately equal intensity in the bottom ZZ and RR spectra of Figure 2, but, in the higher temperature spectra, there is a band of medium intensity at about 1000 cm-1 in the ZZ spectrum, but no intensity is present in the RR spectrum.
These features are indicated on Figure 2.
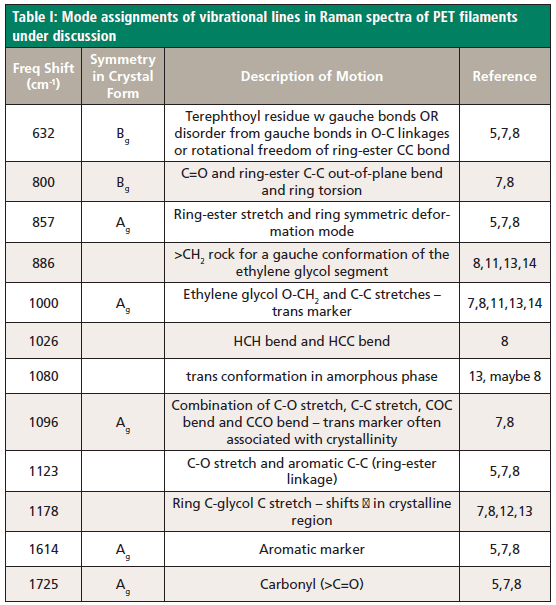
In order to make the reading of this work easier, I will tabulate assignments of some bands that have been associated with morphological changes in PET (5,6,7,8,11,12,13,14) (Table I). In fact, critical to this work is the understanding that the local conformations determine the ability to orient, and then crystallize, and this point has been considered in some detail by many of the cited authors (and is implicit in the earlier discussion). In the crystalline form, the two >C=O groups must be trans to the ring and coplanar with it, but in the amorphous form can be at any orientation to the ring. Because the C-C and C-O single bonds have the freedom to rotate, gauche and trans conformers of the glycol unit can be defined around O or C atoms, and are best described in Figure 1 of Rodriguez-Cabello and associates (13), who followed the behavior of several spectral features as a function of annealing temperature, and found that only above the glass transition temperature, Tg (ca. 90 °C), were isomeric transformations (gauche to trans) observed. The hope is that the 2D-COS will elucidate this behavior with much reduced effort.
2D-COS Results
Because there is so much information in these results, I am going to show 2D-COS plots only for two regions of the spectra in which some bands discussed above will be shown. The region between 1500 and 1800 cm-1 includes information on the aromatic ring and the carbonyl band. The region between 950 and 1250 cm-1 has information on the single bond stretches and 3-atom bends in the glycol region of the molecule. Keep in mind that it is this region that will change during alignment (during melt-spinning or drawing or annealing under stress). I will show both the synchronous and asynchronous plots for these regions.
In order to extract more insight into the behavior of this material, Figure 3 will show the 2D-COS plots (both synchronous and asynchronous) for the ZZ vs. ZZ spectra (left), the RR vs. RR spectra (middle), and then the ZZ vs. ZR (right) in the aromatic/carbonyl region (top), and in the region of the carbon-carbon and carbon-oxygen single bond stretches and bends (bottom). For each set, the plots on the left are the synchronous plots, and those on the right are the asynchronous plots. Note that red means an increase in signal, and blue a decrease. The three sets of plots are showing very different behavior, and these differences have specific information in them. We will comment on some of what the ZZ vs. ZZ and RR vs. RR plots say, and then focus on the ZZ vs RR.
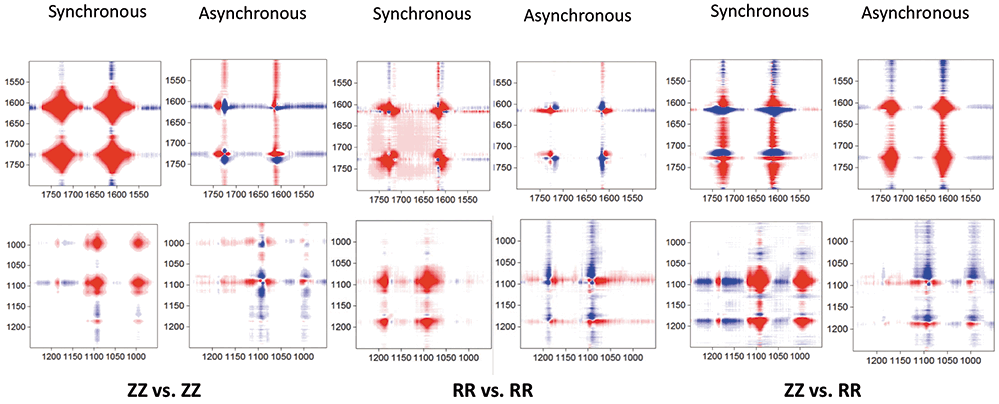
Figure 3: 2D-COS plots of ZZ vs. ZZ (left), RR vs. RR (middle) and ZZ vs. RR (right). For each, the Synchronous is plotted to the left of the Asynchronous. The top set of plots show the aromatic/carbonyl region, and the bottom set of plots show the region of single bonds (C-C and C-O). The ZZ vs. RR plots will be reproduced in Figure 4 with the matching spectra for the discussion.
ZZ vs. ZZ
We know that the largest changes in the spectra are occurring in the 1575-1750 cm-1 region, which is what the synchronous plot shows. In fact, any attempt to change the intensity scale did not yield more detail. The asynchronous plot does provide some information. Both the 1735 cm-1 (symmetric combination) and the 1720 cm-1 (asymmetric combination) parts of the carbonyl band in the amorphous phase decrease before the 1725 cm-1 part (crystalline) goes up.
In the region of the single bonds, the synchronous plot shows bands at ~1095 cm-1 and 998 cm-1 that grow simultaneously; both of these bands are associated with oriented or crystalline material. Curiously, we do not see a decrease in the 1030 cm-1 band, something that I have observed in the spectra themselves, and was surprised by, because I was assuming that the 998 cm-1 band was replacing the 1030 cm-1 band; apparently this is not so, but is consistent with the band assignments–one band being a stretch, and one a bend. In the asynchronous plot in the region around 1100 cm-1, we see something useful. Features at 1098 cm-1 and 1080 cm-1 are out of phase; we have noted previously that a small feature at 1080 cm-1 is observed as the fibers are orienting. Here, we see that this band disappears as the more prevalent 1098 cm-1 band appears!
RR vs. RR
In the synchronous plot, here, too, the 1614 cm-1 band is increasing the fastest (but not as fast as in the ZZ plot, which this display does not show because the color intensities are not equivalent). In addition, we see a loss of a small feature at the lower frequency, which can be seen in the original data (Figure 2). The carbonyl region shows a complicated behavior, due to different behaviors of the three components. Some of this can be sorted in the asynchronous plot. The central part of the band at 1725 cm-1 is growing (red in the synchronous plot), while 1720 and 1735 cm-1 are changing before 1725 cm-1, and the changes of the 1720 cm-1 are much greater (our earlier discussions indicated that this band, the asymmetric stretch of the two carbonyl bands, largely disappears as the polymer chain orients).
In the region of the single bonds, the synchronous plot shows an increase at 1095 cm-1, and another at 1178 cm-1. The 1095 cm-1 blob even shows some filling in near 1080 cm-1, which would be the feature that was discussed earlier in the ZZ discussion. The band at 1178 cm-1 appears here in the RR plot, but not in the ZZ plot. There is no intensity in the region of the 1030 or 1124 cm-1 bands in either the RR or ZZ synchronous plots; this observation implies that these bands represent molecular motion that is not sensitive to conformation changes in the oriented or crystalline forms. In the 1175 cm-1 region, the lower energy band changes before the higher energy band (that is, there is a shift from low frequency shift to high frequency shift). In the region below 1100 cm-1, the 1080 cm-1 band changes before the 1098 cm-1 blob in the synchronous plot. Examination of the 1175/1180 cm-1 pair indicates that these two features behave oppositely when compared to the 1098 cm-1 band, confirming the coupling of these bands in the crystalline conformation.
ZZ vs. RR
Curiously, the point at (1615, 1615) cm-1 in the synchronous plot is blue (negative). That is because as the ZZ intensity is increasing, the RR intensity is going down. The intensity of the crystalline phase at (1725, 1725) cm-1 is increasing (red), while that at (1725, 1720) cm-1 is blue, which means that the amorphous RR contribution is decreasing relative to the ZZ.
Again, in the synchronous plot in the region around 1030 cm-1, there is no intensity, because this band is apparently not changing. But the increase at 998 cm-1 is highly correlated with 1095 cm-1, which is consistent with what we have seen so far, even though we are comparing the two polarization conditions. The point at (1185, 1185) cm-1 is surprisingly also positive, which means that even though we did not see ZZ intensity in the ZZ vs. ZZ plot, there is apparently some activity here. The positive intensity at (1185, 1090) cm-1 is again consistent with the 1185 cm-1 crystal band, correlating with the 1090 cm-1 band that is present in both the crystalline and the oriented form. It would be interesting to acquire and analyze spectra of an amorphous material with increasing orientation. The point at (995, 1185) cm-1 also shows a strong correlation between the two polarizations.
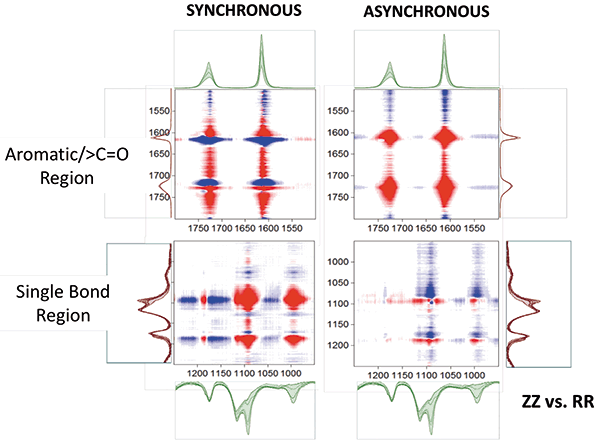
Figure 4: 2D-COS plots of ZZ vs. RR in the same spectral regions shown in Figure 3. This figure also superimposes the spectra that are being used in the calculation.
Here's where I am getting to the edge of my 2D-COS skills, which I am only learning "on the fly". But I am convinced that the conformations of different functional groups have to be coupled in order to first get full orientation of the chain and then crystallization, so let me give this a try. The (1725, 1095) cm-1 point on the top left of Figure 5 indicates a positive coupling between these two bands in which we examine the coupling between the two different regions in the ZZ vs. RR plots. But the (1095, 1725) cm-1 point on the bottom left is much sharper, indicating that the change is much more confined spectrally. In addition, there is a negative band at (1075-1120, 1715) cm-1, indicating the decrease of the asymmetric carbonyl combination at 1715 cm-1 in the RR spectrum relative to the increasing carbonyl at about 1725 cm-1. There is a surprising correlation at (1095, 1600) cm-1; I say it's surprising because we don't really see a spectral feature at 1600 cm-1 (the small band that can be seen in Figure 2 is closer to 1580 cm-1). And then there is a negative band at (1067-1125, 1615) cm-1, which means that, relative to the ZZ growth between 1067 and 1125 cm-1, there is a decrease in the 1615 cm-1 signal in RR.
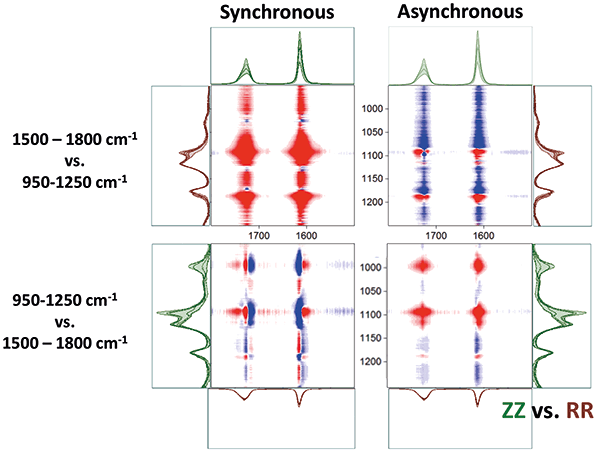
Figure 5: Synchronous and Asynchronous plots of ZZ vs. RR comparing the two regions of interest: the aromatic/carbonyl region (1500-1800 cm-1) to the single bond region (950-1250 cm-1). Note that two comparisons are necessary because the exchange of spectral regions yields different spectra for ZZ and RR.
Summary
Clearly, there is much more that can be said about the morphology of this PET fiber from these 2D-COS results than I have explored here. My goal has been to demonstrate that 2D-COS of vibrational spectra can provide more information on this (and other) polymers than simple spectral interpretation. By following dynamic changes (in this case caused by thermal changes), one can piece together a fuller picture of structural changes in a polymer. The point is to provide a tool for the engineer to use spectral changes revealed by 2D-COS to interpret structural changes determined by processing conditions, so that polymer materials can be rationally engineered for particular applications with known mechanical requirements. After I have had a chance to more fully interpret these results, I hope/expect to publish a full article.
As always, I am recognizing Herman Noether posthumously for introducing me to polymer material science. I also want to thank Isao Noda for developing 2D-COS and introducing me to it; it is a multivariate tool that provides structural information from spectral features that cannot be easily "seen" in single spectra. I also want to thank my colleague Sergey Mamedov, who spent some time helping me to plough through matrix algebra that I learned 50 years ago.
References
(1) F. Adar, Spectroscopy 33(2), 14-18 (2018).
(2) F. Adar, Spectroscopy 33(6), 12-20 (2018).
(3) F.J. Boerio and R.A. Bailey, Polymer Lett. Ed. 12, 433-437 (1974).
(4) F. Adar and H. Noether, Polymer 26, 1935-1943 (1985).
(5) J. Purvis and D.I. Bower, J. Polym. Sci., Polym. Phys. Edn. 14, 461-484 (1974).
(6) S.K. Bahl, D.D. Cornell, F.J. Boerio, and G.E. McGraw, Polymer Letters Division 12, 13-19 (1974).
(7) F.J. Boerio, S.K. Bahl, and G.E. McGraw, J. Polym. Sci. Polym. Phys. Ed. 14, 1029-1046 (1976).
(8) J. Stokr, B. Schneider, D. Doskocilova, J. Lovy, and P. Sedlacek, Polymer 24, 714-721 (1982).
(9) R.D.P. Daubeny, C.W. Bunn and C.J. Brown, Proc. Roy Soc. A 226, 1167 (1954).
(10) A.J. Melveger, J. Polym. Sci. A-2 10, 317-322 (1974).
(11) M. Richard-Lacroix and C. Pellerin, Macromolecules 4-5, 1946-1953 (2012).
(12) C.C.C. Lesko, J.F. Rabolt, R.M. Ikeda, B. Chase and A. Kennedy, J. Molecular Struct. 521, 127-136 (2000).
(13) J.C. Rodrigues-Cabello, L. Quintanilla and J.M. Pastor, J Raman Spec. 25, 335-344 (1994).
(14) S. Yang and S. Michielsen, Macromolecules, 35(27), 10108-10113 (2002)
Fran Adar

Fran Adar is the Principal Raman Applications Scientist for Horiba Scientific in Edison, New Jersey. Direct correspondence to: SpectroscopyEdit@UBM.com

New Raman Spectroscopy Method Enhances Real-Time Monitoring Across Fermentation Processes
April 15th 2025Researchers at Delft University of Technology have developed a novel method using single compound spectra to enhance the transferability and accuracy of Raman spectroscopy models for real-time fermentation monitoring.
Nanometer-Scale Studies Using Tip Enhanced Raman Spectroscopy
February 8th 2013Volker Deckert, the winner of the 2013 Charles Mann Award, is advancing the use of tip enhanced Raman spectroscopy (TERS) to push the lateral resolution of vibrational spectroscopy well below the Abbe limit, to achieve single-molecule sensitivity. Because the tip can be moved with sub-nanometer precision, structural information with unmatched spatial resolution can be achieved without the need of specific labels.
AI Shakes Up Spectroscopy as New Tools Reveal the Secret Life of Molecules
April 14th 2025A leading-edge review led by researchers at Oak Ridge National Laboratory and MIT explores how artificial intelligence is revolutionizing the study of molecular vibrations and phonon dynamics. From infrared and Raman spectroscopy to neutron and X-ray scattering, AI is transforming how scientists interpret vibrational spectra and predict material behaviors.